. 2020 Feb 14;134(3):721-732.
doi: 10.3171/2019.11.JNS192028. Print 2021 Mar 1.

Targeting glioma-initiating cells via the tyrosine metabolic pathway

Affiliations

Targeting glioma-initiating cells via the tyrosine metabolic pathway

Daisuke Yamashita et al. J Neurosurg. .

Abstract

Objective: Despite an aggressive multimodal therapeutic regimen, glioblastoma (GBM) continues to portend a grave prognosis, which is driven in part by tumor heterogeneity at both the molecular and cellular levels. Accordingly, herein the authors sought to identify metabolic differences between GBM tumor core cells and edge cells and, in so doing, elucidate novel actionable therapeutic targets centered on tumor metabolism.

Methods: Comprehensive metabolic analyses were performed on 20 high-grade glioma (HGG) tissues and 30 glioma-initiating cell (GIC) sphere culture models. The results of the metabolic analyses were combined with the Ivy GBM data set. Differences in tumor metabolism between GBM tumor tissue derived from within the contrast-enhancing region (i.e., tumor core) and that from the peritumoral brain lesions (i.e., tumor edge) were sought and explored. Such changes were ultimately confirmed at the protein level via immunohistochemistry.

Results: Metabolic heterogeneity in both HGG tumor tissues and GBM sphere culture models was identified, and analyses suggested that tyrosine metabolism may serve as a possible therapeutic target in GBM, particularly in the tumor core. Furthermore, activation of the enzyme tyrosine aminotransferase (TAT) within the tyrosine metabolic pathway influenced the noted therapeutic resistance of the GBM core.

Conclusions: Selective inhibition of the tyrosine metabolism pathway may prove highly beneficial as an adjuvant to multimodal GBM therapies.

Keywords: glioblastoma; heterogeneity; high-grade glioma; metabolism; nitrogen metabolism; oncology; tyrosine aminotransferase.


Figures
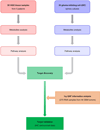
FIG. 1.
FIG. 1.
Schematic outlining procedural identification of viable targets and validating assay for evaluation of clinical relevance.
FIG. 2.
FIG. 2.
Metabolic characterization of surgically derived tumor tissues from patients with HGG. A: Table detailing the relevant tumor tissue sample data for 1 anaplastic oligodendroglioma and 4 GBM patients. B: Preoperative T1-weighted MR images obtained in patient 4 (P4), depicting a left frontal solitary lesion with heterogeneous, Gd-positive enhancement in a postcontrast study. C: Postresection gross tumor from P4 partitioned into 4 distinct samples. D: Representative photomicrographs with H & E staining of tumor samples from P2 (left) and P6 (right) demonstrating typical GBM features. Bar = 200 μm. E: Consensus clustering of the identified metabolite profiles from tumor samples. K = number of clusters. F: Principal component analysis (PCA) of all tumor samples according to spatially distinctive profiles. PC1 = first principal component; PC2 = second principal component. G: Distribution of 3 groups in all tumor samples.
FIG. 3.
FIG. 3.
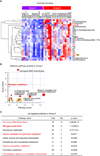
Metabolic analysis across surgically derived tumor tissues from patients with HGG. A: Heatmap of 18 tumor tissue samples derived from 5 patients with an unsupervised hierarchical clustering of metabolites (columns) per each sample (rows). Red indicates higher expression, while blue indicates lower expression. B: Bubble plot for significance and enrichment of metabolic pathways in group III tumor tissue samples. C: Table detailing upregulated metabolic pathways in group III tumor tissue samples.
FIG. 4.
FIG. 4.
Metabolic characterization of GIC spheres. A: Table detailing relevant data for 30 GIC spheres separated into 3 GBM subtypes: proneural (PN), mesenchymal (MES), and classical (CL). B: Consensus clustering of the identified metabolite profiles from GIC spheres. C: PCA of all GIC spheres according to spatially distinctive profiles. D: Distribution of 3 GBM subtypes in both group I and group II GIC spheres.
FIG. 5.
FIG. 5.
Metabolic analysis of GIC spheres. A: Heatmap of 30 GIC spheres with an unsupervised hierarchical clustering of metabolites (column) per each GIC sphere (row). Red indicates higher expression, while blue indicates lower expression. B: Bubble plot for significance and enrichment of metabolic pathways in group II GIC spheres. C: Table detailing upregulated metabolic pathways in group II GIC spheres.
FIG. 6.
FIG. 6.
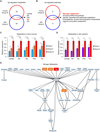
Identification of upregulated metabolites and metabolic pathways. A: Venn diagram showing 5 upregulated metabolites in both group III tumor tissue samples and group II GIC spheres. B: Venn diagram showing 5 upregulated metabolic pathways in both group III tumor tissue samples and group II GIC spheres. C: Expression of 5 upregulated metabolites in 3 groups of tumor tissue samples. *p < 0.05, **p < 0.01, and ***p < 0.001. D: Expression of 5 upregulated metabolites in 2 groups of GIC spheres. *p < 0.05 and ***p < 0.001. E: Location of 4 upregulated metabolites in the nitrogen metabolism pathway.
FIG. 7.
FIG. 7.
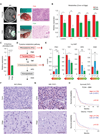
Key molecules for abnormal tyrosine metabolism in HGG. A: Gd-enhancing T1-weighted (upper left) and T2-weighted (lower left) MR images obtained in a GBM patient, depicting the surgically resected core (upper center) and edge (lower center) of the GBM. H & E staining of GBM core (upper right) and edge (lower right) tissues. Bar = 100 μm. B: Expression of 5 upregulated metabolites in core and edge GBM tissues. *p < 0.05, **p < 0.01, and ***p < 0.001. C: Expression of 4-hydroxy-phenylpyruvate in core and edge GBM tissues. D: Key metabolites and enzymes in the tyrosine metabolism pathway. E: Data from RNA-seq from the Ivy GAP database showing the expression of 4 enzymes (PAH, TAT, HPD, and HGD). CT = cellular tumor; IT = infiltrating tumor; LE = leading edge. *p < 0.05 and ***p < 0.001. F: Representative IHC imaging for PAH within the GBM core and edge tissues. Bar = 100 μm. G: Representative IHC imaging for TAT within the GBM core and edge tissues. Bar = 100 μm. H: Kaplan-Meier survival curve comparing survival of GBM patients from the Glioblastoma-TCGA-395-MAS5.0–u133a data set (upper) and Glioma-French-284-MAS5.0–u133p2 data set (lower), according to high or low TAT expression.

References

    1. Agnihotri S, Zadeh G: Metabolic reprogramming in glioblastoma: the influence of cancer metabolism on epigenetics and unanswered questions. Neuro Oncol 18:160–172, 2016 - PMC - PubMed
    1. Ahluwalia MS, Patton C, Stevens G, Tekautz T, Angelov L, Vogelbaum MA, et al.: Phase II trial of ritonavir/lopinavir in patients with progressive or recurrent high-grade gliomas. J Neurooncol 102:317–321, 2011 - PubMed
    1. Ahmed KA, Chinnaiyan P: Applying metabolomics to understand the aggressive phenotype and identify novel therapeutic targets in glioblastoma. Metabolites 4:740–750, 2014 - PMC - PubMed
    1. Aisenberg AC, Reinafarje B, Potter VR: Studies on the Pasteur effect. I. General observations. J Biol Chem 224:1099–1113, 1957 - PubMed
    1. Argilés JM, Costelli P, Carbó N, Pallarés-Trujillo J, López-Soriano FJ: Tumour growth and nitrogen metabolism in the host. Int J Oncol 14:479–486, 1999 - PubMed