

Evaluating the Performance of the WHO International Reference Standard for Osteoporosis Diagnosis in Postmenopausal Women of Varied Polygenic Score and Race
- PMID: 32059423
- PMCID: PMC7074342
- DOI: 10.3390/jcm9020499
Evaluating the Performance of the WHO International Reference Standard for Osteoporosis Diagnosis in Postmenopausal Women of Varied Polygenic Score and Race
Abstract
Background: Whether the bone mineral density (BMD) T-score performs differently in osteoporosis classification in women of different genetic profiling and race background remains unclear.
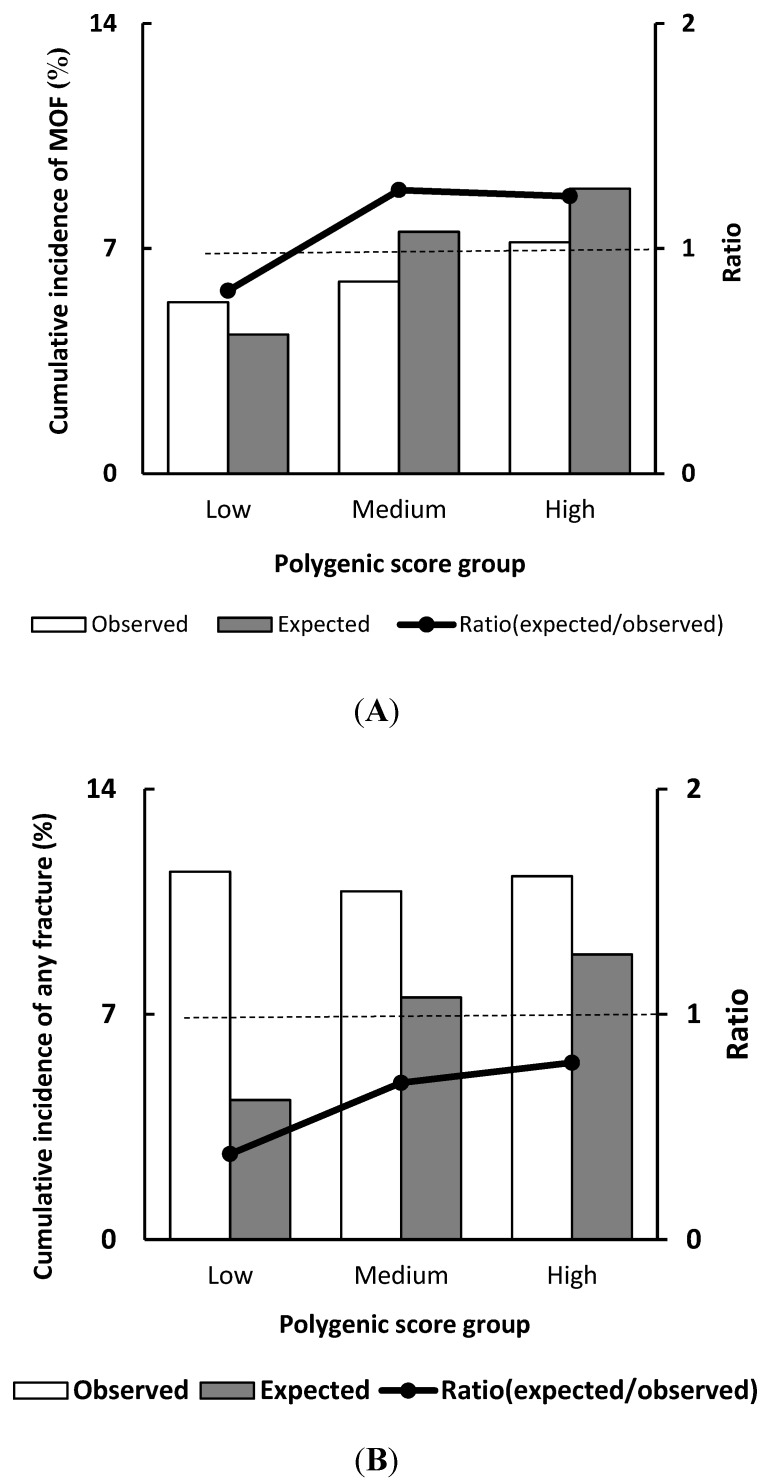
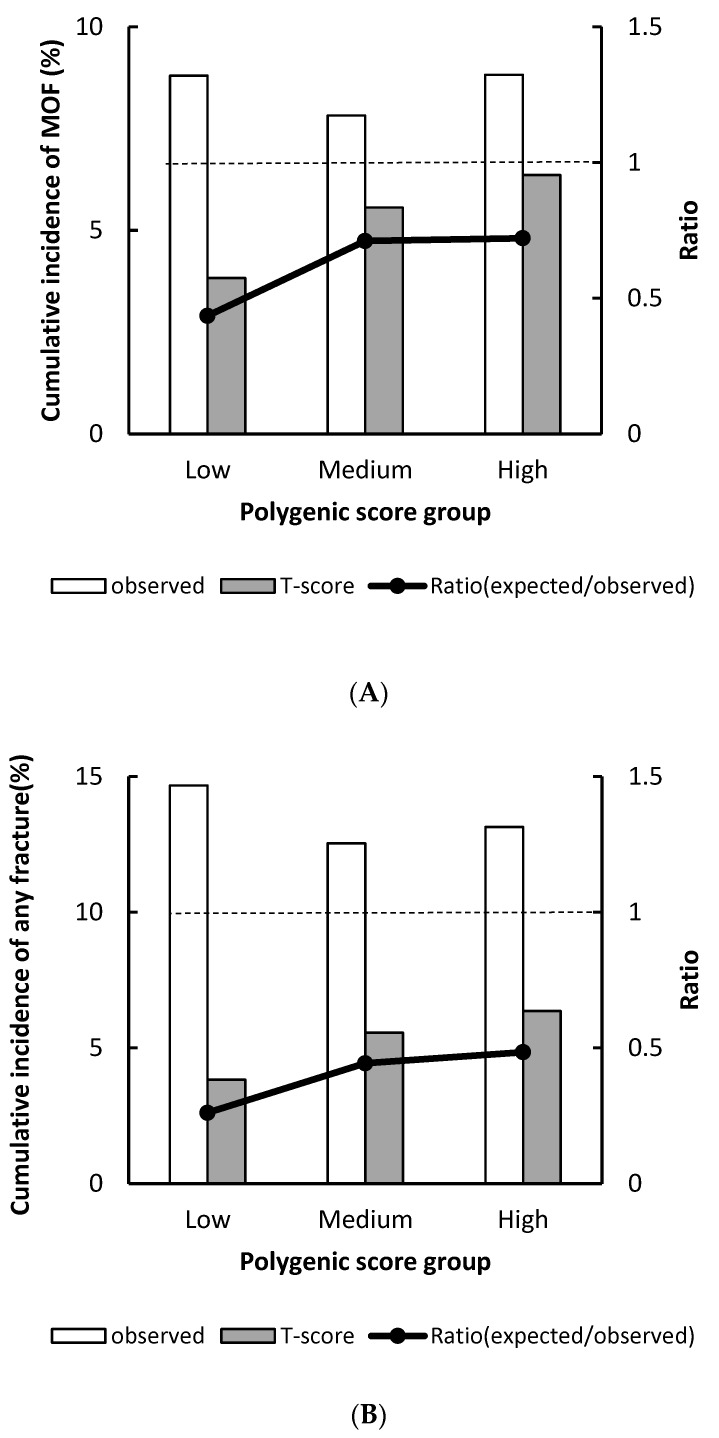
Methods: The genomic data in the Women's Health Initiative study was analyzed (n = 2417). The polygenic score (PGS) was calculated from 63 BMD-associated single nucleotide polymorphisms (SNPs) for each participant. The World Health Organization's (WHO) definition of osteoporosis (BMD T-score ≤-2.5) was used to estimate the cumulative incidence of fracture.
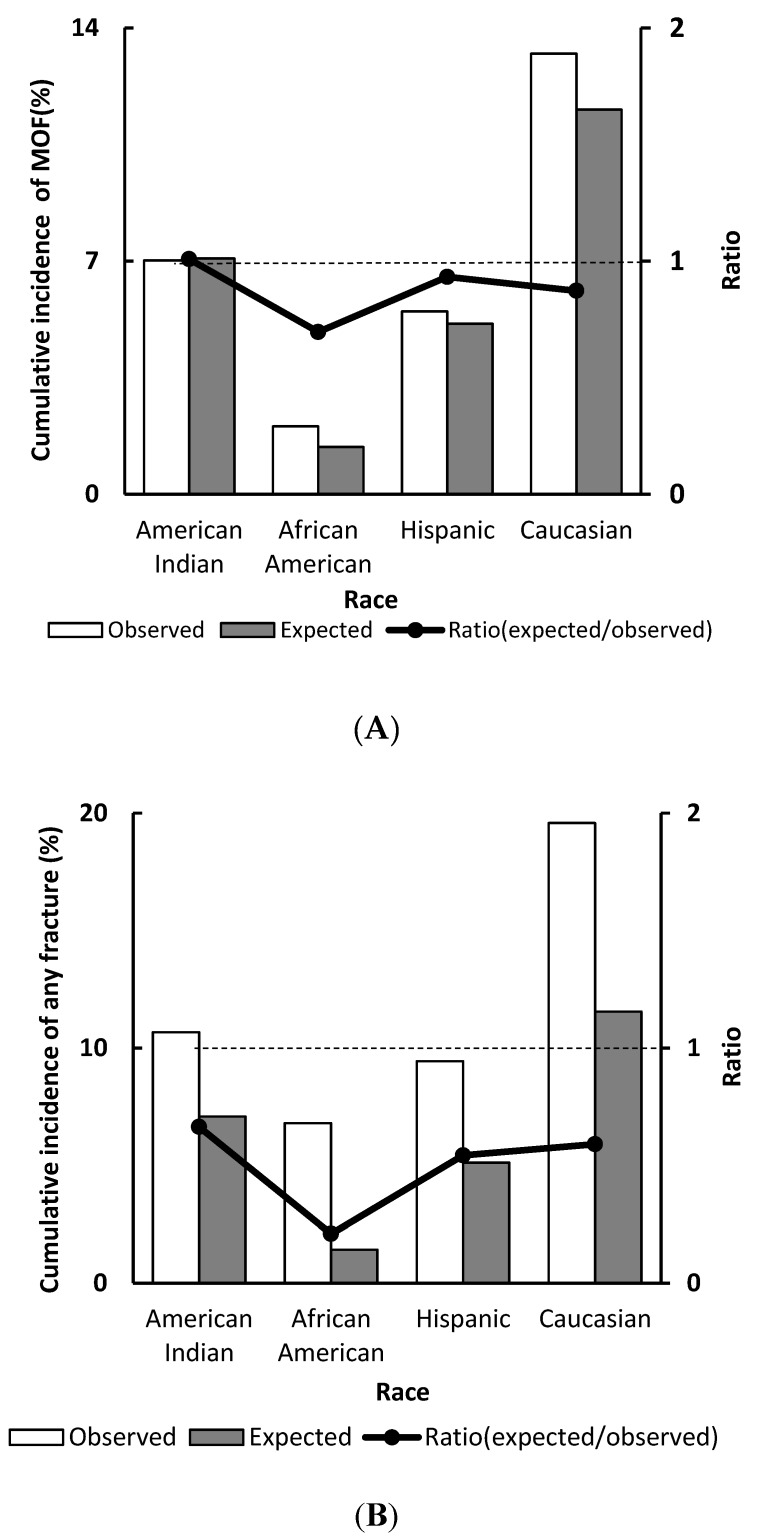
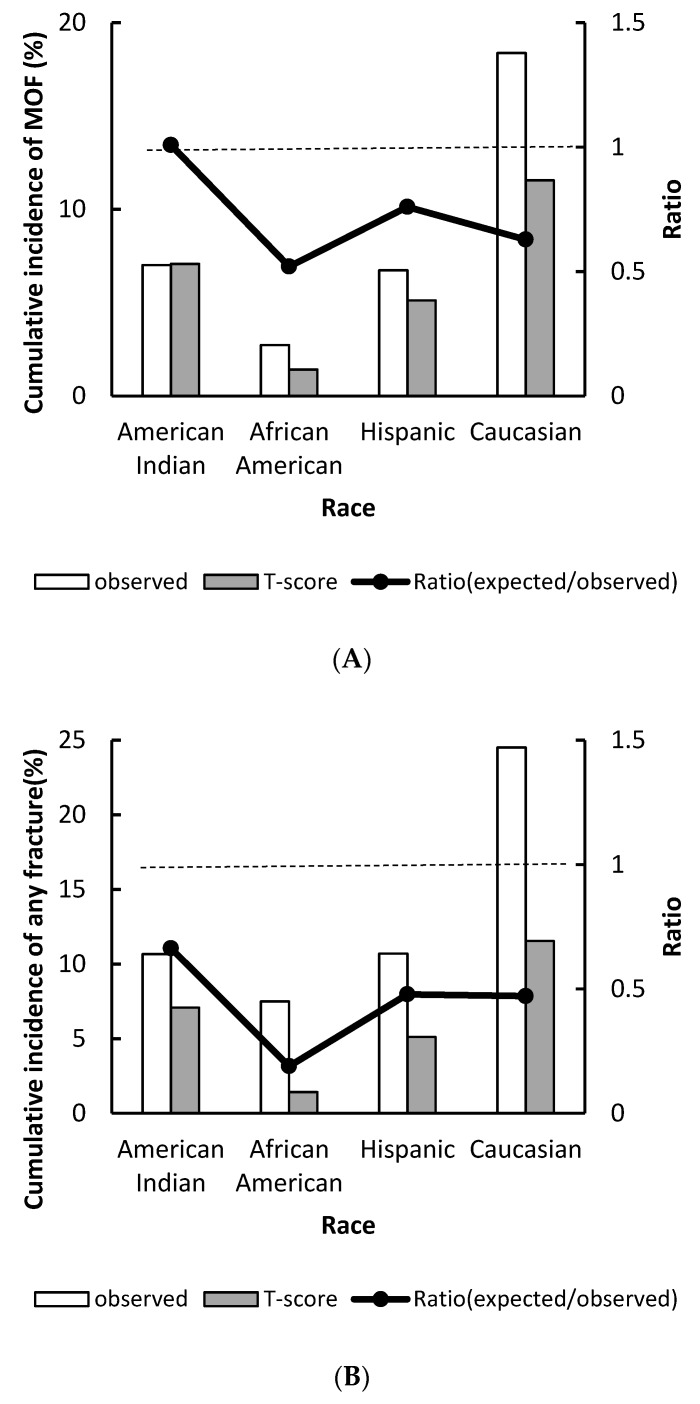
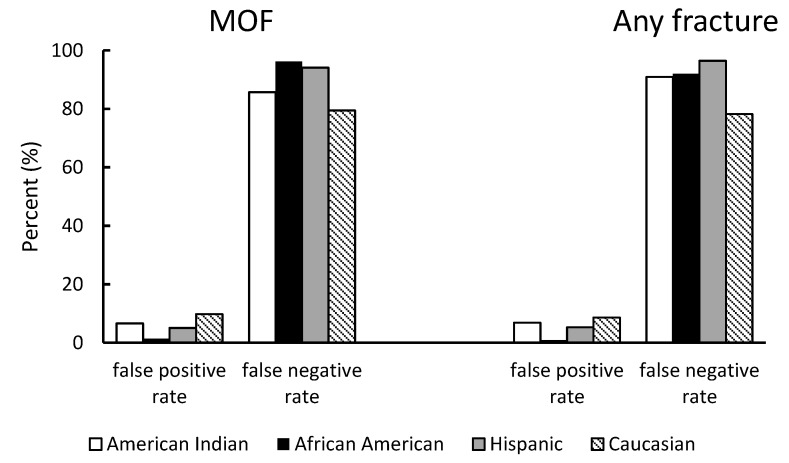
Results: T-score classification significantly underestimated the risk of major osteoporotic fracture (MOF) in the WHI study. An enormous underestimation was observed in African American women (POR: 0.52, 95% CI: 0.30-0.83) and in women with low PGS (predicted/observed ratio [POR]: 0.43, 95% CI: 0.28-0.64). Compared to Caucasian women, African American, African Indian, and Hispanic women respectively had a 59%, 41%, and 55% lower hazard of MOF after the T-score was adjusted for. The results were similar when used for any fractures.
Conclusions: Our study suggested the BMD T-score performance varies significantly by race in postmenopausal women.
Keywords: bone mineral density (BMD); polygenic score (PGS); single nucleotide polymorphism (SNP).
Conflict of interest statement
The authors declare no conflict of interest.
Figures


References
-
- National Clinical Guideline Centre . Osteoporosis: Fragility Fracture Risk: Osteoporosis: Assessing the Risk of Fragility Fracture. Royal College of Physicians (UK); National Clinical Guideline Centre; London, UK: 2012. National Clinical Guideline Centre. National Institute for Health and Clinical Excellence: Guidance.
-
- Jeremiah M.P., Unwin B.K., Greenawald M.H., Casiano V.E. Diagnosis and Management of Osteoporosis. Am. Fam. Physician. 2015;92:261–268. - PubMed
Grants and funding
LinkOut - more resources
Full Text Sources
