

Development and Validation of an In-Line API Quantification Method Using AQbD Principles Based on UV-Vis Spectroscopy to Monitor and Optimise Continuous Hot Melt Extrusion Process
- PMID: 32059445
- PMCID: PMC7076712
- DOI: 10.3390/pharmaceutics12020150
Development and Validation of an In-Line API Quantification Method Using AQbD Principles Based on UV-Vis Spectroscopy to Monitor and Optimise Continuous Hot Melt Extrusion Process
Abstract
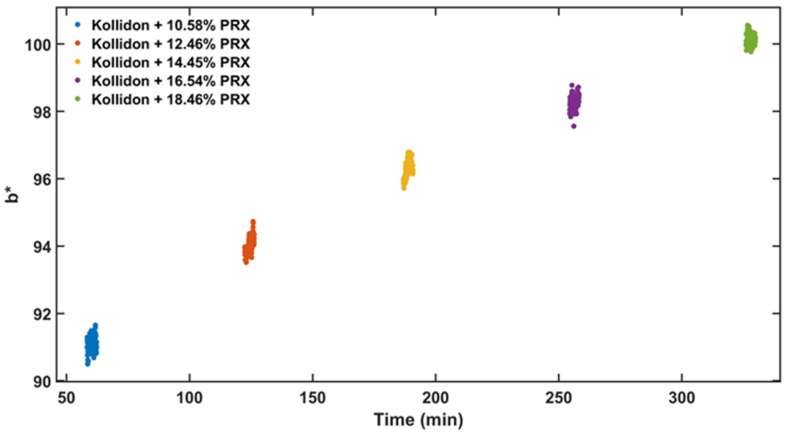
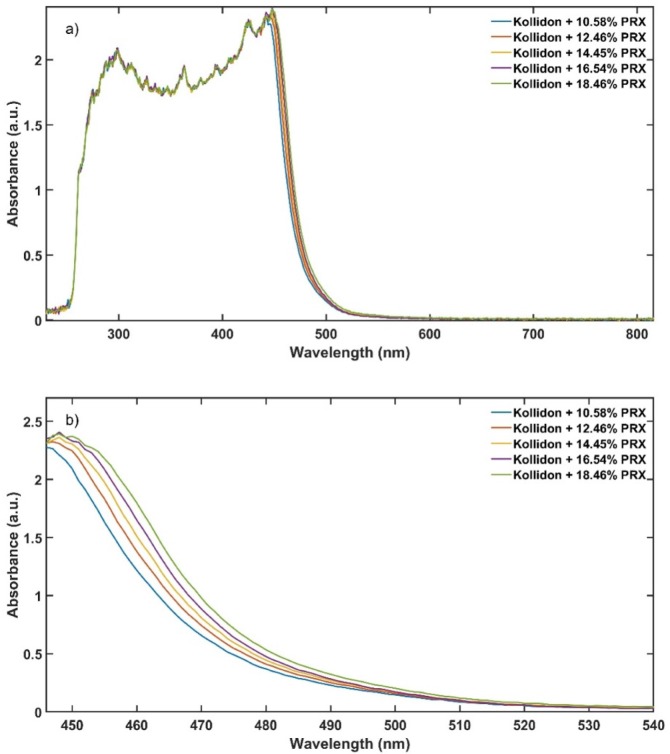
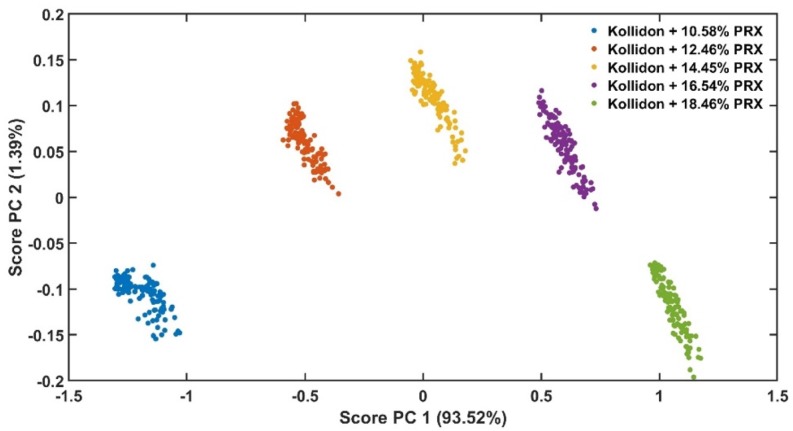
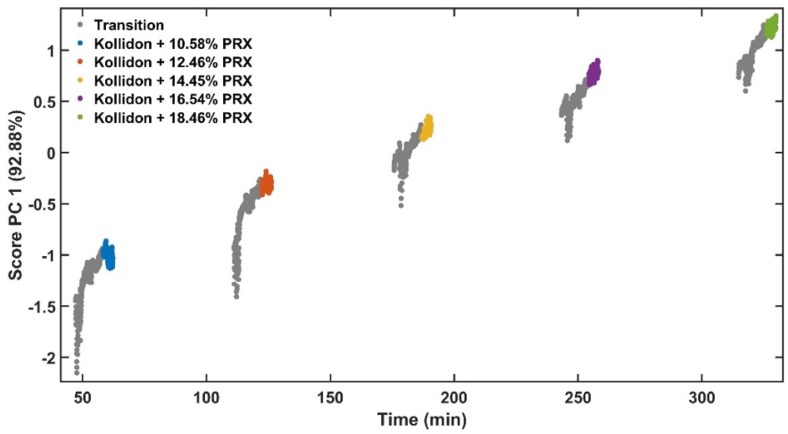
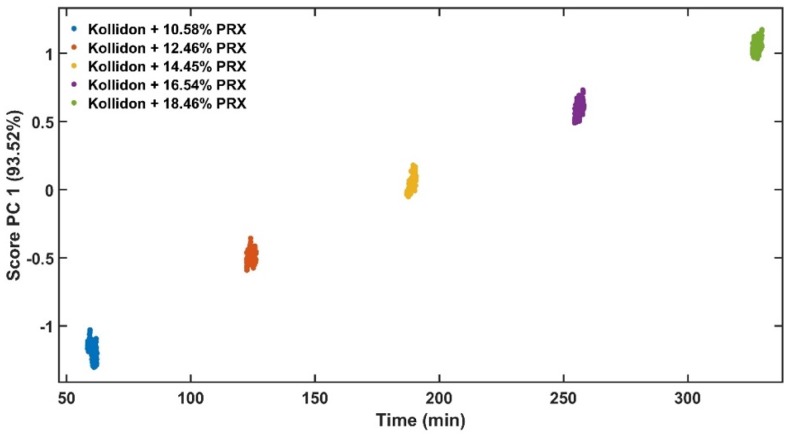
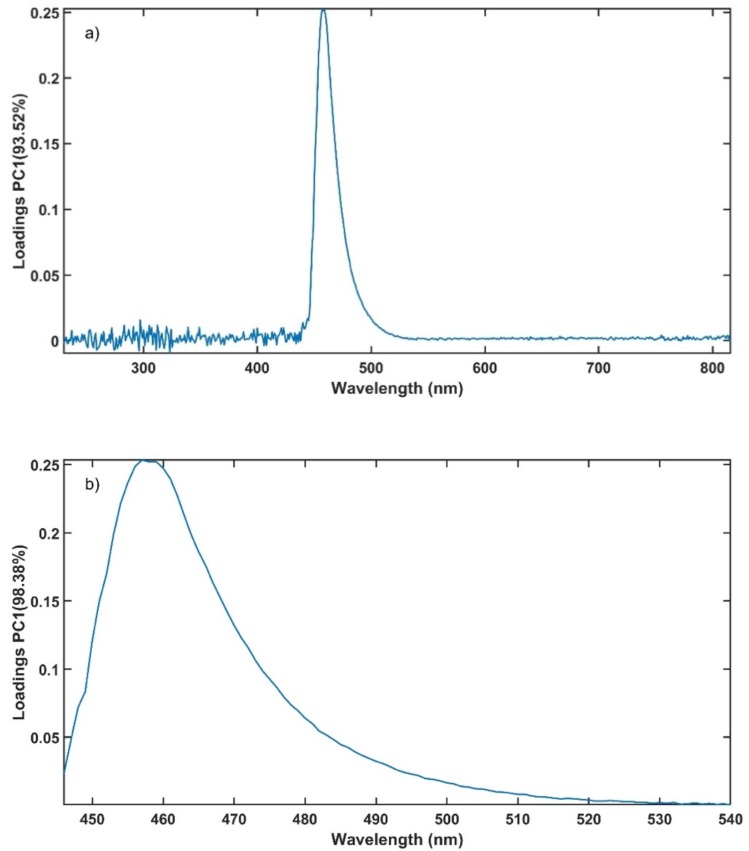
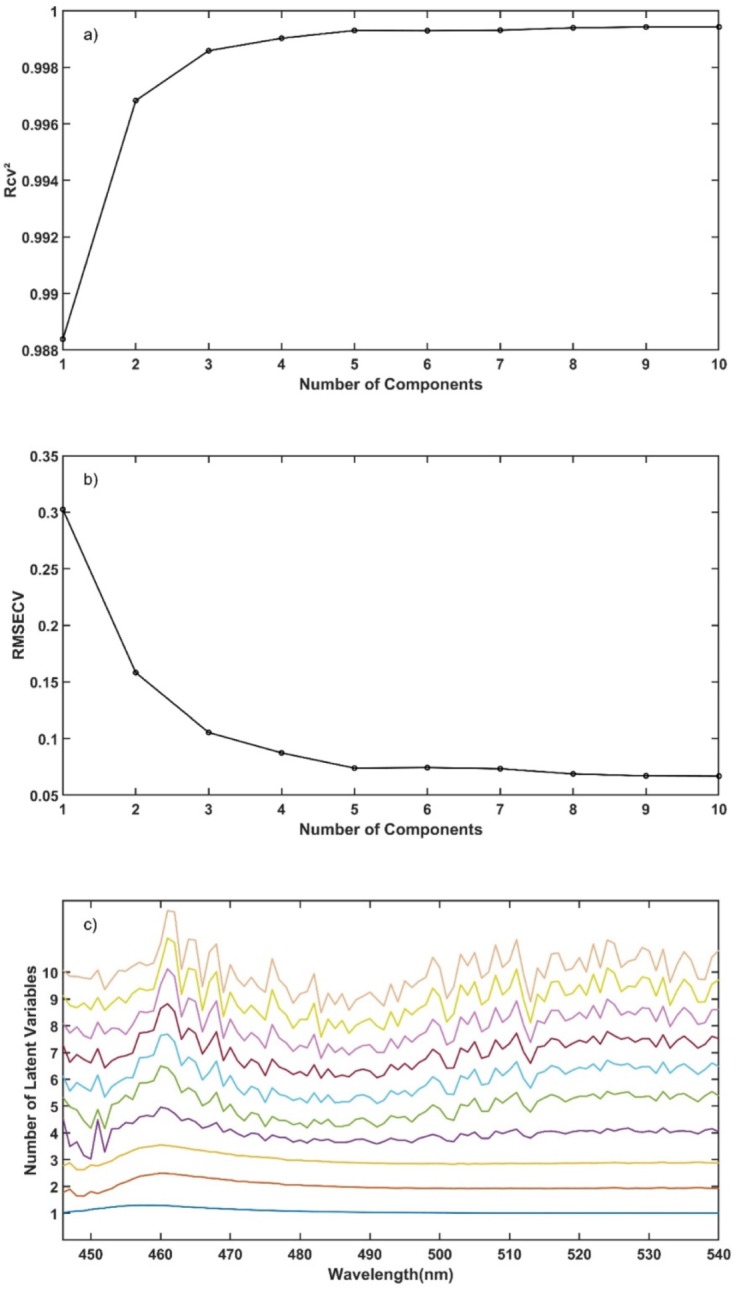
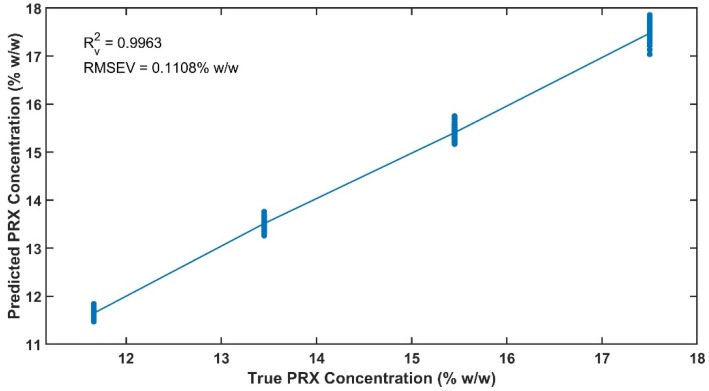
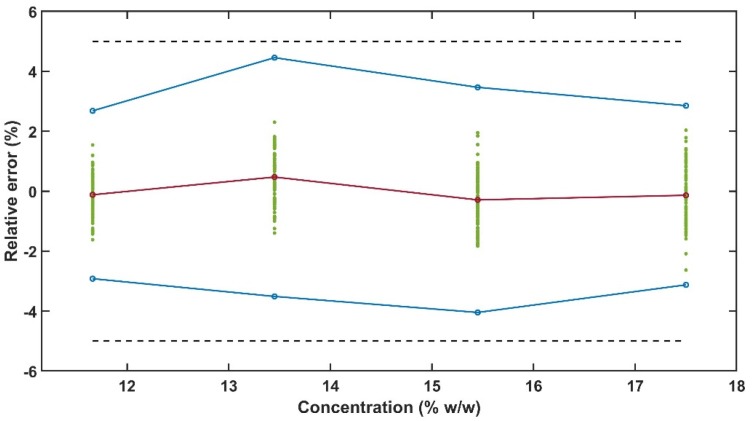
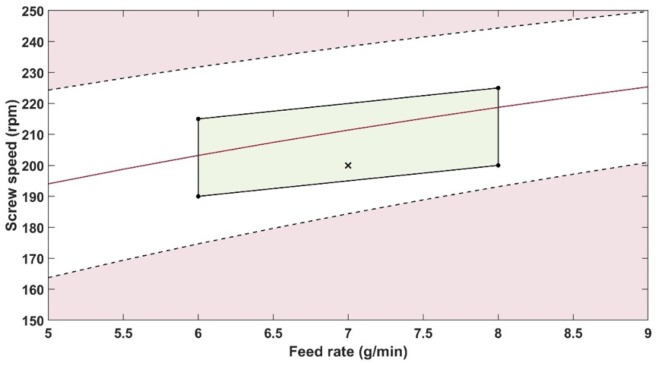
A key principle of developing a new medicine is that quality should be built in, with a thorough understanding of the product and the manufacturing process supported by appropriate process controls. Quality by design principles that have been established for the development of drug products/substances can equally be applied to the development of analytical procedures. This paper presents the development and validation of a quantitative method to predict the concentration of piroxicam in Kollidon® VA 64 during hot melt extrusion using analytical quality by design principles. An analytical target profile was established for the piroxicam content and a novel in-line analytical procedure was developed using predictive models based on UV-Vis absorbance spectra collected during hot melt extrusion. Risks that impact the ability of the analytical procedure to measure piroxicam consistently were assessed using failure mode and effect analysis. The critical analytical attributes measured were colour (L* lightness, b* yellow to blue colour parameters-in-process critical quality attributes) that are linked to the ability to measure the API content and transmittance. The method validation was based on the accuracy profile strategy and ICH Q2(R1) validation criteria. The accuracy profile obtained with two validation sets showed that the 95% β-expectation tolerance limits for all piroxicam concentration levels analysed were within the combined trueness and precision acceptance limits set at ±5%. The method robustness was tested by evaluating the effects of screw speed (150-250 rpm) and feed rate (5-9 g/min) on piroxicam content around 15% w/w. In-line UV-Vis spectroscopy was shown to be a robust and practical PAT tool for monitoring the piroxicam content, a critical quality attribute in a pharmaceutical HME process.
Keywords: AQbD; HME; PAT; QbD; RTRT; analytical procedure validation; analytical quality by design; analytical target profile development; hot melt extrusion; in-line UV-Vis spectroscopy; process analytical technology; quality by design; real time release testing.
Conflict of interest statement
The authors declare no conflict of interest.
Figures
References
-
- Netchacovitch L., Dumont E., Cailletaud J., Thiry J., De Bleye C., Sacré P.-Y., Boiret M., Evrard B., Hubert P., Ziemons E. Development of an analytical procedure for crystalline content determination in amorphous solid dispersions produced by hot-melt extrusion using transmission Raman spectroscopy: A feasibility study. Int. J. Pharm. 2017;530:249–255. doi: 10.1016/j.ijpharm.2017.07.052. - DOI - PubMed
LinkOut - more resources
Full Text Sources
