. 2021 Dec;13(2_suppl):53S-67S.
doi: 10.1177/1947603520903425. Epub 2020 Feb 14.

A Synchronized Circadian Clock Enhances Early Chondrogenesis

Affiliations

A Synchronized Circadian Clock Enhances Early Chondrogenesis

M Abdulhadi Alagha et al. Cartilage. 2021 Dec.

Abstract

Objective: Circadian rhythms in cartilage homeostasis are hypothesized to temporally segregate and synchronize the activities of chondrocytes to different times of the day, and thus may provide an efficient mechanism by which articular cartilage can recover following physical activity. While the circadian clock is clearly involved in chondrocyte homeostasis in health and disease, it is unclear as to what roles it may play during early chondrogenesis.

Design: The purpose of this study was to determine whether the rhythmic expression of the core circadian clock was detectable at the earliest stages of chondrocyte differentiation, and if so, whether a synchronized expression pattern of chondrogenic transcription factors and developing cartilage matrix constituents was present during cartilage formation.

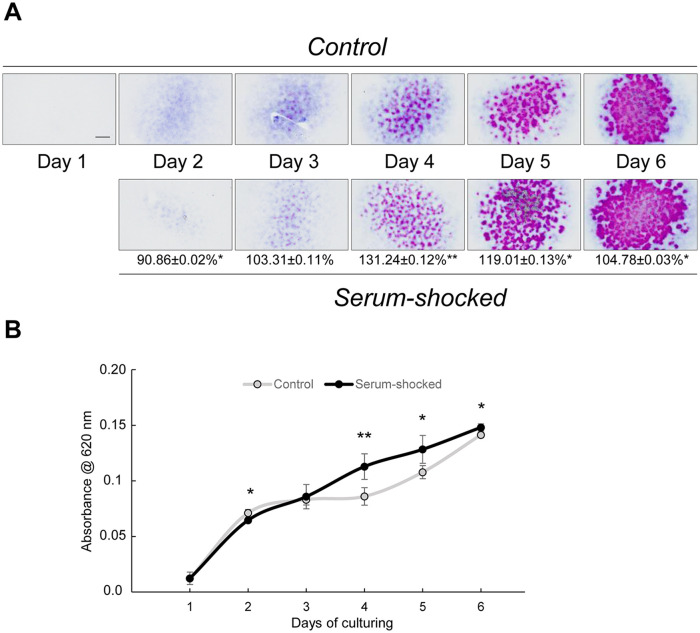
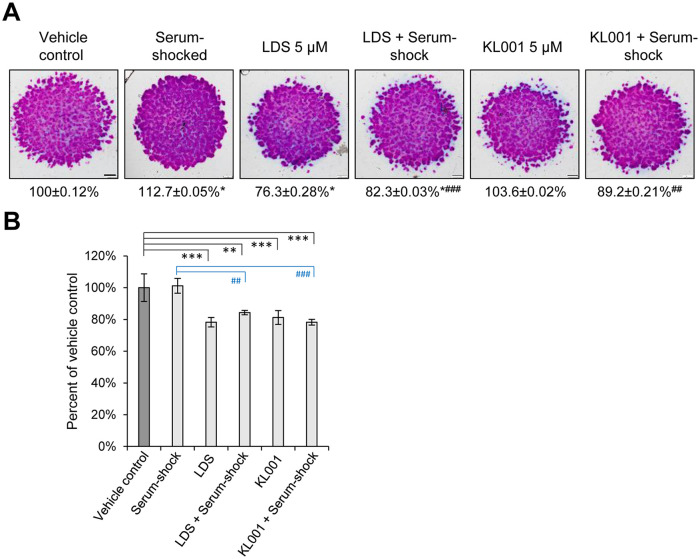
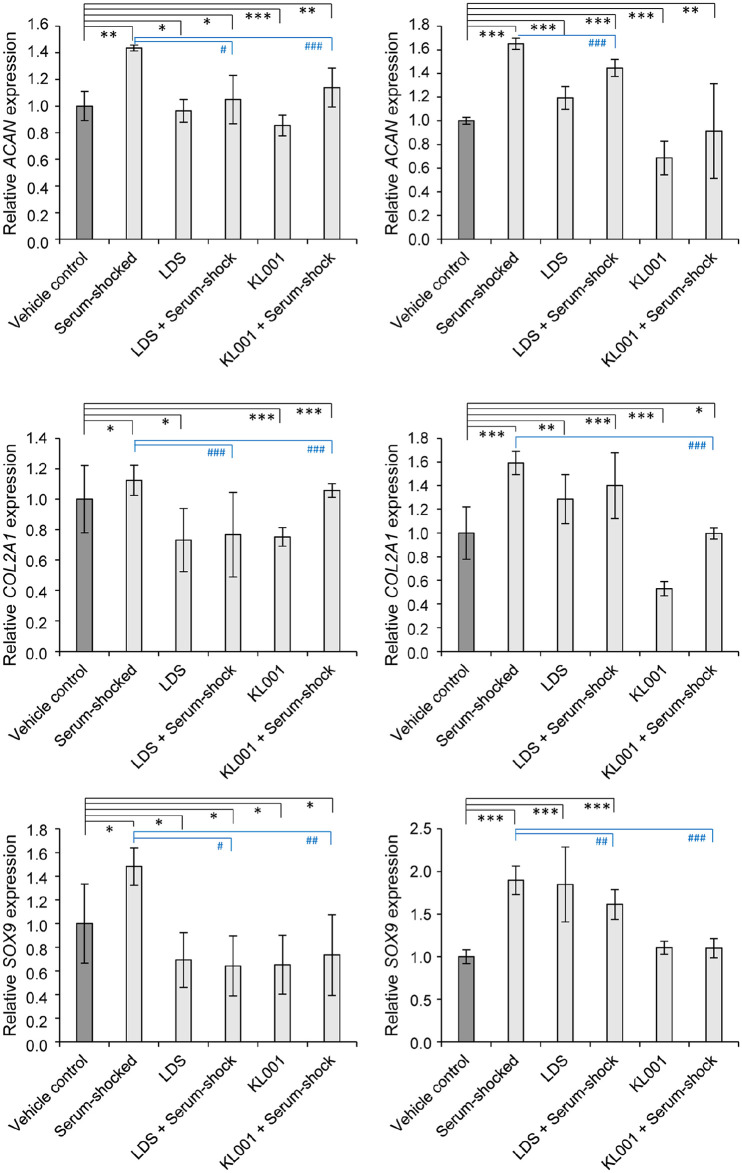
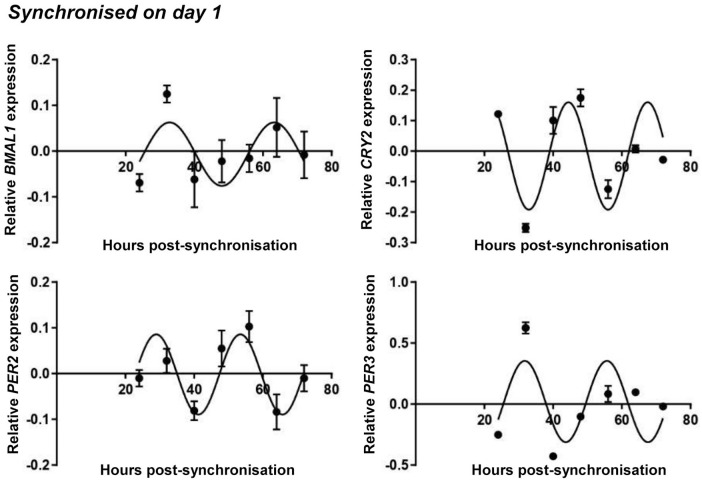
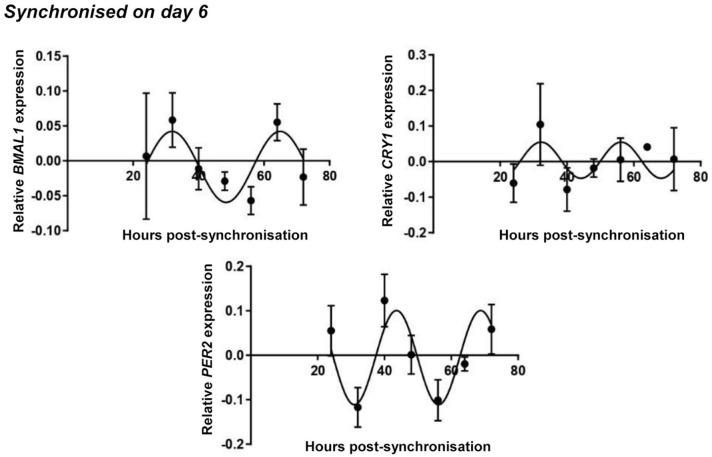
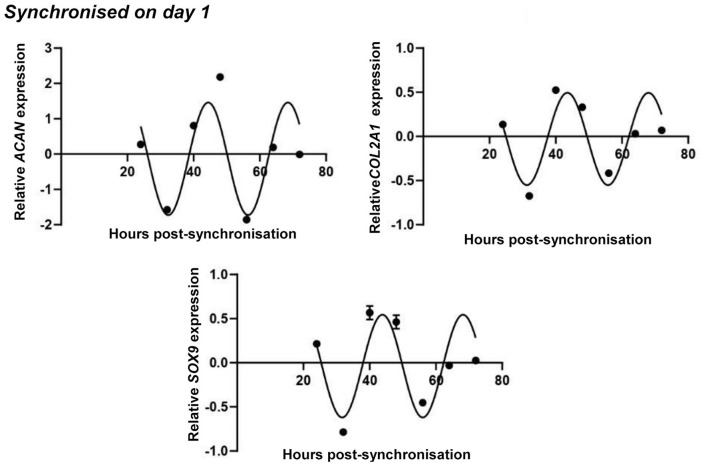
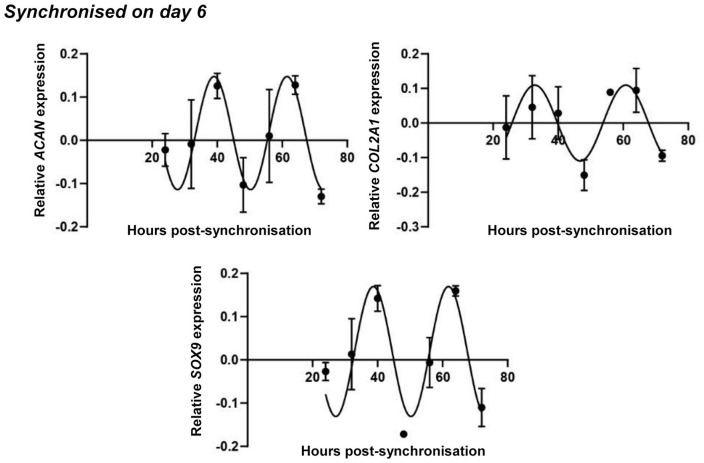
Results: Following serum shock, embryonic limb bud-derived chondrifying micromass cultures exhibited synchronized temporal expression patterns of core clock genes involved in the molecular circadian clock. We also observed that chondrogenic marker genes followed a circadian oscillatory pattern. Clock synchronization significantly enhanced cartilage matrix production and elevated SOX9, ACAN, and COL2A1 gene expression. The observed chondrogenesis-promoting effect of the serum shock was likely attributable to its synchronizing effect on the molecular clockwork, as co-application of small molecule modulators (longdaysin and KL001) abolished the stimulating effects on extracellular matrix production and chondrogenic marker gene expression.

Conclusions: Results from this study suggest that a functional molecular clockwork plays a positive role in tissue homeostasis and histogenesis during early chondrogenesis.

Keywords: KL001; RT-qPCR; circadian rhythm; cosine fits; in vitro chondrogenesis; longdaysin; micromass culture; molecular clock.


Conflict of interest statement

Declaration of Conflicting Interests: The author(s) declared no potential conflicts of interest with respect to the research, authorship, and/or publication of this article.

Figures

Figure 1.
Figure 1.
Serum shock (culturing the cells in F12 medium containing 50% fetal bovine serum [FBS] for 2 hours) on day 1 augments chondrogenesis and metachromatic matrix production in micromass cultures. (A) Time-dependent metachromatic cartilage extracellular matrix (ECM) accumulation during chondrogenesis in control versus serum-synchronized cultures, as determined by dimethyl methylene blue (DMMB; qualitative) and toluidine blue (TB; semiquantitative) staining assays. Original magnification was 2×. Scale bar, 1 mm. Numbers below photomicrographs represent the ratios of optical densities (OD620) of samples containing extracted TB in serum-shocked versus control cultures. Data are expressed as mean ± SD. Statistical significance between serum-shocked and control cultures is indicated by asterisks as follows: P < 0.05 = *; P < 0.01 = **. Representative data out of 3 independent experiments. (B) Time course of optical densities (OD620) of samples containing extracted TB in serum-shocked versus control cultures. Data are expressed as mean ± SD. Statistical significance between serum-shocked versus control cultures is indicated by asterisks as follows: P < 0.05 = *; P < 0.01 = **.
Figure 2.
Figure 2.
Effects of small molecule circadian clock modulators (longdaysin, LDS and KL001; both at 5 µM for 24 hours on day 1) with or without serum shock on cartilage matrix production in micromass cultures. (A) Metachromatic cartilage extracellular matrix (ECM) accumulation by day 6 as determined by dimethyl methylene blue (DMMB; qualitative) and toluidine blue (TB; semiquantitative) staining assays. Original magnification was 2×. Scale bar, 500 µm. Numbers below photomicrographs represent the ratios of optical densities (OD620) of samples containing extracted TB versus control cultures. Data are expressed as mean ± SD. Statistical significance between cultures is indicated by asterisks (relative to vehicle control) or hash signs (relative to serum-shocked cultures) as follows: P < 0.05 = */#; P < 0.01 = **/##; P < 0.001 = ***/###. Representative data out of 3 independent experiments. (B) Mitochondrial activity in micromass cultures following treatment with LDS or KL001 with or without serum-shock versus control cultures on day 1, as determined by MTT assay on day 3. Data are expressed as mean ± SD. Statistical significance between cultures is indicated by asterisks (relative to vehicle control) or hash signs (relative to serum-shocked cultures) as follows: P < 0.05 = */#; P < 0.01 = **/##; P < 0.001 = ***/###.
Figure 3.
Figure 3.
Cartilage-specific marker gene expression on days 3 and 6 following serum-synchronization on day 1, with or without treatment with the circadian clock regulators LDS or KL001. Data are expressed as the mean ± SD relative to the control and normalized against the reference gene PPIA. Statistical significance between gene expression levels is indicated by asterisks (relative to vehicle control) or hash signs (relative to serum-shocked cultures) as follows: P < 0.05 = */#; P < 0.01 = **/##; P < 0.001 = ***/###.
Figure 4.
Figure 4.
Circadian rhythm dynamics in clock gene expression in differentiating embryonic limb bud–derived chondroprogenitor cells of micromass cultures following synchronization with 50% fetal bovine serum (FBS) on culturing day 1. Quantitative RT-PCR analyses followed by cosine fits showing temporal expression profiles of the clock genes BMAL1, CRY2, PER2, and PER3 collected every 8 hours between 24 and 72 hours postsynchronization with serum shock. Data are expressed as the mean of transcript levels as determined by absolute quantification ± SD relative to the 24-hour time point and normalized against the housekeeping gene YWHAZ. Representative data are shown out of 3 independent experiments, each exhibiting similar patterns of gene expression profiles.
Figure 5.
Figure 5.
Circadian rhythm dynamics in clock gene expression in differentiating embryonic limb bud–derived chondroprogenitor cells of micromass cultures following synchronization with 50% fetal bovine serum (FBS) on culturing day 6. Quantitative RT-PCR analyses followed by cosine fits showing temporal expression profiles of the clock genes BMAL1, CRY1, and PER2 collected every 8 hours between 24 and 72 hours postsynchronization with serum shock. Data are expressed as the mean of transcript levels as determined by absolute quantification ± SD relative to the 24-hour time point and normalized against the housekeeping gene RPLP0. Representative data are shown out of 3 independent experiments, each exhibiting similar patterns of gene expression profiles.
Figure 6.
Figure 6.
Circadian rhythm dynamics in SOX9 transcript levels and the expression of genes coding for cartilage extracellular matrix (ECM) constituents (ACAN and COL2A1) in differentiating embryonic limb bud–derived chondroprogenitor cells of micromass cultures following synchronization with 50% fetal bovine serum (FBS) on culturing day 1. Quantitative RT-PCR analyses followed by cosine fits showing temporal expression profiles of clock genes collected every 8 hours between 24 and 72 hours postsynchronization with serum shock. Data are expressed as the mean of transcript levels as determined by absolute quantification ± SD relative to the 24-hour time point and normalized against the housekeeping gene YWHAZ. Representative data are shown out of 3 independent experiments, each exhibiting similar patterns of gene expression profiles.
Figure 7.
Figure 7.
Circadian rhythm dynamics in SOX9 transcript levels and the expression of genes coding for cartilage extracellular matrix (ECM) constituents (ACAN and COL2A1) in differentiating embryonic limb bud–derived chondroprogenitor cells of micromass cultures following synchronization with 50% fetal bovine serum (FBS) on culturing day 6. Quantitative RT-PCR analyses followed by cosine fits showing temporal expression profiles of clock genes collected every 8 hours between 24 and 72 hours postsynchronization with serum shock. Data are expressed as the mean of transcript levels as determined by absolute quantification ± SD relative to the 24-hour time point and normalized against the housekeeping gene RPLP0. Representative data are shown out of 3 independent experiments, each exhibiting similar patterns of gene expression profiles.

Similar articles

Cited by

References

    1. Welsh DK, Takahashi JS, Kay SA. Suprachiasmatic nucleus: cell autonomy and network properties. Annu Rev Physiol. 2010;72:551-77. - PMC - PubMed
    1. Astiz M, Heyde I, Oster H. Mechanisms of communication in the mammalian circadian timing system. Int J Mol Sci. 2019;20(2_suppl):E343. - PMC - PubMed
    1. Potter GD, Skene DJ, Arendt J, Cade JE, Grant PJ, Hardie LJ. Circadian rhythm and sleep disruption: causes, metabolic consequences, and countermeasures. Endocr Rev. 2016;37:584-608. - PMC - PubMed
    1. Mohawk JA, Green CB, Takahashi JS. Central and peripheral circadian clocks in mammals. Annu Rev Neurosci. 2012;35:445-62. - PMC - PubMed
    1. Zhang R, Lahens NF, Ballance HI, Hughes ME, Hogenesch JB. A circadian gene expression atlas in mammals: implications for biology and medicine. Proc Natl Acad Sci U S A. 2014;111(45):16219-24. - PMC - PubMed

Publication types

MeSH terms