. 2020 Mar 23;30(6):1011-1022.e6.
doi: 10.1016/j.cub.2020.01.073. Epub 2020 Feb 13.

Biosurfactant-Mediated Membrane Depolarization Maintains Viability during Oxygen Depletion in Bacillus subtilis

Affiliations

Biosurfactant-Mediated Membrane Depolarization Maintains Viability during Oxygen Depletion in Bacillus subtilis

Heidi A Arjes et al. Curr Biol. .

Abstract

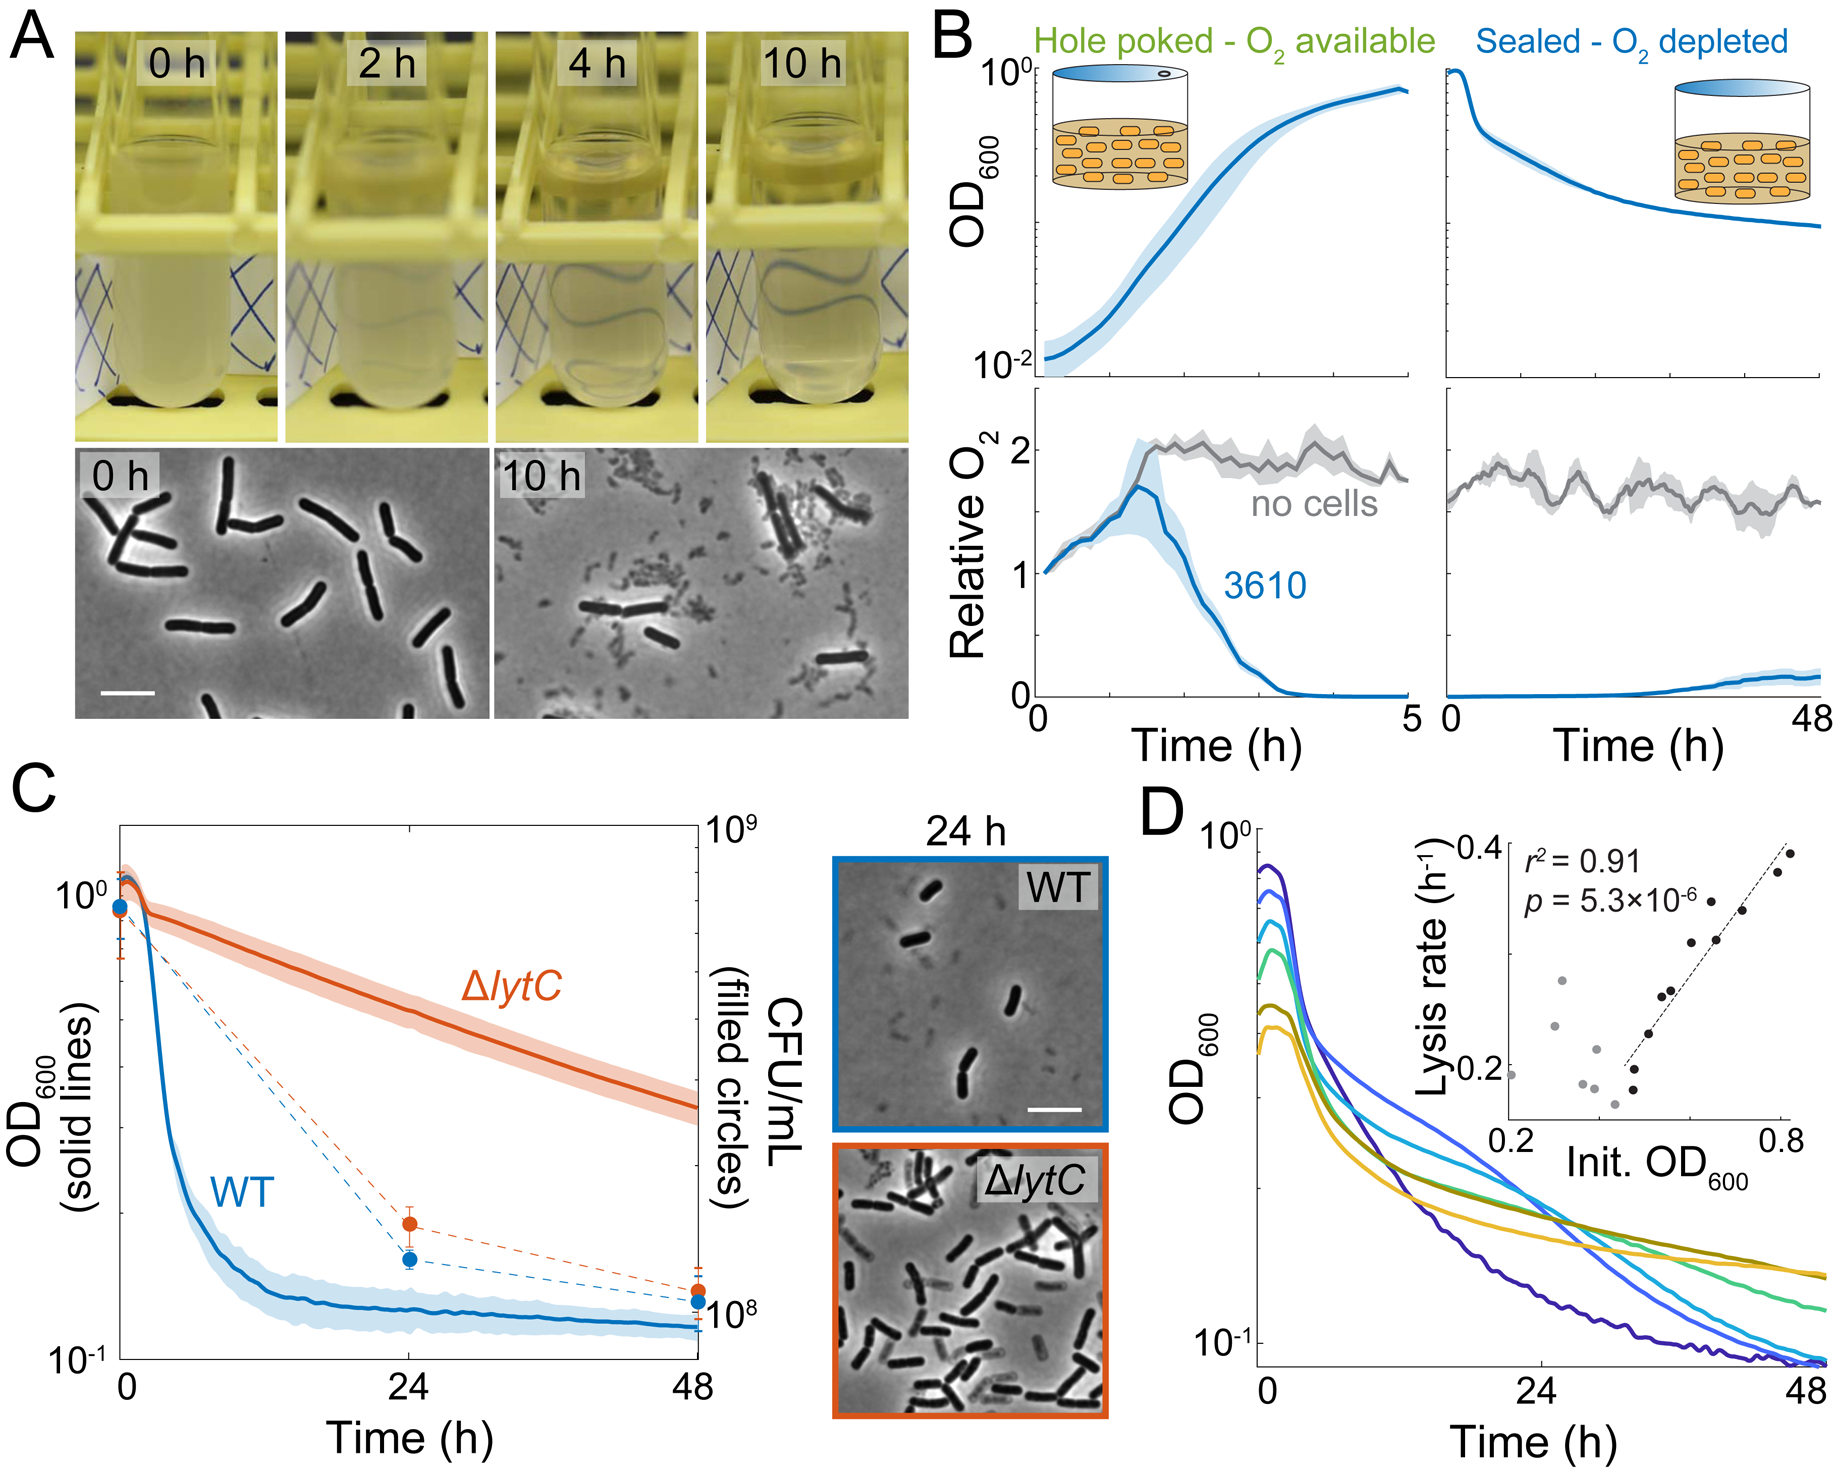
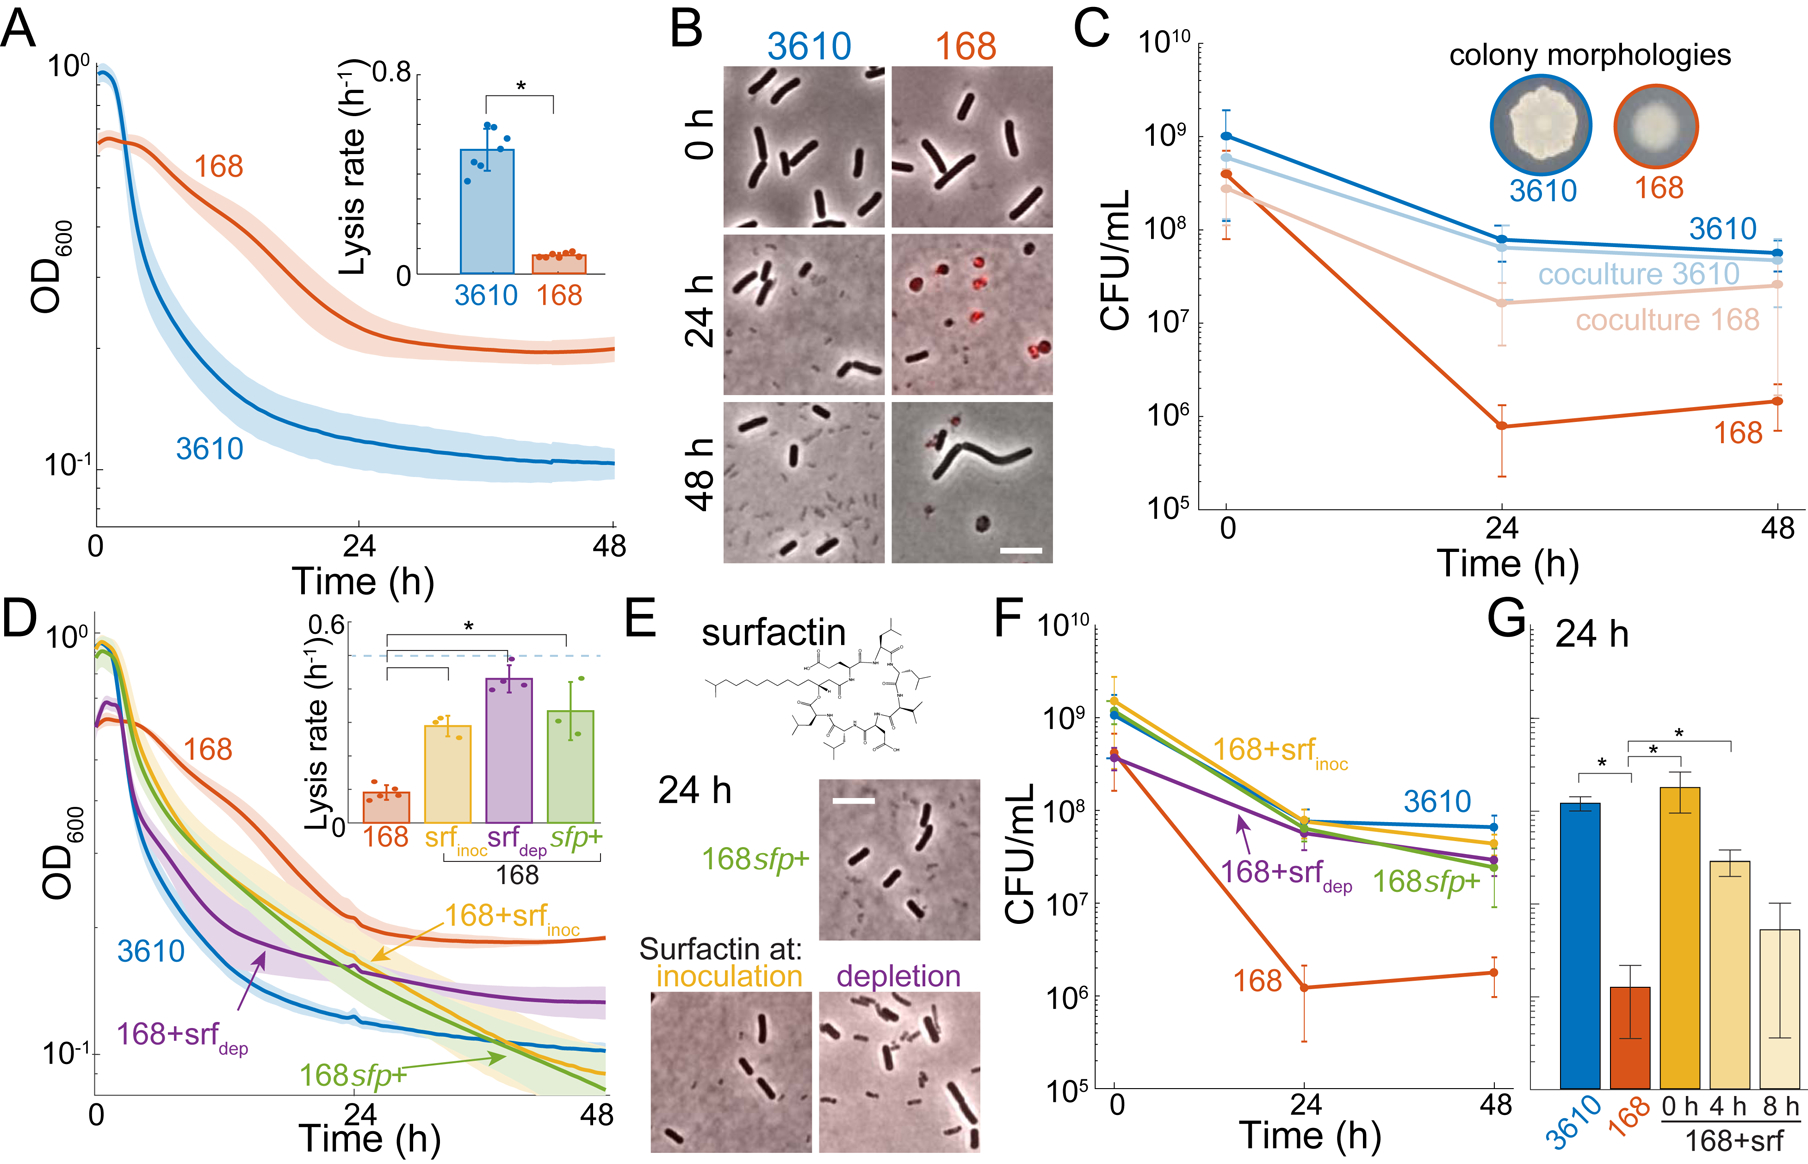
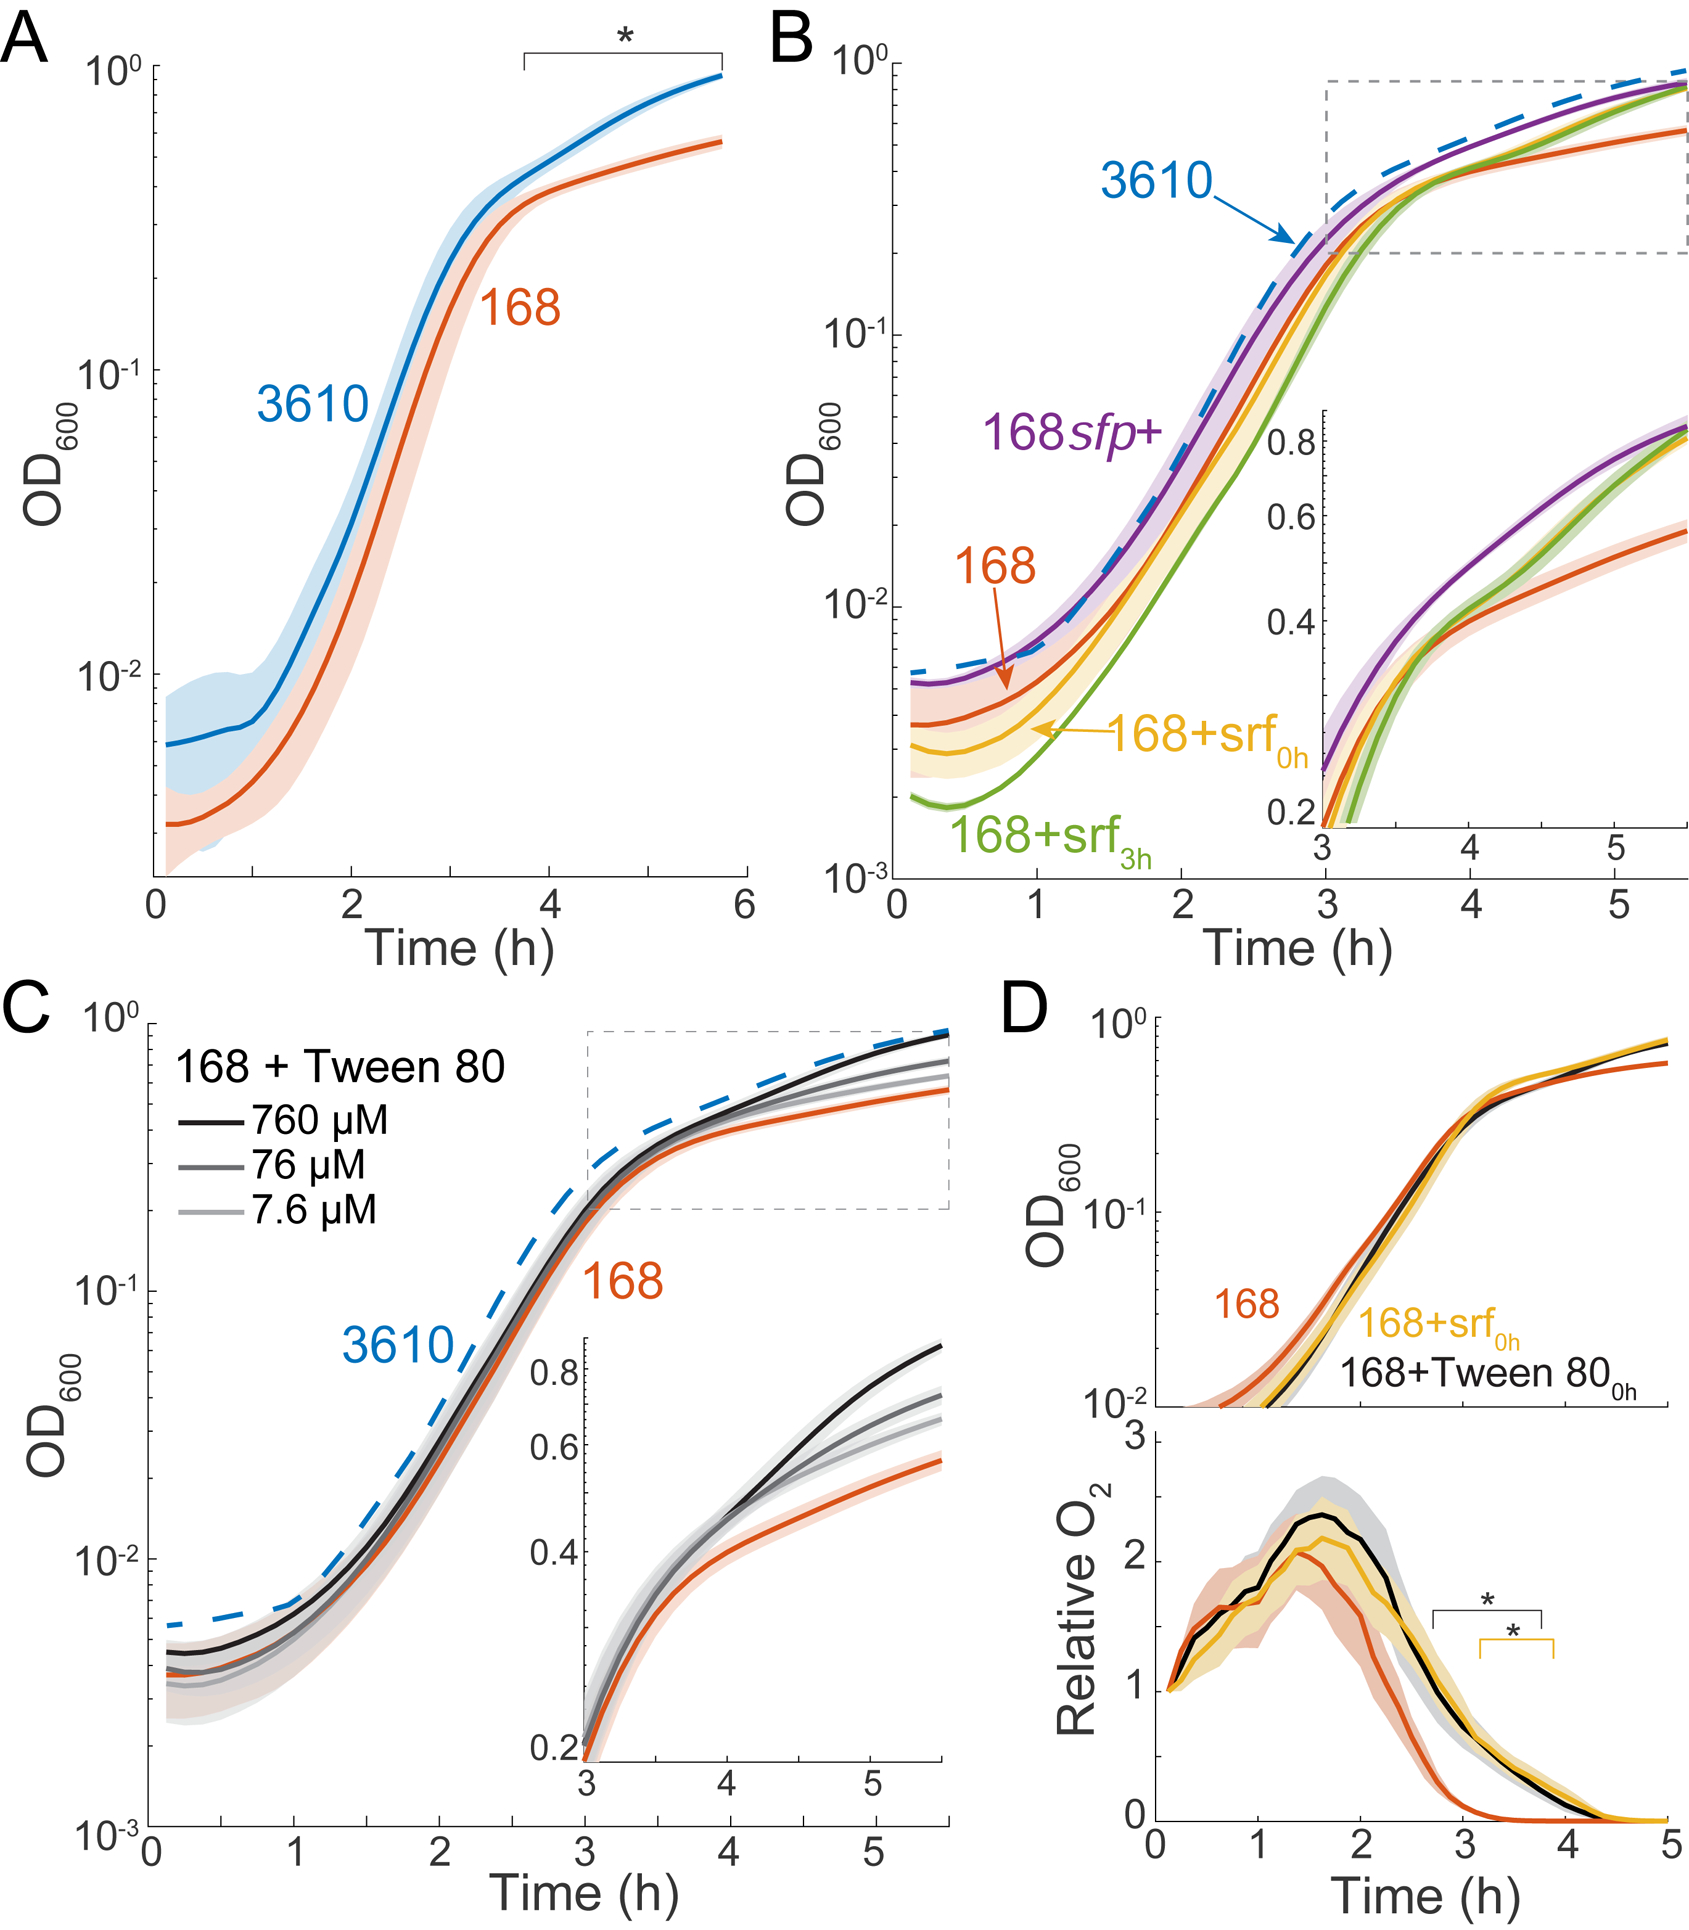
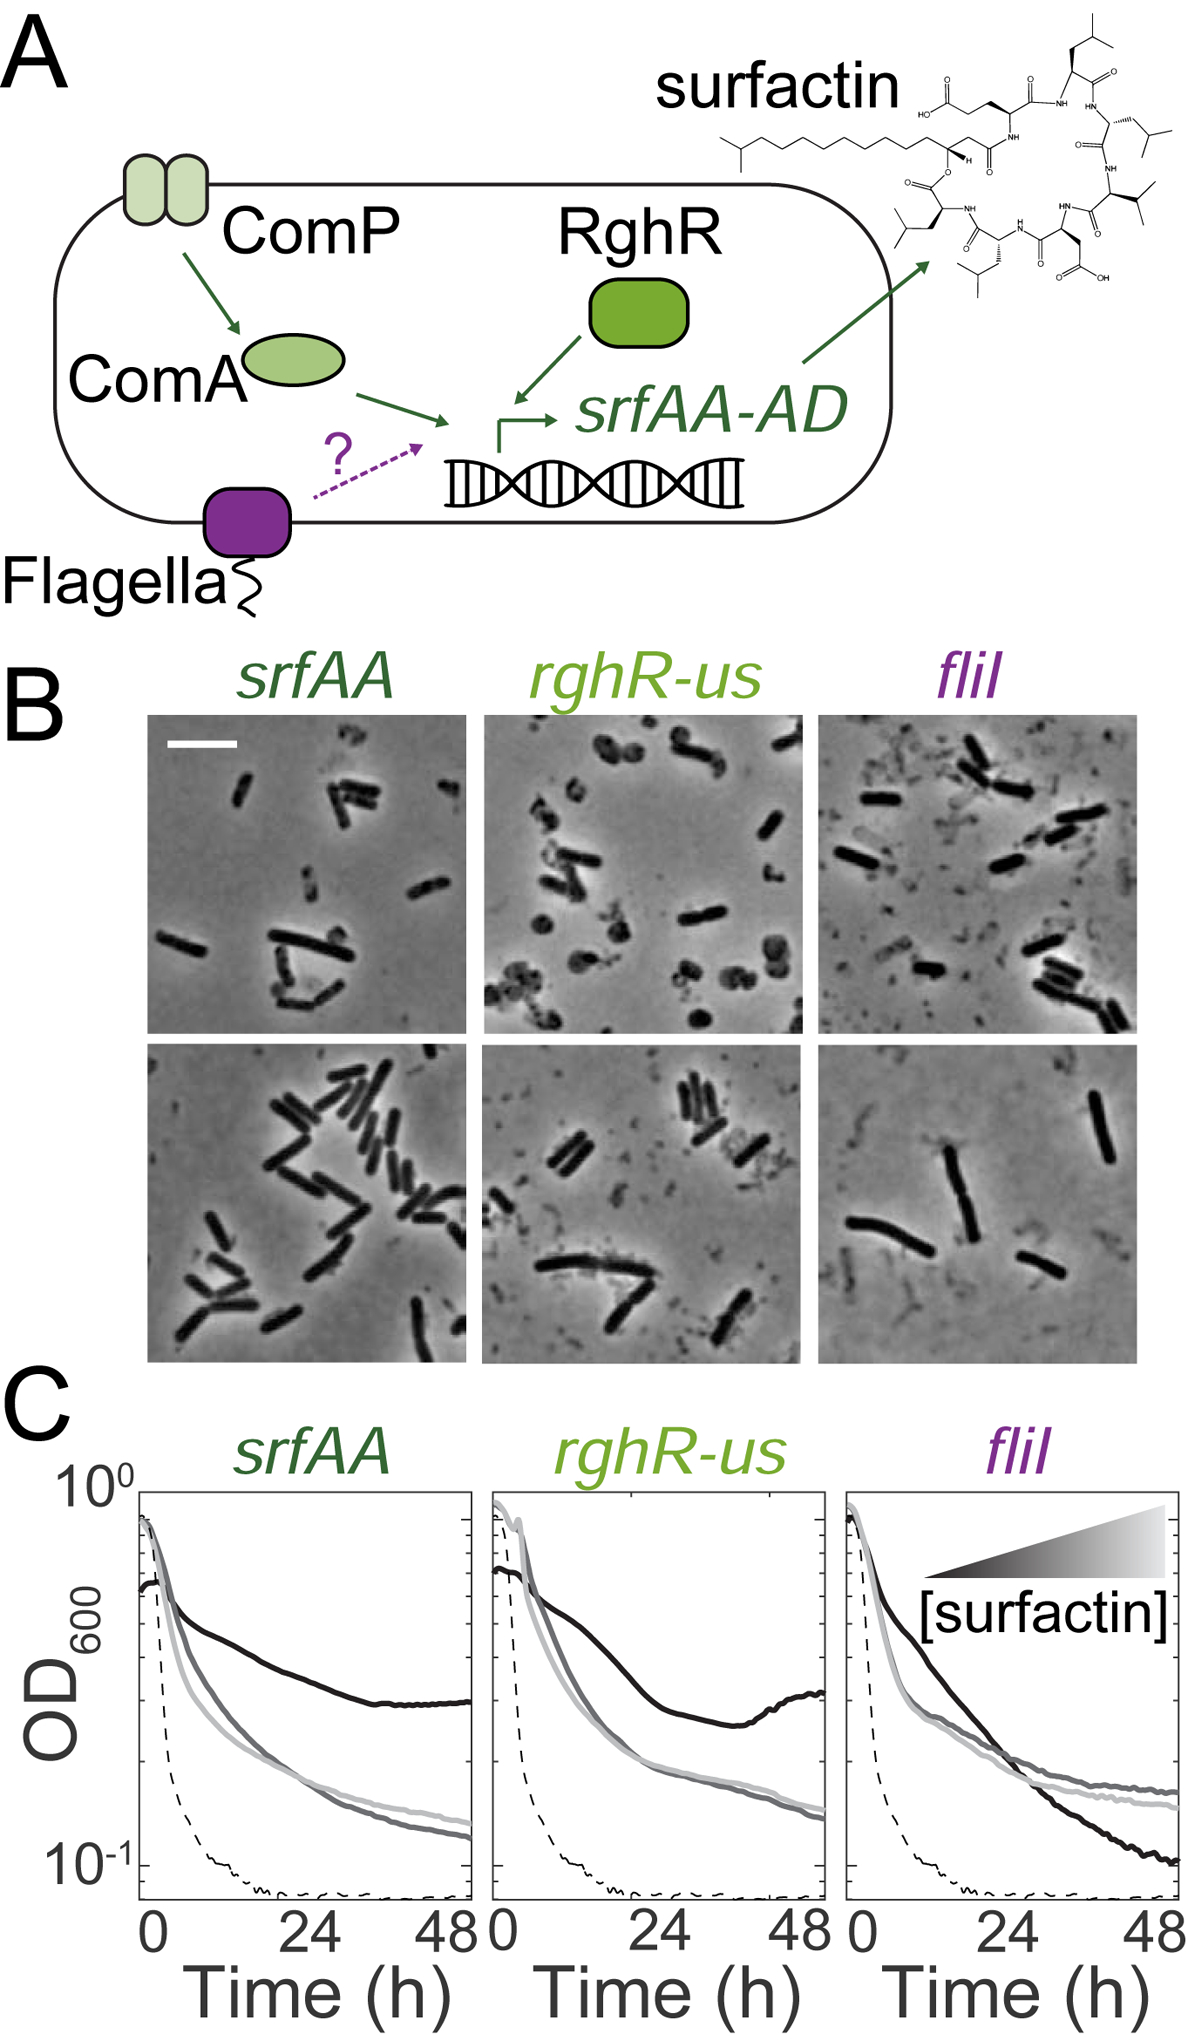
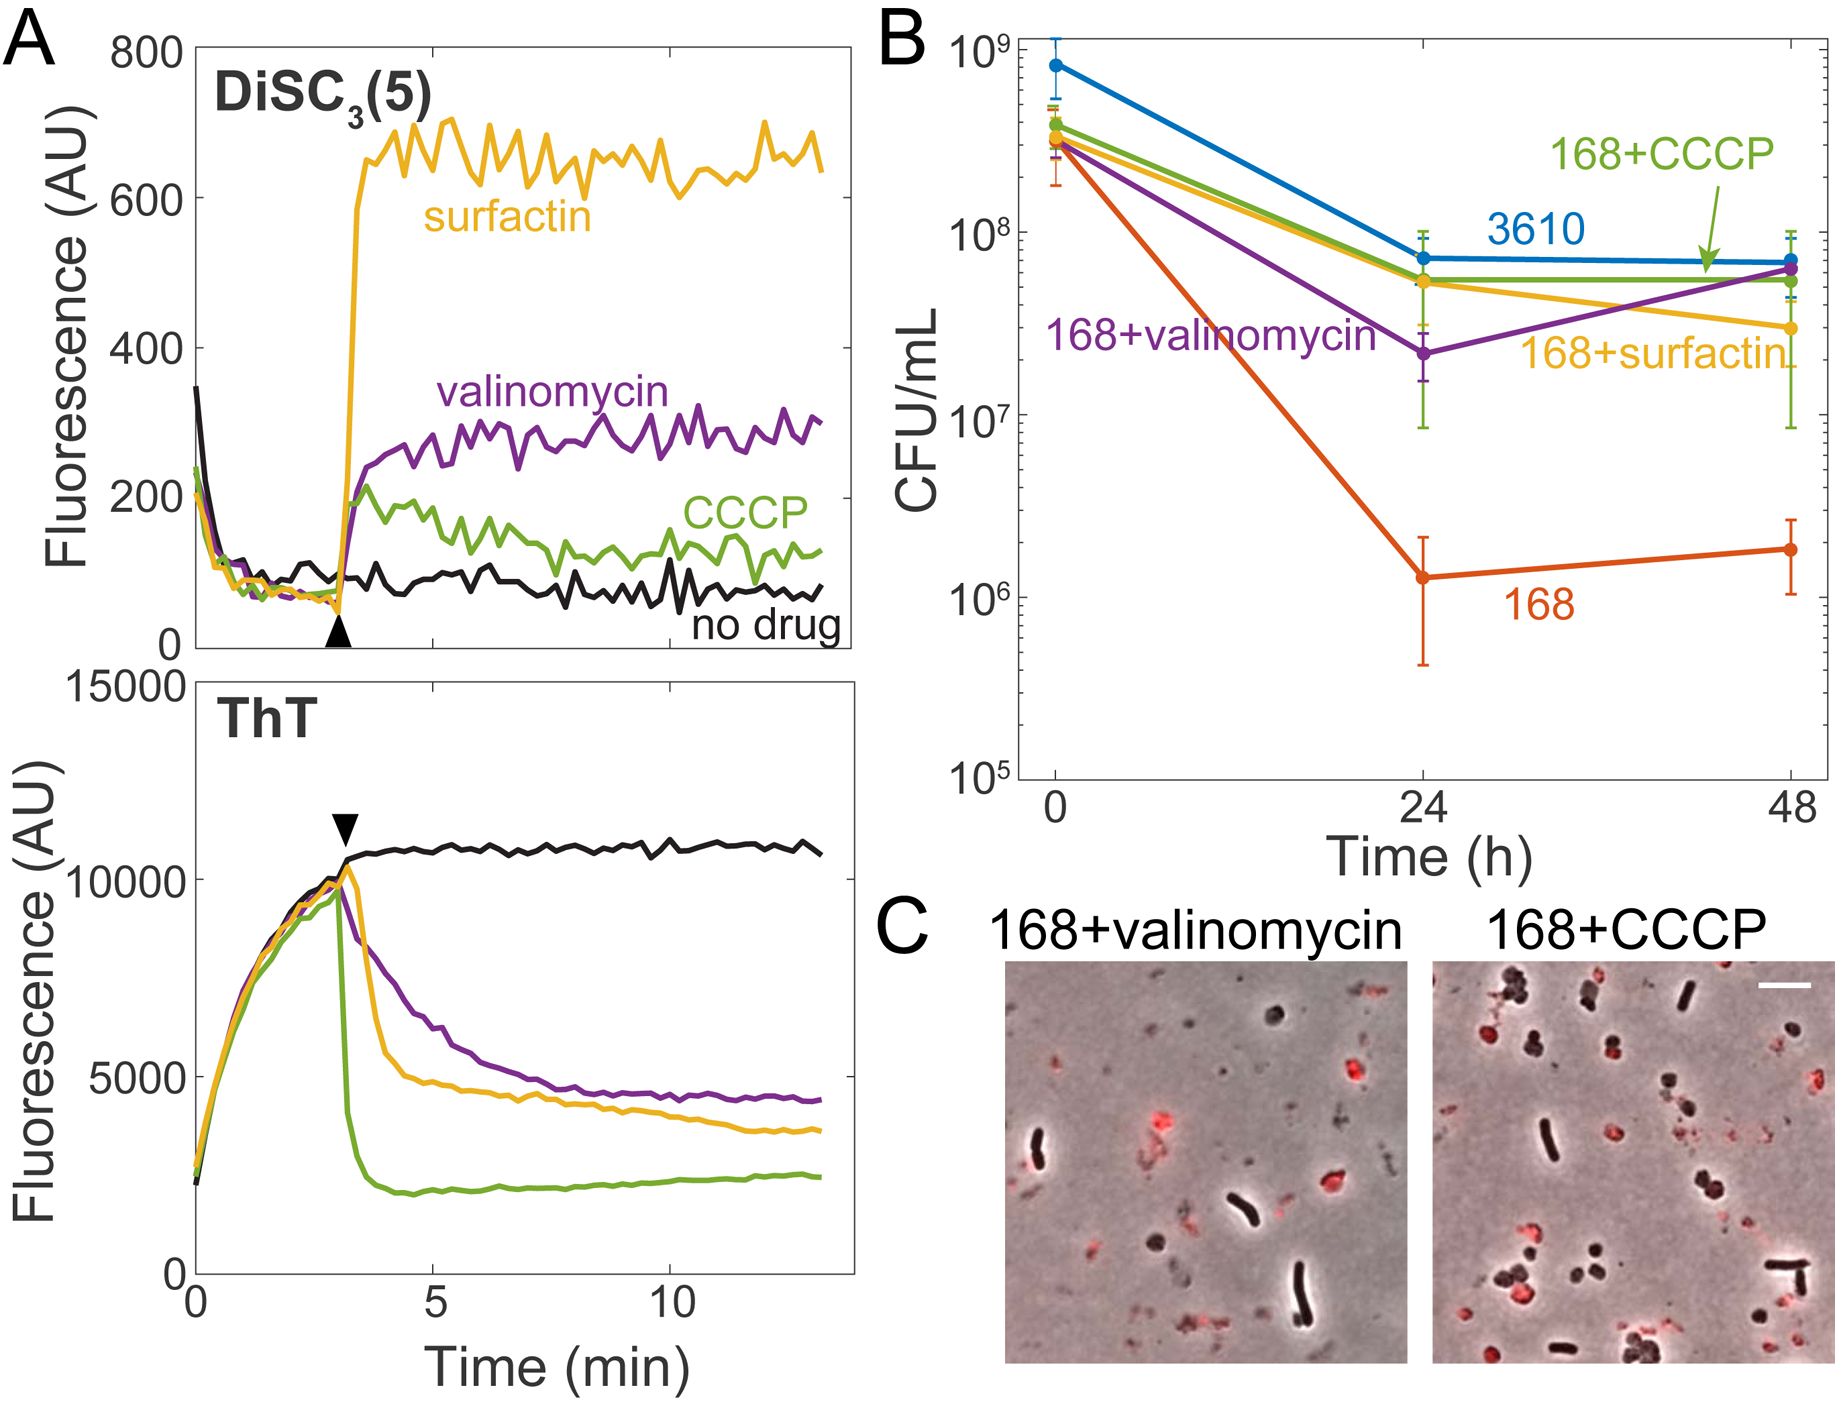
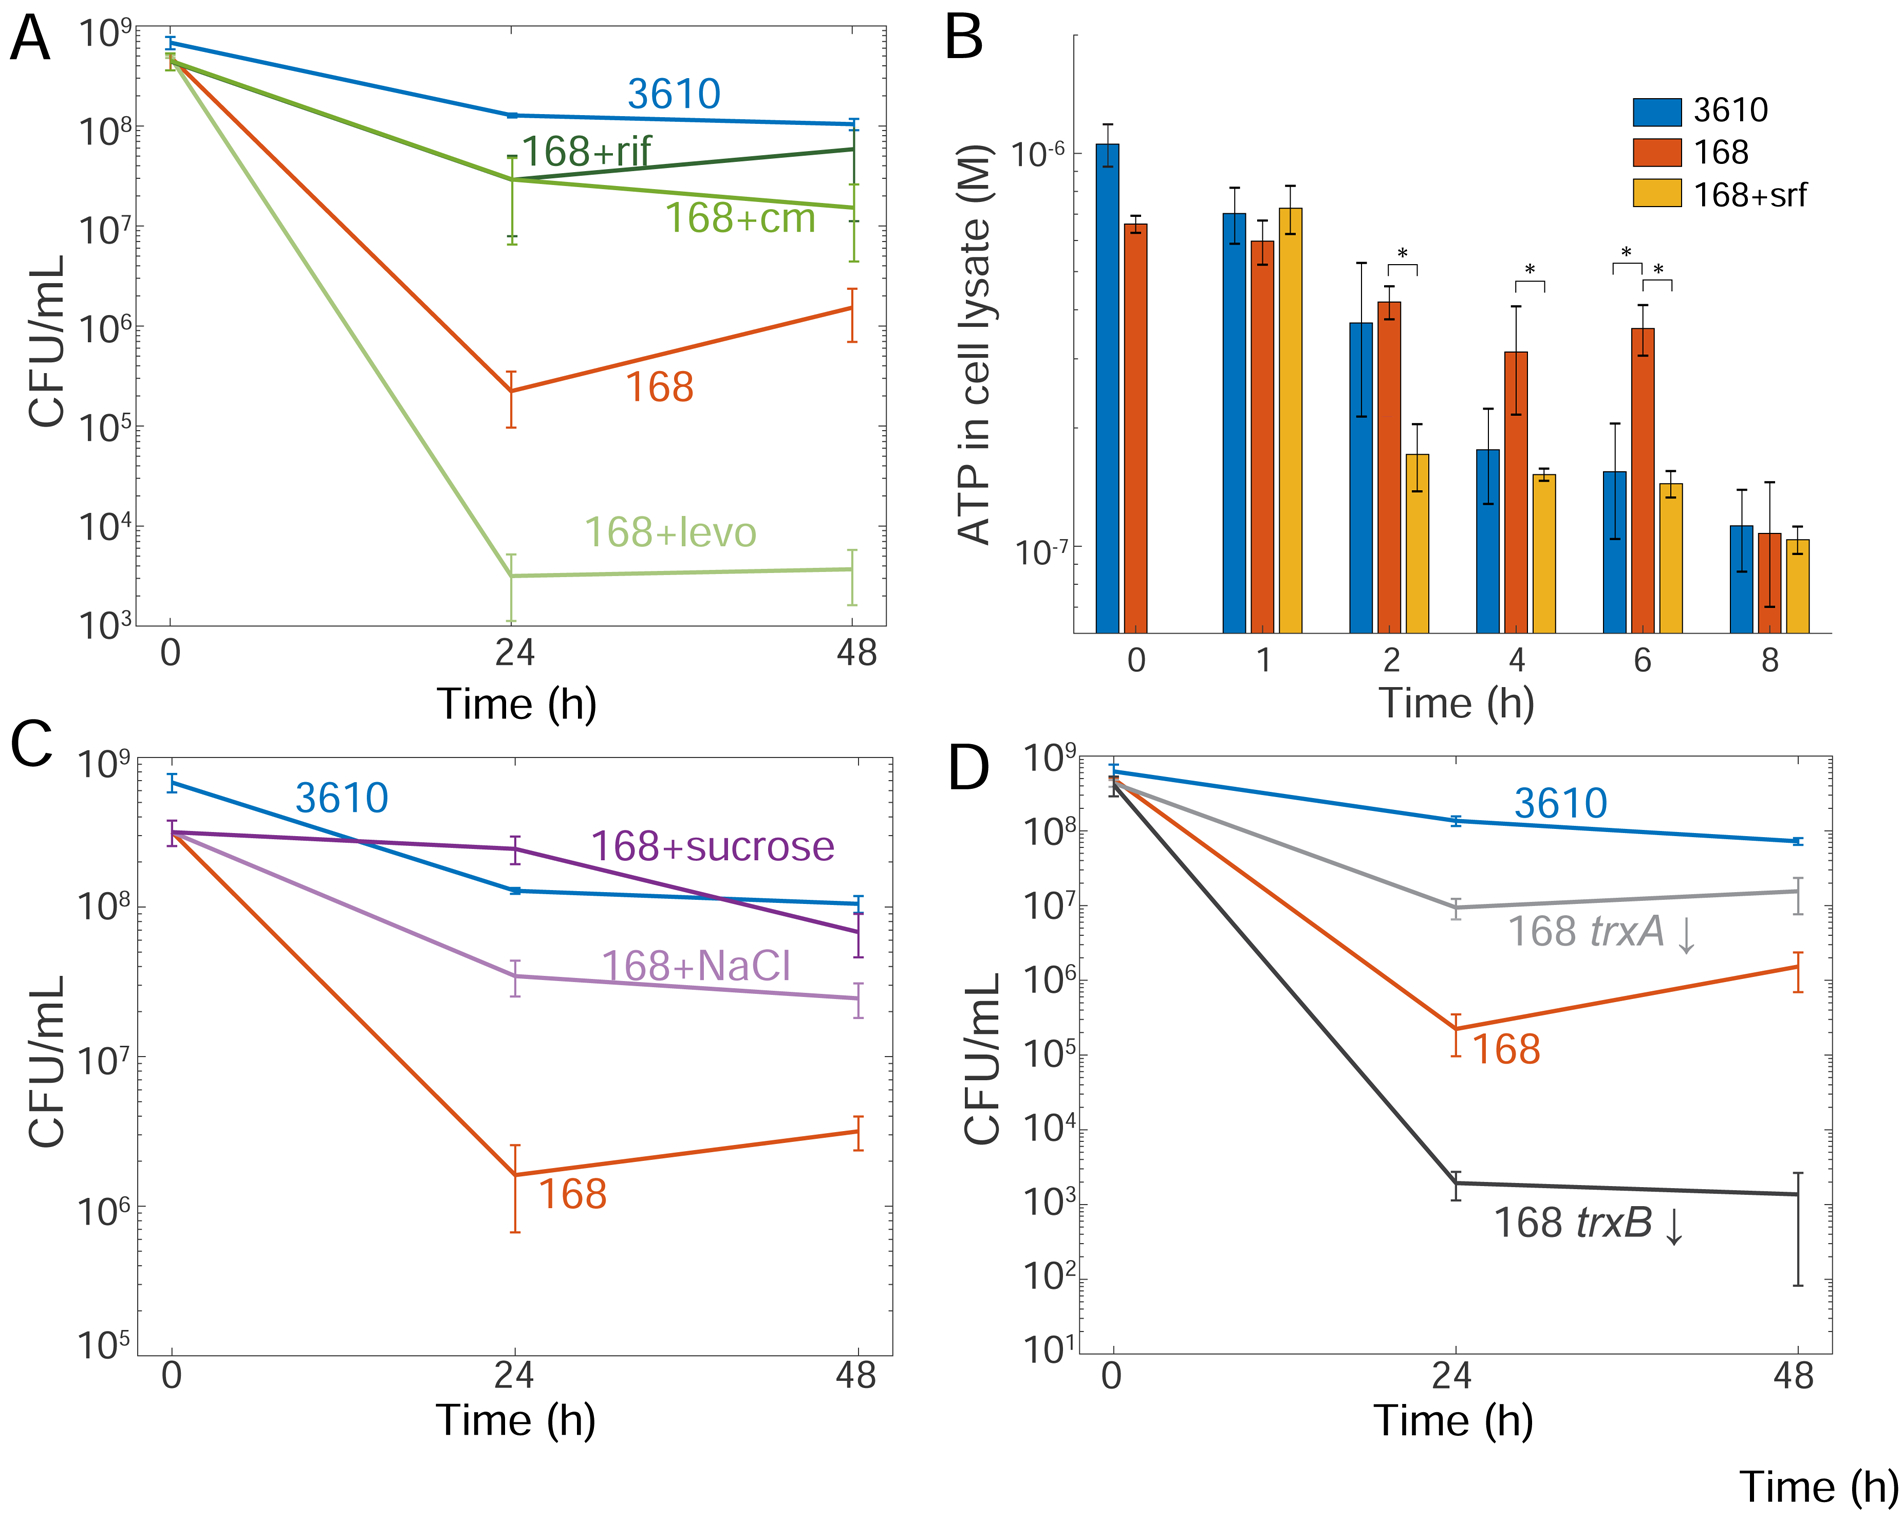
The presence or absence of oxygen in the environment is a strong effector of cellular metabolism and physiology. Like many eukaryotes and some bacteria, Bacillus subtilis primarily utilizes oxygen during respiration to generate ATP. Despite the importance of oxygen for B. subtilis survival, we know little about how populations adapt to shifts in oxygen availability. Here, we find that when oxygen was depleted from stationary phase B. subtilis cultures, ∼90% of cells died while the remaining cells maintained colony-forming ability. We discover that production of the antimicrobial surfactin confers two oxygen-related fitness benefits: it increases aerobic growth yield by increasing oxygen diffusion, and it maintains viability during oxygen depletion by depolarizing the membrane. Strains unable to produce surfactin exhibited an ∼50-fold reduction in viability after oxygen depletion. Surfactin treatment of these cells led to membrane depolarization and reduced ATP production. Chemical and genetic perturbations that alter oxygen consumption or redox state support a model in which surfactin-mediated membrane depolarization maintains viability through slower oxygen consumption and/or a shift to a more reduced metabolic profile. These findings highlight the importance of membrane potential in regulating cell physiology and growth, and demonstrate that antimicrobials that depolarize cell membranes can benefit cells when the terminal electron acceptor in respiration is limiting. This foundational knowledge has deep implications for environmental microbiology, clinical anti-bacterial therapy, and industrial biotechnology.

Keywords: aerobic respiration; biosurfactant; cell lysis; hypoxia; membrane depolarization; membrane potential; oxygen depletion; oxygen diffusion; surfactin.


Conflict of interest statement

Declaration of Interests The authors declare no competing interests.

Figures

Figure 1:
Figure 1:. B. subtilis strain 3610 lyses due to oxygen depletion.
(A) B. subtilis cultures lyse when not shaking. The biofilm-forming wild-type strain 3610 (WT) was grown in a test tube and then incubated at room temperature without shaking for 10 h. Phase-contrast images were acquired at 0 and 10 h. Scale bar: 5 μm; arrowhead points to cell debris. (B) Oxygen is depleted during exponential growth and remains low throughout subsequent oxygen depletion while cultures are sealed. Cells were cultured with oxygen-sensitive nanoparticles (STAR Methods). OD600 (top) and the relative oxygen levels (bottom, oxygen level at t0growth set to 1) of the cultures were measured. Lines represent the mean and shading represents one standard deviation (SD), n=3. (C) LytC is necessary for lysis. Left: Despite differences in OD, the ΔlytC 3610 mutant has similar viability to wild type (p=0.07 at 24 h and 0.67 at 48 h, Student’s t-test). Cultures were grown to OD600~1 and then oxygen was depleted at t=0 h and OD600 was monitored. Lines represent the mean and shading represents 1 SD, n=3. Right: ΔlytC cells have phase gray “ghosts” at 24 h post-oxygen depletion. Scale bar: 5 μm; arrowhead points to phase-gray, lysed cell. (D) Culture lysis is strongly correlated with initial cell density when initial OD600>0.45. Representative lysis curves of 6 cultures that varied in initial OD600 (see Figure S1 for independent replicates). Inset: maximum lysis rate (absolute value of the minimum slope of ln(OD600)) vs. initial OD600. A linear regression analysis was performed on data with initial OD600>0.45. See also Figure S1, Figure S2, Video S1 and Video S2.
Figure 2:
Figure 2:. Surfactin production is necessary to maintain viability.
(A) B. subtilis lab strain 168 lyses less upon oxygen depletion than the biofilm-forming strain 3610. B. subtilis strains 3610 and 168 were grown aerobically and then depleted for oxygen at 0 h. Lines represent the mean and shading represents 1 SD, n=7. Inset: maximum lysis rate of strain 3610 was significantly higher than that of strain 168 (*: p=1.7×10⁻⁸, Student’s t-test). Circles show individual experiment values, and error bars represent 1 SD. (B) Many strain 168 cells form cell-wall-less protoplasts upon oxygen depletion. Merge of phase-contrast and fluorescence images of propidium iodide (PI)-stained cells at 0, 24, and 48 h post oxygen depletion. Red indicates membrane-compromised cells. (C) Co-culturing strain 168 with strain 3610 rescues its viability upon oxygen depletion. 168 viability in monoculture was significantly different than 3610 (*: p<0.005; Student’s t-test). Inset: Strain 3610 and strain 168 have distinct colony morphologies when plated on LB. Error bars represent 1 SD, n=3–5. (D) Culturing with exogenous surfactin increases lysis of strain 168 cultures upon oxygen depletion. OD curves during oxygen depletion of strains 3610, 168, and 168 genetically rescued for surfactin production (168sfp+) or with 48 μM exogenous surfactin added before growth (srfinoc) or at depletion (srfdep). Lines represent the mean and shading represents 1 SD, n=3–5. Inset: maximum lysis rates (*: p<0.001; Student’s t-test). (E) Culturing with exogenous surfactin eliminates protoplasts from 168. Top: surfactin molecular structure. Bottom: phase-contrast and PI fluorescence imaging at 24 h post-oxygen depletion of strain 168sfp+ cells or strain 168 cells with 48 μM exogenous surfactin. (F) Surfactin restores the viability of strain 168 cultures to near strain 3610 levels upon oxygen depletion. Surfactin-treated strain 168 (srfinoc, srfdep, and 168sfp+) cultures were each significantly different from wild-type 168 (p<0.001 at 24 h, p<0.01 at 48 h, Student’s t-test). By contrast, the viability of surfactin-treated 168 cultures was not significantly different from that of strain 3610 at 24 h (p>0.2, Student’s t-test). Error bars represent 1 SD, n=3–5. (G) Surfactin restores the viability of strain 168 cultures when added at 4 h post depletion but not at 8 h. Surfactin was added anaerobically at 0, 4, and 8 h post-oxygen depletion and viability was assayed at 24 h. *: significant (p<0.01, Student’s t-test). Strain 168 was not significantly different from strain 168 + surfactin at 8 h (p=0.16, Student’s t-test). Error bars represent 1 SD, n=4. See also Figure S3 and Videos S3 and S4.
Figure 3:
Figure 3:. Surfactin restores the growth yield of strain 168 due to increased oxygen diffusion.
(A) Strain 3610 aerobic cultures achieve a significantly higher growth yield than strain 168. *: time period over which strain 168 growth differed significantly from that of strain 3610 (p<0.05, Student’s t-test). Lines represent the mean and shading represents 1 SD, n=3. (B) Surfactin addition rescues growth yield. Growth curves of strain 168 with surfactin restored genetically (168sfp+) or 48 μM added exogenously at inoculation (168+srf0h) or at t=3 h (168+srf3h). Lines represent the mean and shading represents 1 SD, n=3. The mean growth curve from strain 3610 (A) is shown as a dotted blue line. Inset: rescaled to highlight growth divergence. (C) Tween 80 addition rescues growth yield in a concentration-dependent manner. Lines represent the mean and shading represents 1 SD, n=3. The mean growth curve from strain 3610 (A) is shown as a dotted blue line. Inset: rescaled to the period of growth divergence. (D) Surfactin addition increases oxygen levels during late exponential phase. Relative oxygen levels (bottom) during growth (top) of strain 168 with added surfactin (48 μM) or Tween 80 (0.76 mM). *: time period over which oxygen levels of 168+surfactin (yellow) or 168+Tween 80 (black) were significantly different from untreated 168 cultures (p<0.05, Student’s t-test). See also Figure S4.
Figure 4:
Figure 4:. Transposon mutagenesis identifies genes that impact lysis during oxygen depletion in strain 3610.
(A) Schematic of regulation of the surfactin synthetase gene operon (srfAA-AD). Known regulators of SrfAA are shown in green. Our data suggests flagellar proteins (purple) might also regulate surfactin. (B) Surfactin-treated cultures of the transposon-disrupted mutants have fewer protoplasts and cell debris. Phase-contrast images of mutants depleted of oxygen for 24 h with and without 48 μM exogenous surfactin. Top: arrowheads show protoplasts, phase-gray dead cells, and cell debris, all of which were not observed in the surfactin-treated cultures. (C) Transposon hits exhibit faster lysis when treated with exogenous surfactin. Black curves are without surfactin, medium and light gray curves are with 24 μM and 48 μM surfactin, respectively. The dashed line is the parent (3610). See also Figure S5 and Table S1.
Figure 5:
Figure 5:. Surfactin maintains viability upon oxygen depletion by depolarizing the membrane.
(A) Surfactin depolarizes the membrane in B. subtilis. Membrane potential assays of strain 168 cells using the dyes DiSC3(5) (top) and ThT (bottom). The time of addition of surfactin (48 μM), valinomycin (50 μM), and CCCP (5 μM) is marked by the black arrowhead. One representative experimental replicate is shown (other replicates in Figure S6A). (B) Treatment with the membrane depolarizing agents valinomycin (5 μM) and CCCP (5 μM) restores plating efficiency of B. subtilis strain 168 after oxygen depletion, similar to surfactin (48 μM). Error bars represent 1 SD, n=3–5. 168 plating efficiency data were significantly different than those of strain 168+surfactin, strain 168+valinomycin, strain 168+CCCP, and strain 3610 (p<0.005, Student’s t-test). (C) Valinomycin and CCCP-treated strain 168 cultures have protoplasts, demonstrating that protoplast removal is unnecessary for viability enhancement. Overlays of phase-contrast and PI (red) images at 24 h post-oxygen depletion. Scale bar: 5 μm. See also Figure S6.
Figure 6:
Figure 6:. Surfactin maintains viability upon oxygen depletion by reducing ATP production and oxygen consumption.
(A) Antibiotics that reduce oxygen consumption (rifampin (rif) and chloramphenicol (cm)) restore the colony-forming ability of strain 168, while an antibiotic that does not reduce oxygen consumption (levofloxacin (levo)) does not. Viability for strain 168+rif and strain 168+cm was significantly higher than untreated strain 168 at 24 h (p<0.05, Student’s t-test). Error bars represent 1 SD, n=3–4. (B) Surfactin reduces ATP levels in strain 168 cells following oxygen depletion. ATP levels of an equal volume of cell lysate were measured at each time point following oxygen depletion. Error bars represent 1 SD, n=3. *: p< 0.05, Student’s t-test. (C) Adding 300 mM solutes to reduce oxygen solubility restores viability to strain 168. Viability of strain 168+sucrose and strain 168+NaCl were significantly different from untreated strain 168 at 24 and 48 hours (p < 0.01, Student’s t-test). Error bars represent 1 SD, n=3. (D) Altering the redox state of the cell by inhibiting thioredoxin (trxA) or thioredoxin reductase (trxB) gene expression using CRISPRi alters the viability of strain 168. 1% xylose was added at the onset of oxygen depletion to block transcription of trxA (trxA ↓) or trxB (trxB ↓). Viability of these mutants was significantly different than wild-type 168 (p< 0.05, Student’s t-test). Error bars represent 1 SD, n=3–4. See also Figure S6.

Comment in

References

    1. Boutilier RG (2001). Mechanisms of cell survival in hypoxia and hypothermia. J Exp Biol 204, 3171–3181. - PubMed
    1. Hochachka PW (1986). Defense strategies against hypoxia and hypothermia. Science 231, 234–241. - PubMed
    1. Sendoel A, and Hengartner MO (2014). Apoptotic cell death under hypoxia. Physiology (Bethesda) 29, 168–176. - PubMed
    1. Prescott LM, Harley JP, and Klein DA (2005). Microbiology, 6th Edition, (Dubuque, IA: McGraw-Hill Higher Education; ).
    1. Wayne LG, and Hayes LG (1996). An in vitro model for sequential study of shiftdown of Mycobacterium tuberculosis through two stages of nonreplicating persistence. Infect Immun 64, 2062–2069. - PMC - PubMed

Publication types

MeSH terms

LinkOut - more resources