. 2020 Mar 9;52(5):617-630.e6.
doi: 10.1016/j.devcel.2020.01.009. Epub 2020 Feb 13.

Epithelial Vegfa Specifies a Distinct Endothelial Population in the Mouse Lung

Affiliations

Epithelial Vegfa Specifies a Distinct Endothelial Population in the Mouse Lung

Lisandra Vila Ellis et al. Dev Cell. .

Abstract

The lung microvasculature is essential for gas exchange and commonly considered homogeneous. We show that VEGFA from the epithelium is required for a distinct endothelial cell (EC) population in the mouse lung. Vegfa is predominantly expressed by alveolar type 1 (AT1) cells and locally required to specify a subset of ECs. Single-cell RNA sequencing (scRNA-seq) reveals that ∼15% of lung ECs are transcriptionally distinct-marked by Carbonic anhydrase 4 (Car4)-and arise from bulk ECs, as suggested by trajectory analysis. Car4 ECs have extensive cellular projections and are separated from AT1 cells by a limited basement membrane without intervening pericytes. Car4 ECs are specifically lost upon epithelial Vegfa deletion; without Car4 ECs, the alveolar space is aberrantly enlarged despite the normal appearance of myofibroblasts. Lung Car4 ECs and retina tip ECs have common and distinct features. These findings support a signaling role of AT1 cells and shed light on alveologenesis.

Keywords: CAR4; VEGF; alveologenesis; angiogenesis; endothelial cell; lung alveolar type 1 cell; lung development; lung vasculature; single-cell RNA-seq; vascular biology.


Conflict of interest statement

Declaration of Interests The authors declare no competing interests.

Figures
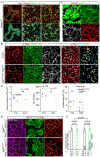
Figure 1:
Figure 1:. AT1 derived VEGFA is required for alveolar angiogenesis locally. See also Figure S1, S2.
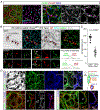
(A) Immunostained lungs with a nuclear LacZ knock-in allele of Vegfa, representative of at least 2 mice, showing its low mesenchymal expression at E16 (open arrow), and presence in AT1 cells (filled arrowhead) but absence in AT2 cells (open arrowhead). AT1 and AT2 cells are identified by NKX2.1 expression and distinct cell morphology, as outlined by E-Cadherin (ECAD). Postnatal lungs are shown as an en face view of the alveolar surface, which better captures AT1 cells. (B) En face view of immunostained lungs, representative of at least 3 littermate pairs, showing impaired alveolar angiogenesis in the AT1-specific Vegfa mutant. In the control, vessels (apical membrane marker ICAM2; nuclear marker ERG) cover alveolar islands (dash; AQP5) together with SMA-expressing myofibroblasts, whereas the remaining vessels in the mutant do not, despite normal coverage by myofibroblasts. Filled arrowhead, KI67/ERG double positive ECs. Non-ECs are also proliferative (open arrowhead). (C) Quantification showing a lower vessel volume and EC number, but comparable proliferation (KI67+) in the mutant (Student’s t-test; n.s.: not significant). Each symbol represents one mouse and is the average of three regions with hundreds of EC cells counted for each region. (D) En face view of an immunostained alveolar island (dash) showing the epithelial surface (AQP5 rendering) with grooves containing both myofibroblasts (SMA) and vessels (ICAM2) (filled arrowhead) and those with only vessels (open arrowhead). (E) En face view of immunostained lungs, representative of at least 3 littermate pairs, showing that in the mosaic Vegfa mutant, juxtaposed recombined alveolar islands (GFP+; green dash) are associated with sparser vasculature than unrecombined ones (GFP; white dash), whereas both types of alveolar islands have comparable vasculature in the control, as expected. Tam, 200 ug tamoxifen. (F) Quantification of vessel coverage in 3 littermate pairs. The number (n) of unrecombined (GFP; black number) and recombined (GFP+; green number) alveolar islands examined in each mouse is tabulated with the percentage of aberrant islands (vessel) in parenthesis (grey number), whose average is shown as a stack bar graph. Although recombination of the Rosa locus does not always match that of the Vegfa locus, GFP+ islands are more likely to be aberrant (vessel) in the mutant (Student’s t-test), which has more aberrant islands than the control (pooling unrecombined and recombined islands; Student’s t-test). Control and mutant refer to Vegfa heterozygotes and homozygotes in (E). Scale: 10 um.
Figure 2:
Figure 2:. Epithelial VEGFA is required for alveolar angiogenesis. See also Figure S2; Table S1.
(A) En face view of immunostained lungs, representative of at least 3 littermate pairs, showing impaired alveolar angiogenesis in the pan-epithelial Vegfa mutant over the alveolar islands (dash; AQP5). Filled arrowhead, KI67/ERG double positive ECs. Non-ECs are also proliferative (open arrowhead). Scale: 10 um. (B) Quantification showing a lower vessel volume and EC number, but comparable proliferation (KI67+) in the mutant (Student’s t-test; n.s.: not significant). Each symbol represents one mouse and is the average of three regions with hundreds of EC cells counted for each region. (C) Volcano plot of bulk RNA-seq results from sorted lung ECs from 3 littermate pairs. See Table S1 for the complete dataset.
Figure 3:
Figure 3:. scRNA-seq identifies a distinct lung EC population. See also Figure S3, S4, S5, S6; Table S2.
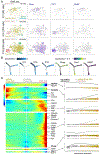
(A) Left: tSNE plot of scRNA-seq of sorted P14 lung ECs with each cell population color-coded and the corresponding cell number shown in parenthesis. Right: population marker expression. Vwf ECs were further divided into arterial cells, marked by Gja5, and venous cells, marked by Nr2f2. Esm1 marks a group of Plvap ECs adjacent to the arterial cells, and Mki67, a marker of proliferation, is expressed by Plvap ECs but not Car4 ECs. (B) Dot plot showing population markers. Epithelial and mesenchymal populations are minor contaminants from sorting. A population of doublets or transitional ECs express both Plvap and Car4. (C) Heatmap showing top 25 genes comparing Car4 and Plvap ECs. See Table S2 for markers for Vwf and lymphatic ECs.
Figure 4:
Figure 4:. Trajectory analysis supports that Car4 ECs originate from Plvap ECs at E19.
(A) tSNE plots of scRNA-seq from purified lung ECs over time, with the populations identified as in Fig. 3 and their percentages shown in parenthesis. Car4 ECs were first detected at E19. Plvap ECs, but not Car4 ECs, are proliferative (Mki67). (B) Monocle trajectory analysis of Plvap and Car4 ECs. All E17 ECs occupy the initial branch and express Plvap, thus called immature Plvap ECs. At E19, ECs begin to split into two distinct branches: one marked by Plvap (mature Plvap ECs), and the other one by Car4 (Car4 ECs); P14 ECs further diverge along these 2 branches. Mki67 is largely limited to the initial branch. (C) Trajectory heat map showing dynamic gene expression patterns. The 3 branches are color-coded and form 2 trajectories, both originating from the center. Genes for each pattern are shown; representative genes are highlighted (bold) and their expression values plotted along both trajectories: dash lines for immature Plvap ECs to Car4 ECs and solid lines for immature Plvap ECs to mature Plvap ECs. See Table S3 for the complete gene list for each pattern.
Figure 5:
Figure 5:. Car4 ECs localize to the alveolar islands and have an expansive morphology. See also Figure S5.
(A) Representative en face stack view and section view of wholemount immunostained lungs from at least 5 mice. CAR4 staining covers, whereas PLVAP staining surrounds, alveolar islands (dash). Perinuclear CAR4 and PLVAP staining allows assignment of ERG nuclei to CAR4 (cyan arrowhead) versus PLVAP (magenta arrowhead) ECs; grey nuclei are ambiguous. (B) Wholemount immunostaining of lungs with sparsely-labeled ECs, representative of at least 5 mice, viewed as an en face stack view (40 um), a slab view (20 um) or a section view (1 um). Accumulation of tdT to ERG nuclei allows cell numeration: cell #1 is a Car4 EC and cells #2–5 are non-Car4 ECs. Asterisk, avascular tissue surrounded by a single net-like Car4 EC. Boxed region is shown for CDH5 single staining as an inset to show CDH5 junction (open arrowhead) overlapping with a single Car4 EC. Cell perimeter is measured by connecting protrusions that are visible in a projection view. Line profile analysis shows aligned versus shifted peaks for Car4 versus non-Car4 ECs, respectively. For shifted peaks, Car4 ECs are closer to the air space than non-Car4 ECs (e.g. cell #3). Tam, 0.25 ug tamoxifen. (C) Quantification of cell perimeter and comparison using Student’s t-test. Each symbol represents one cell. (D) En face stack view and associated section view of the “slope” of alveolar islands (bracket) of wholemount immunostained lungs, representative of at least 5 mice. As in the color-matched diagram, Car4 ECs (green) are closer to the air space (AQP5; grey) than non-Car4 ECs (blue), lined by a thin basement membrane (BM; COL4; red) without intervening pericytes (CSPG4; orange). #, non-CAR4 ECs. Scale: 10 um.
Figure 6:
Figure 6:. Car4 ECs are specifically lost upon pan-epithelial Vegfa deletion. See also Figure S7.
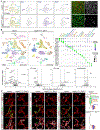
(A) Left: tSNE plots of scRNA-seq of sorted ECs from littermate lungs showing a specific, complete loss of Car4 ECs in the mutant with the population percentages in parenthesis. Plvap ECs and proliferating (Mki67) ECs are unaffected. Cell populations are color-coded as in Fig. 3 and 4. Mes, mesenchyme; Epi, epithelium; Lym, lymphatic EC; Vwf, Vwf EC. Compared to P14 (Fig. 3), P7 lungs have more proliferating (Mki67) ECs; their percentage is calculated with a UMI cutoff of 1. Right: en face view of immunostained lungs, representative of at least 3 littermate pairs, showing rare Car4 staining in the remaining vessels in the mutant (open arrowhead). m, macrophage. (B) tSNE plots of scRNA-seq of 4 sorted cell lineages from littermate lungs: epithelial, endothelial, mesenchymal, and immune. Dot plot showing markers for the color-coded cell types. Car4 ECs are missing in the mutant. Volcano plots comparing all ECs, AT1 cells, AT2 cells, and myofibroblasts between control and mutant show downregulation of markers for Car4 ECs and minor changes in other cell types. SM, smooth muscle; T & NK, T and NK cells; IM, interstitial macrophages. (C) Section immunostaining images of lungs, representative of at least 3 littermate pairs. As diagrammed, Car4 vessels (filled green arrow) abut the epithelium (AQP5), separated with a thin basement membrane (BM; weak COL4 staining; dash open arrowhead) with no intervening pericytes (CSPG4; dash open arrowhead), but their sides away from the air space have a thicker basement membrane (strong COL4 staining; solid open arrowhead) and pericytes (solid open arrowhead). Non-Car4 vessels (filled white arrow; a subset of vessels in the control and all vessels in the mutant) do not abut the epithelium and are surrounded by a thick basement membrane and pericytes. Scale: 10 um.
Figure 7:
Figure 7:. Aberrant alveolar enlargement in the absence of Car4 ECs but independent of myofibroblasts. See also Figure S7.
(A) Left: en face view of immunostained lungs, representative of at least 3 littermate pairs, showing a smoother surface (RAGE) of alveolar islands that are not subdivided by Car4 vessels in the mutant. Right: H&E section images of littermate lungs with the corresponding mean linear intercept (MLI) and D2 measurements. Each symbol represents one mouse and is the average of 3 regions (Student’s t-test). (B) Left: En face view of immunostained lungs, representative of at least 3 littermate pairs, showing fewer pericytes (PDGFRB; open arrowhead) but normal myofibroblasts (SMA/TAGLN/PDGFRA triple positive, although variable in staining intensity; filled arrowhead) in the mutant. Boxed regions are magnified. Right: section immunostaining showing colocalization of Elastin (ELN) with SMA. (C) Schematics with color-coded cell types showing AT1-derived VEGFA signals to Car4 ECs, which, together with myofibroblasts, promote secondary septation and persist in the resulting septae even after disappearance of myofibroblasts in the mature lung. The pan-epithelial Vegfa mutant fails to form Car4 ECs; non-Car4 ECs and myofibroblasts are insufficient for secondary septation, resulting in alveolar enlargement. Note that Car4 vessels may consist of Car4 ECs and non-Car4 ECs, as diagrammed in Fig. 6C. Alv, alveolus. Scale: 10 um except for H&E images (100 um).

Comment in

References

    1. Abman SH (2001). Bronchopulmonary dysplasia: “a vascular hypothesis”. Am J Respir Crit Care Med 164, 1755–1756. - PubMed
    1. Aird WC (2007a). Phenotypic heterogeneity of the endothelium: I. Structure, function, and mechanisms. Circ Res 100, 158–173. - PubMed
    1. Aird WC (2007b). Phenotypic heterogeneity of the endothelium: II. Representative vascular beds. Circ Res 100, 174–190. - PubMed
    1. Alanis DM, Chang DR, Akiyama H, Krasnow MA, and Chen J (2014). Two nested developmental waves demarcate a compartment boundary in the mouse lung. Nature communications 5, 3923. - PMC - PubMed
    1. Barkauskas CE, Cronce MJ, Rackley CR, Bowie EJ, Keene DR, Stripp BR, Randell SH, Noble PW, and Hogan BL (2013). Type 2 alveolar cells are stem cells in adult lung. J Clin Invest 123, 3025–3036. - PMC - PubMed

Publication types

MeSH terms

Substances