. 2020 Feb 20;180(4):796-812.e19.
doi: 10.1016/j.cell.2020.01.030. Epub 2020 Feb 13.

Cellular and Molecular Probing of Intact Human Organs

Affiliations

Cellular and Molecular Probing of Intact Human Organs

Shan Zhao et al. Cell. .

Abstract

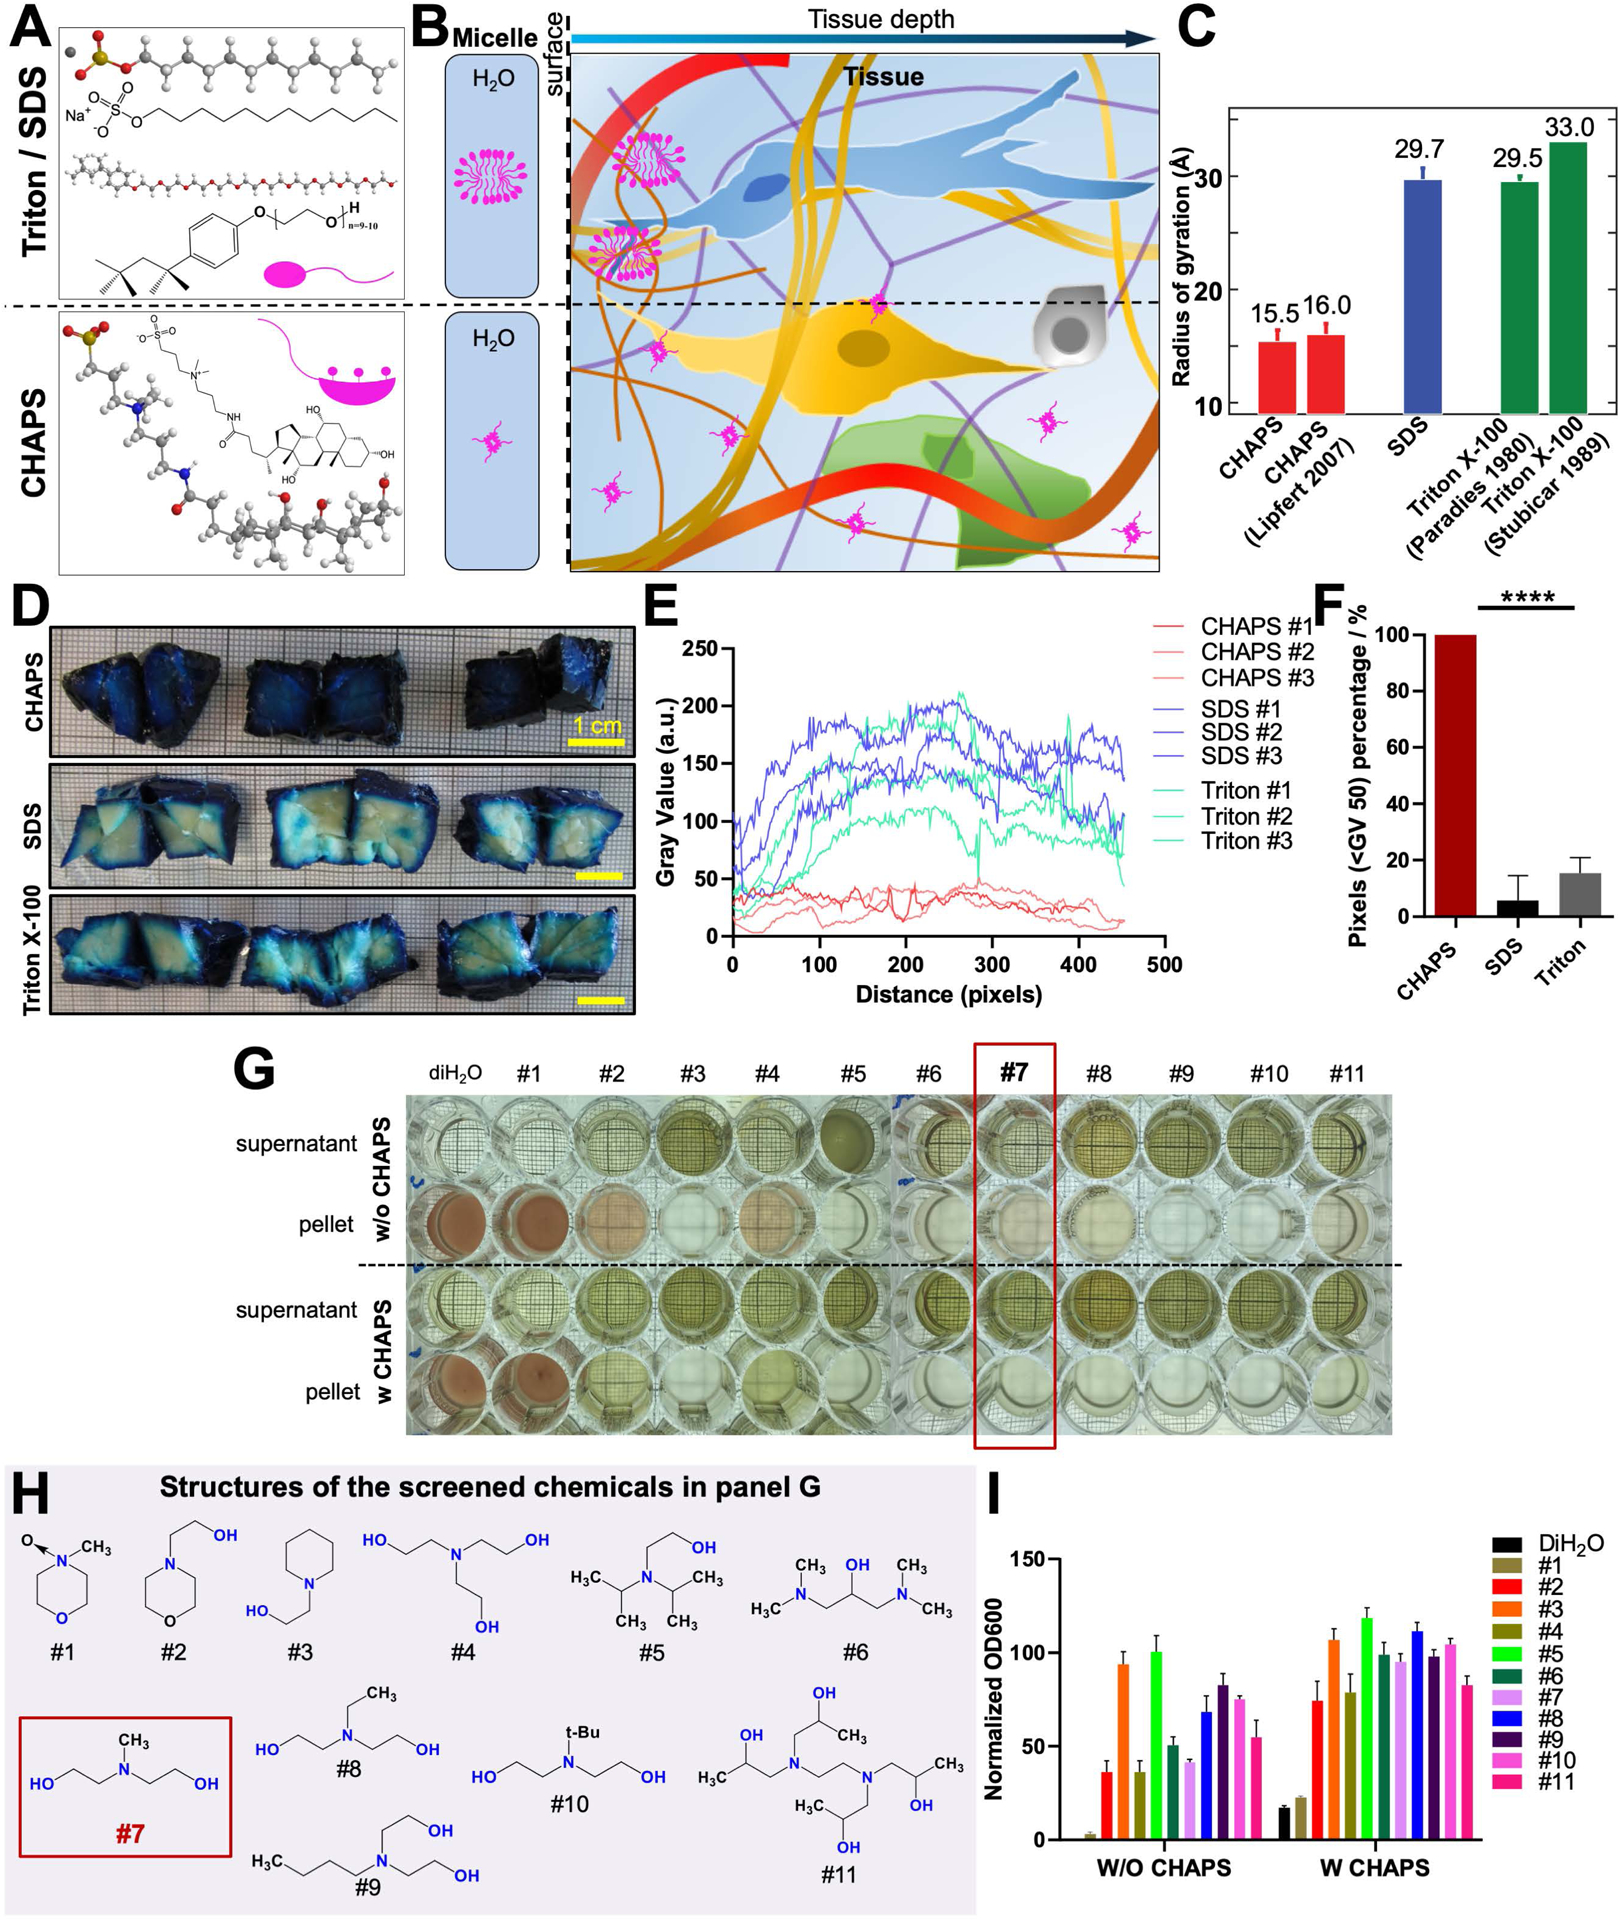
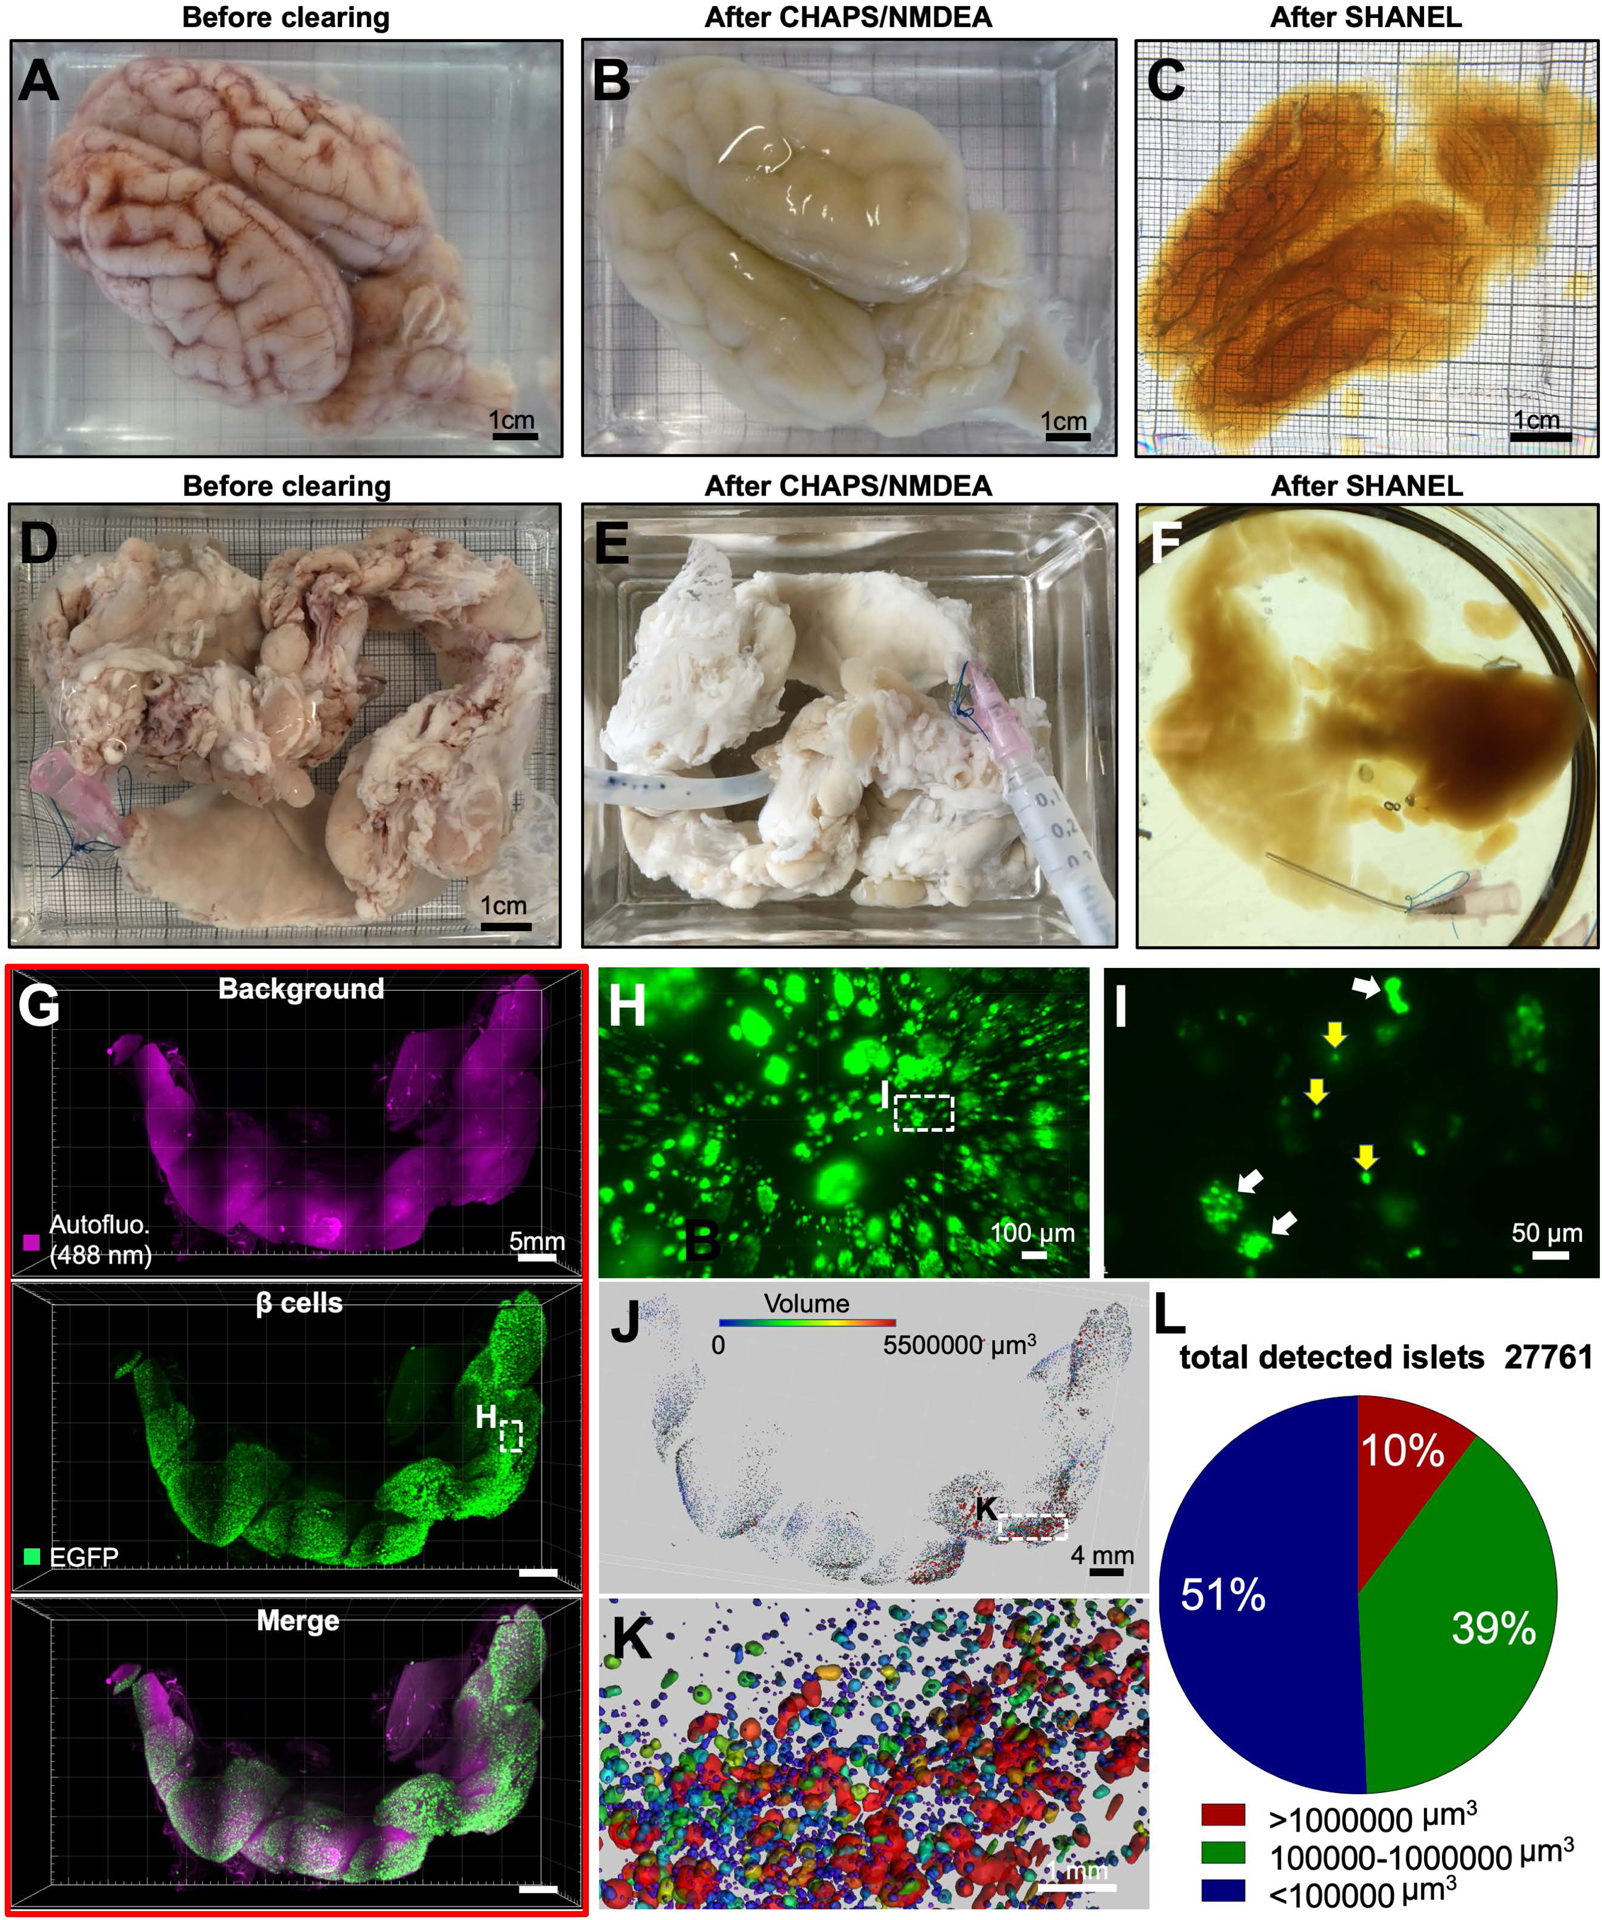
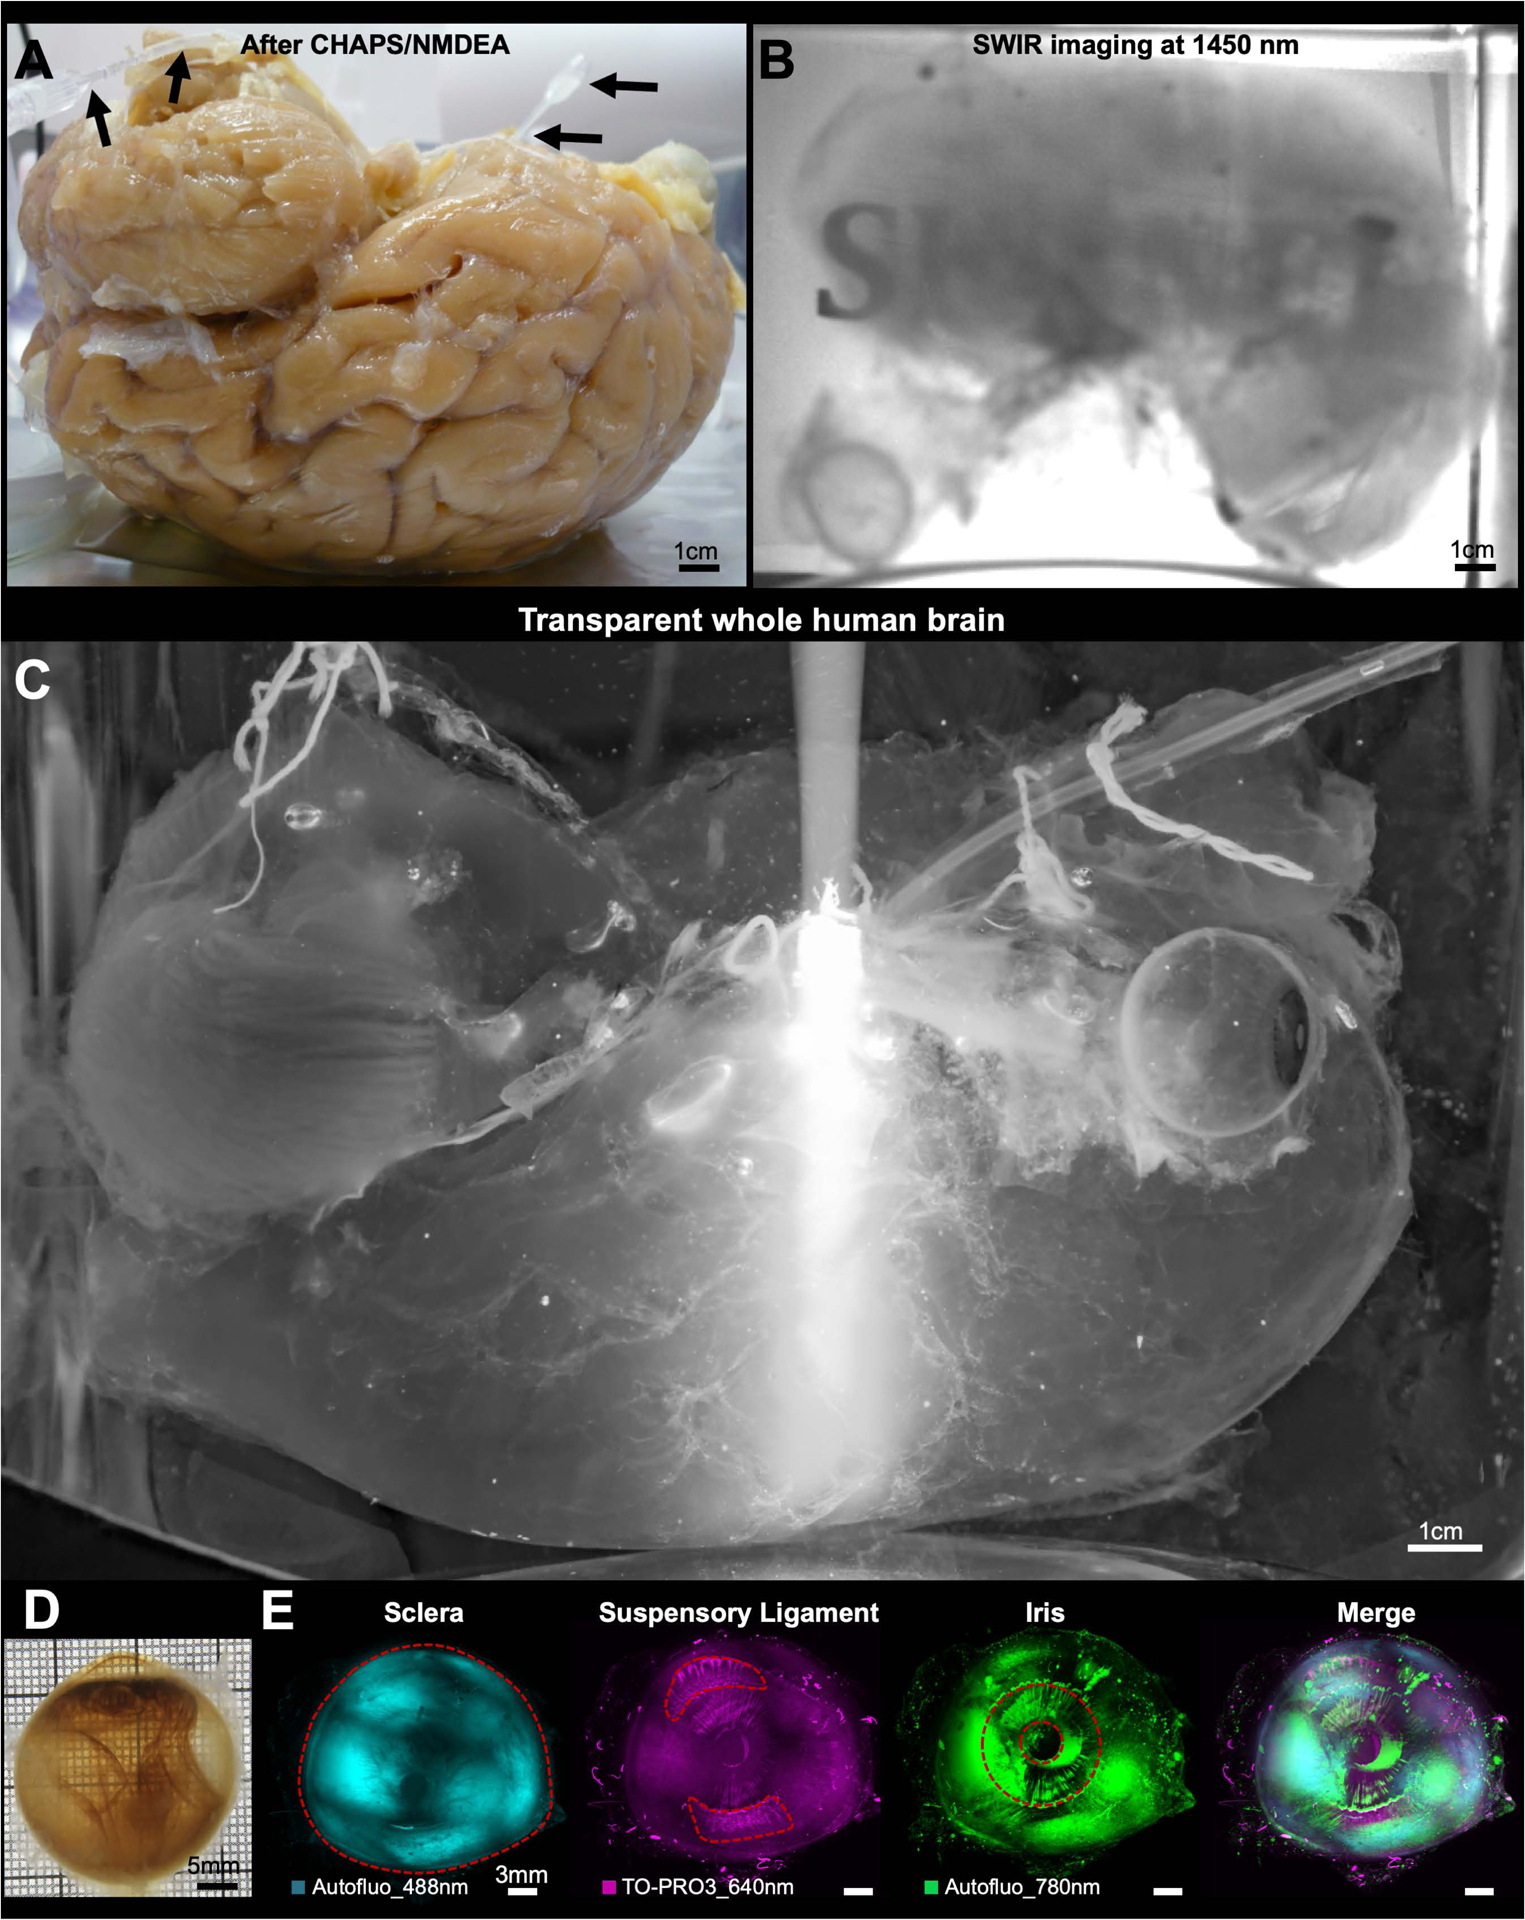
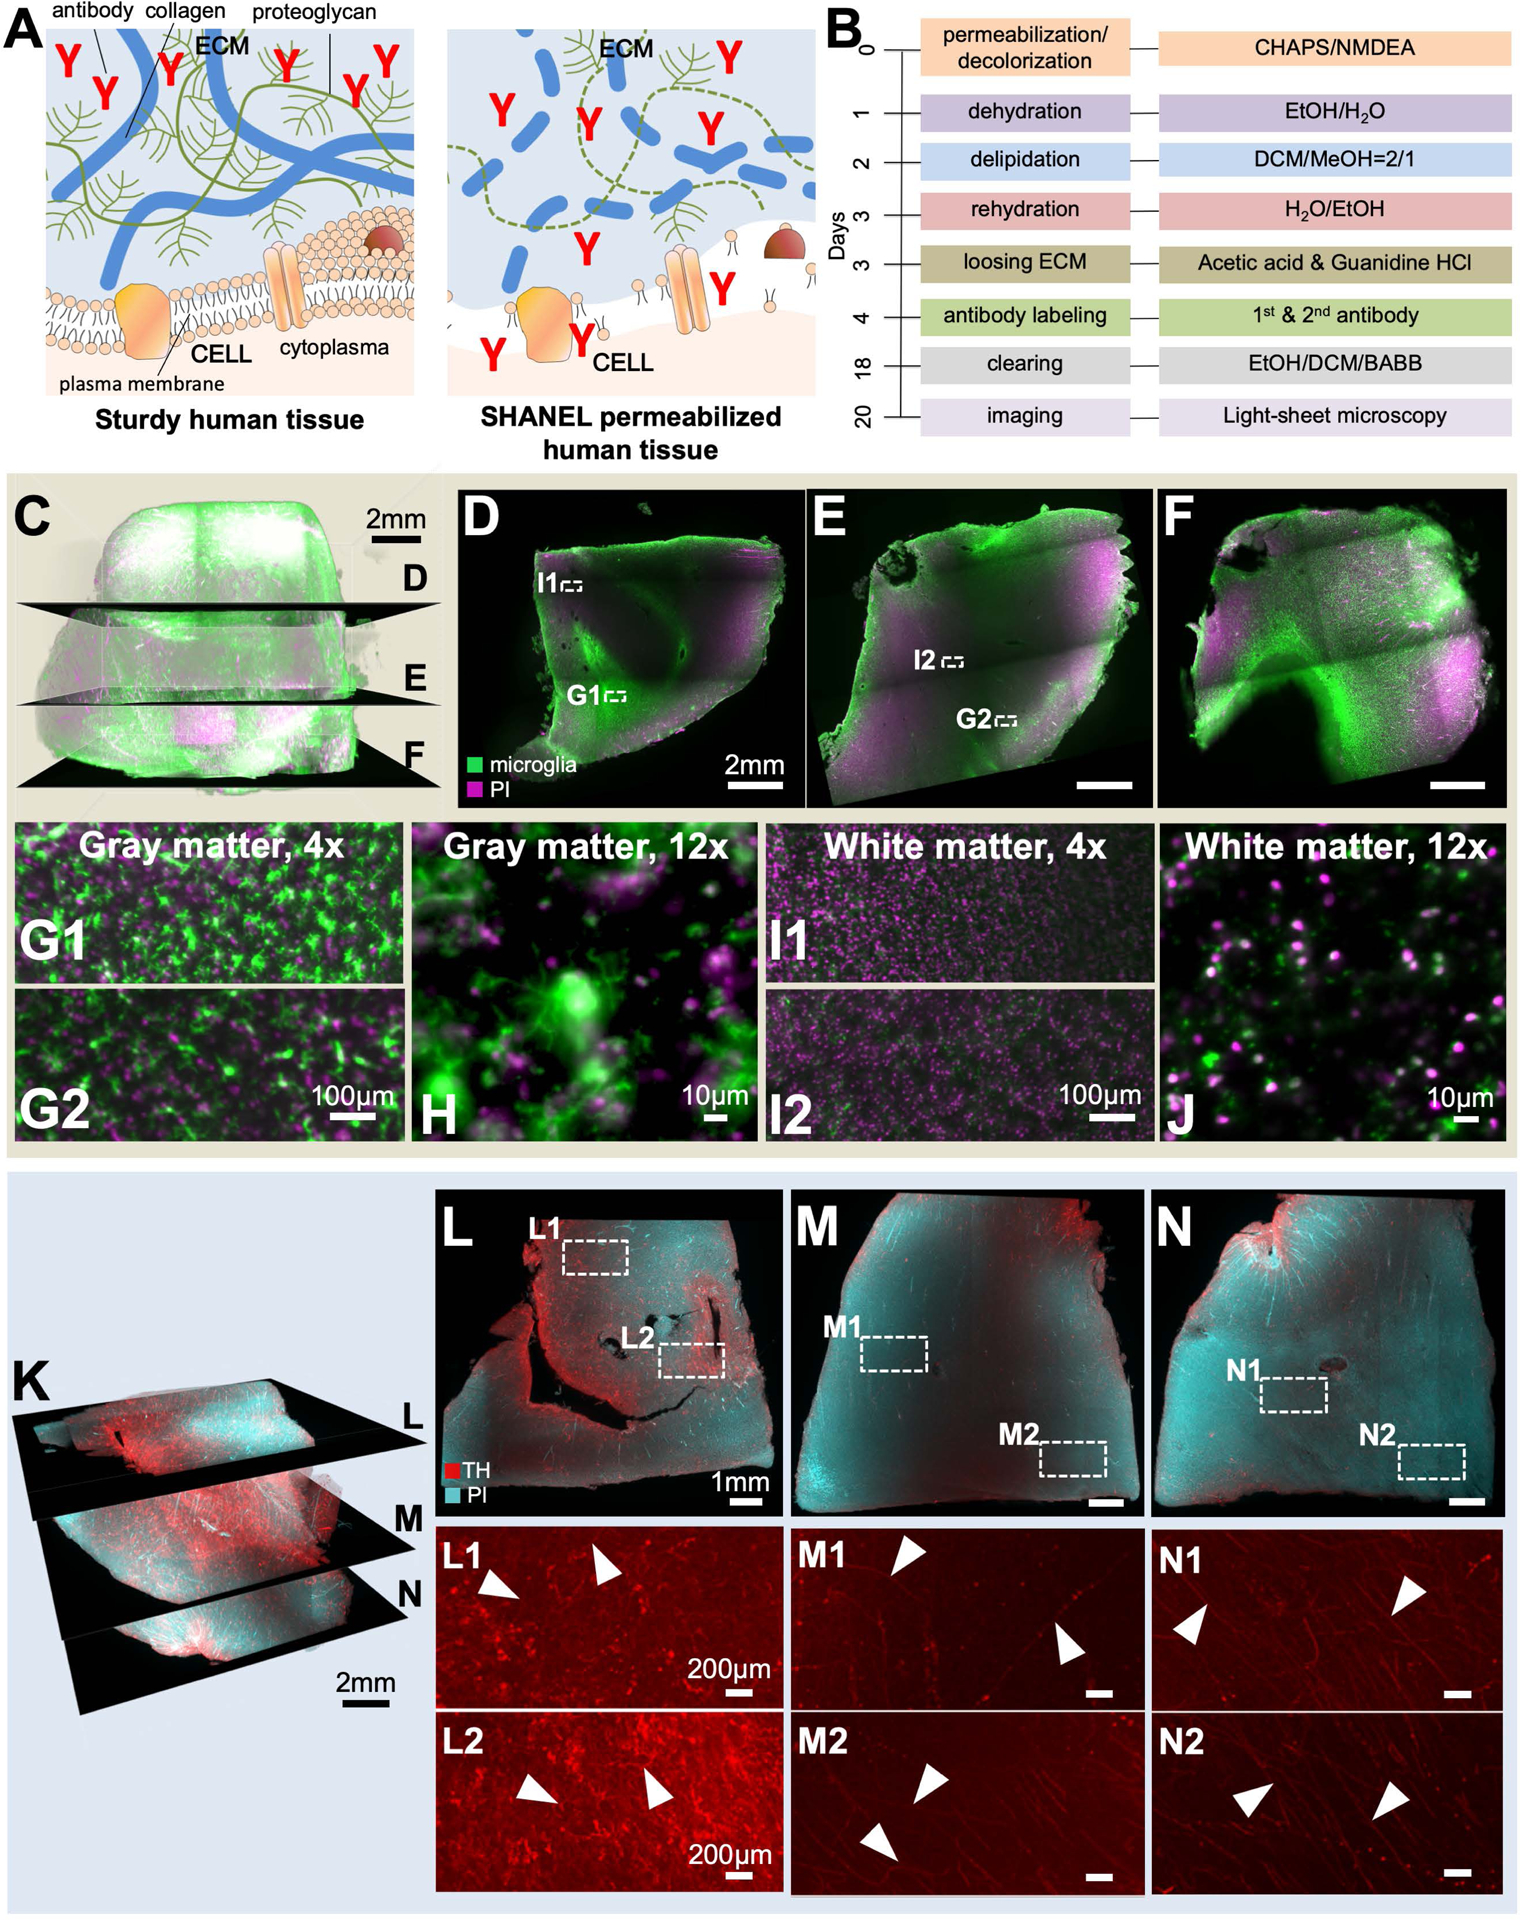
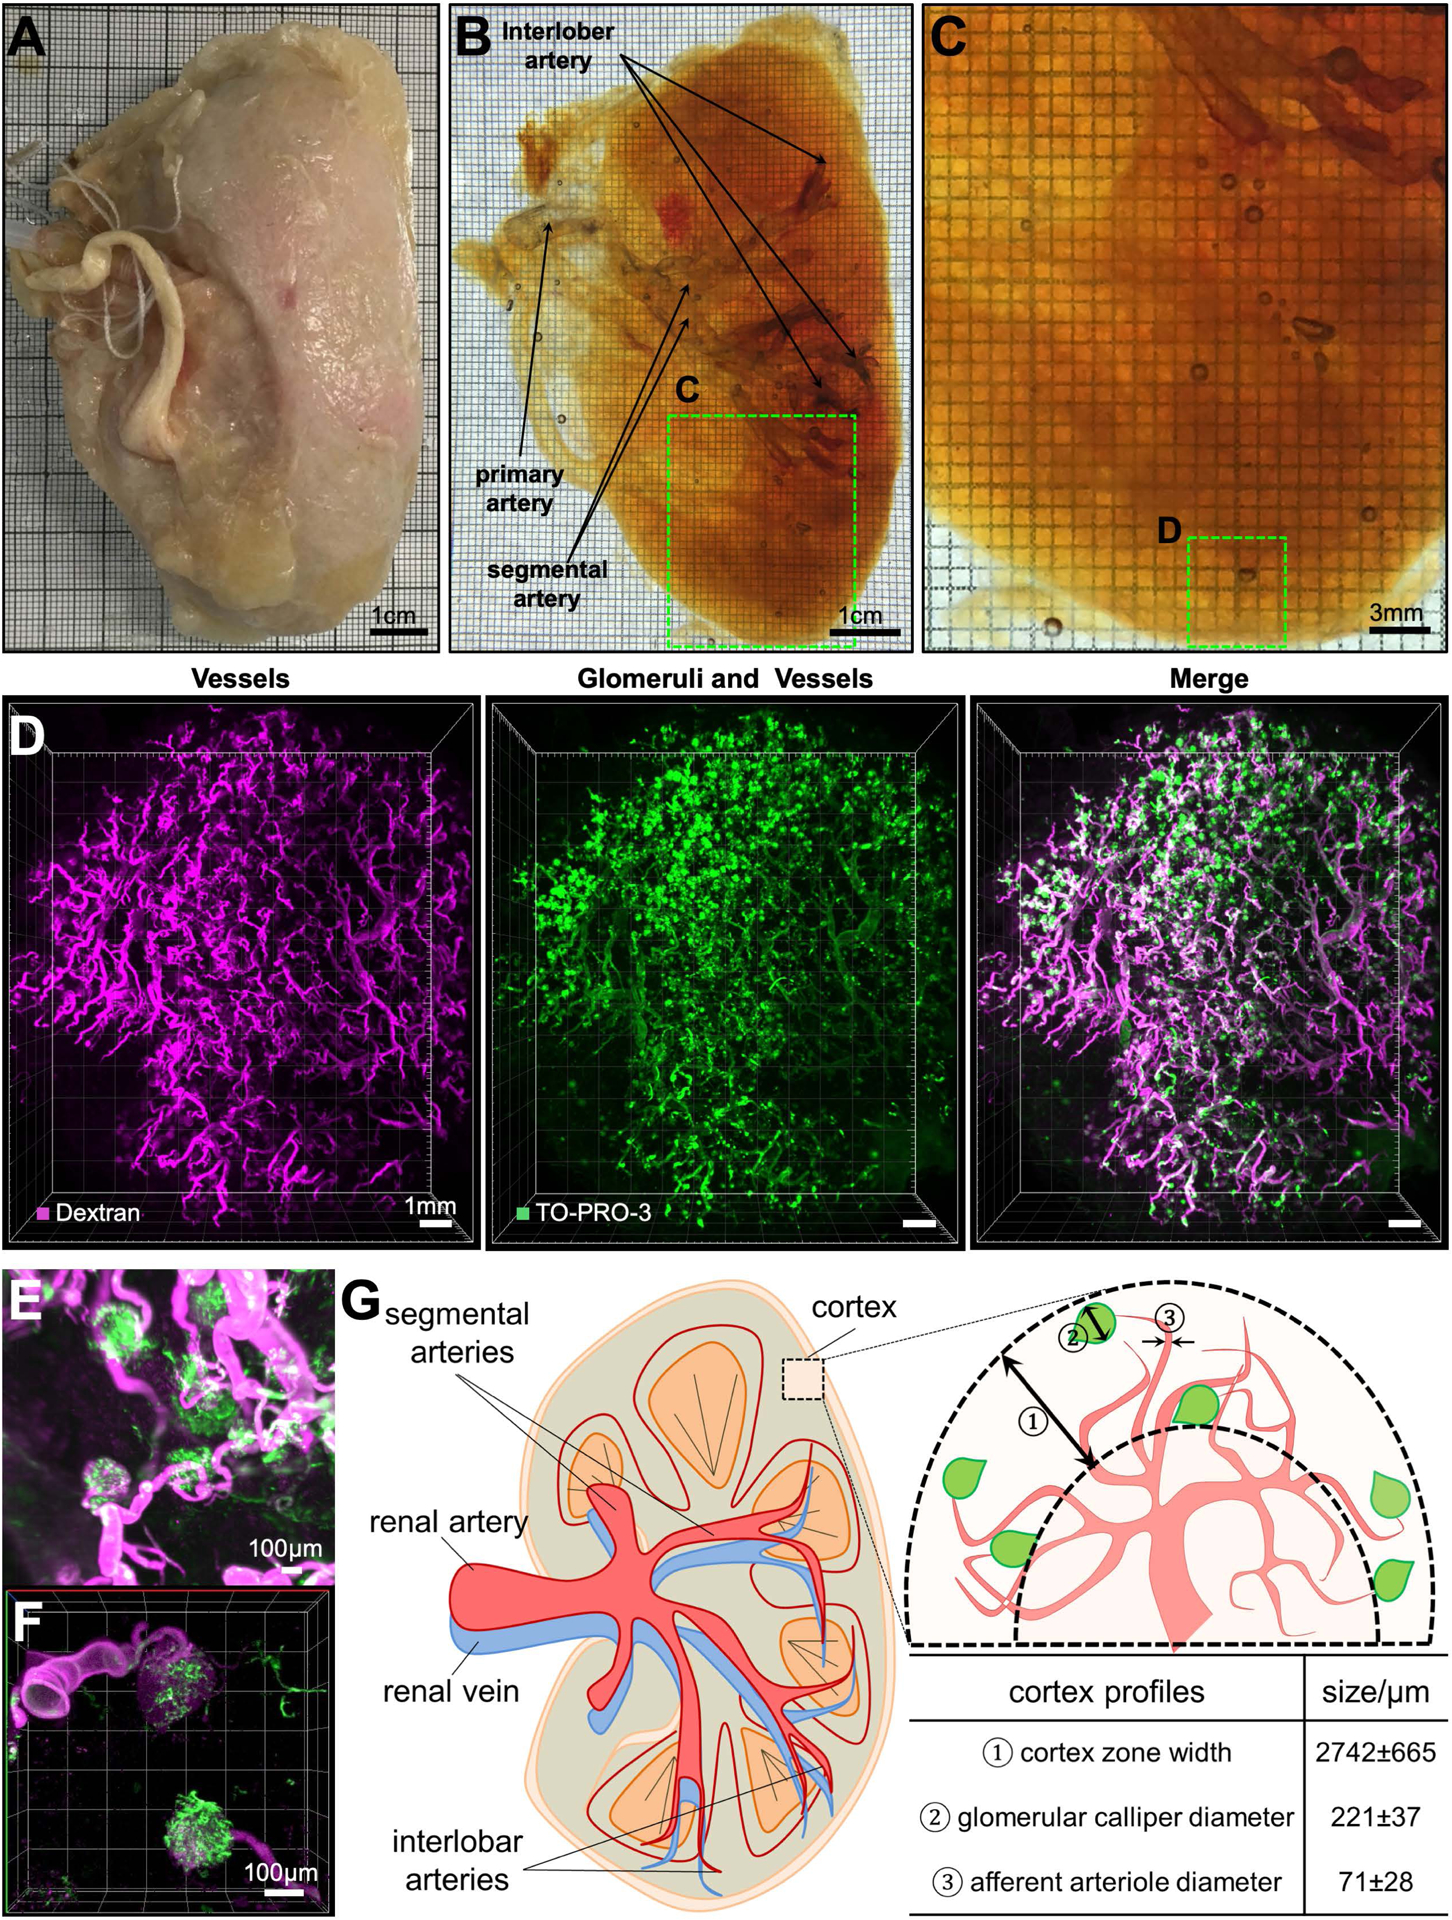
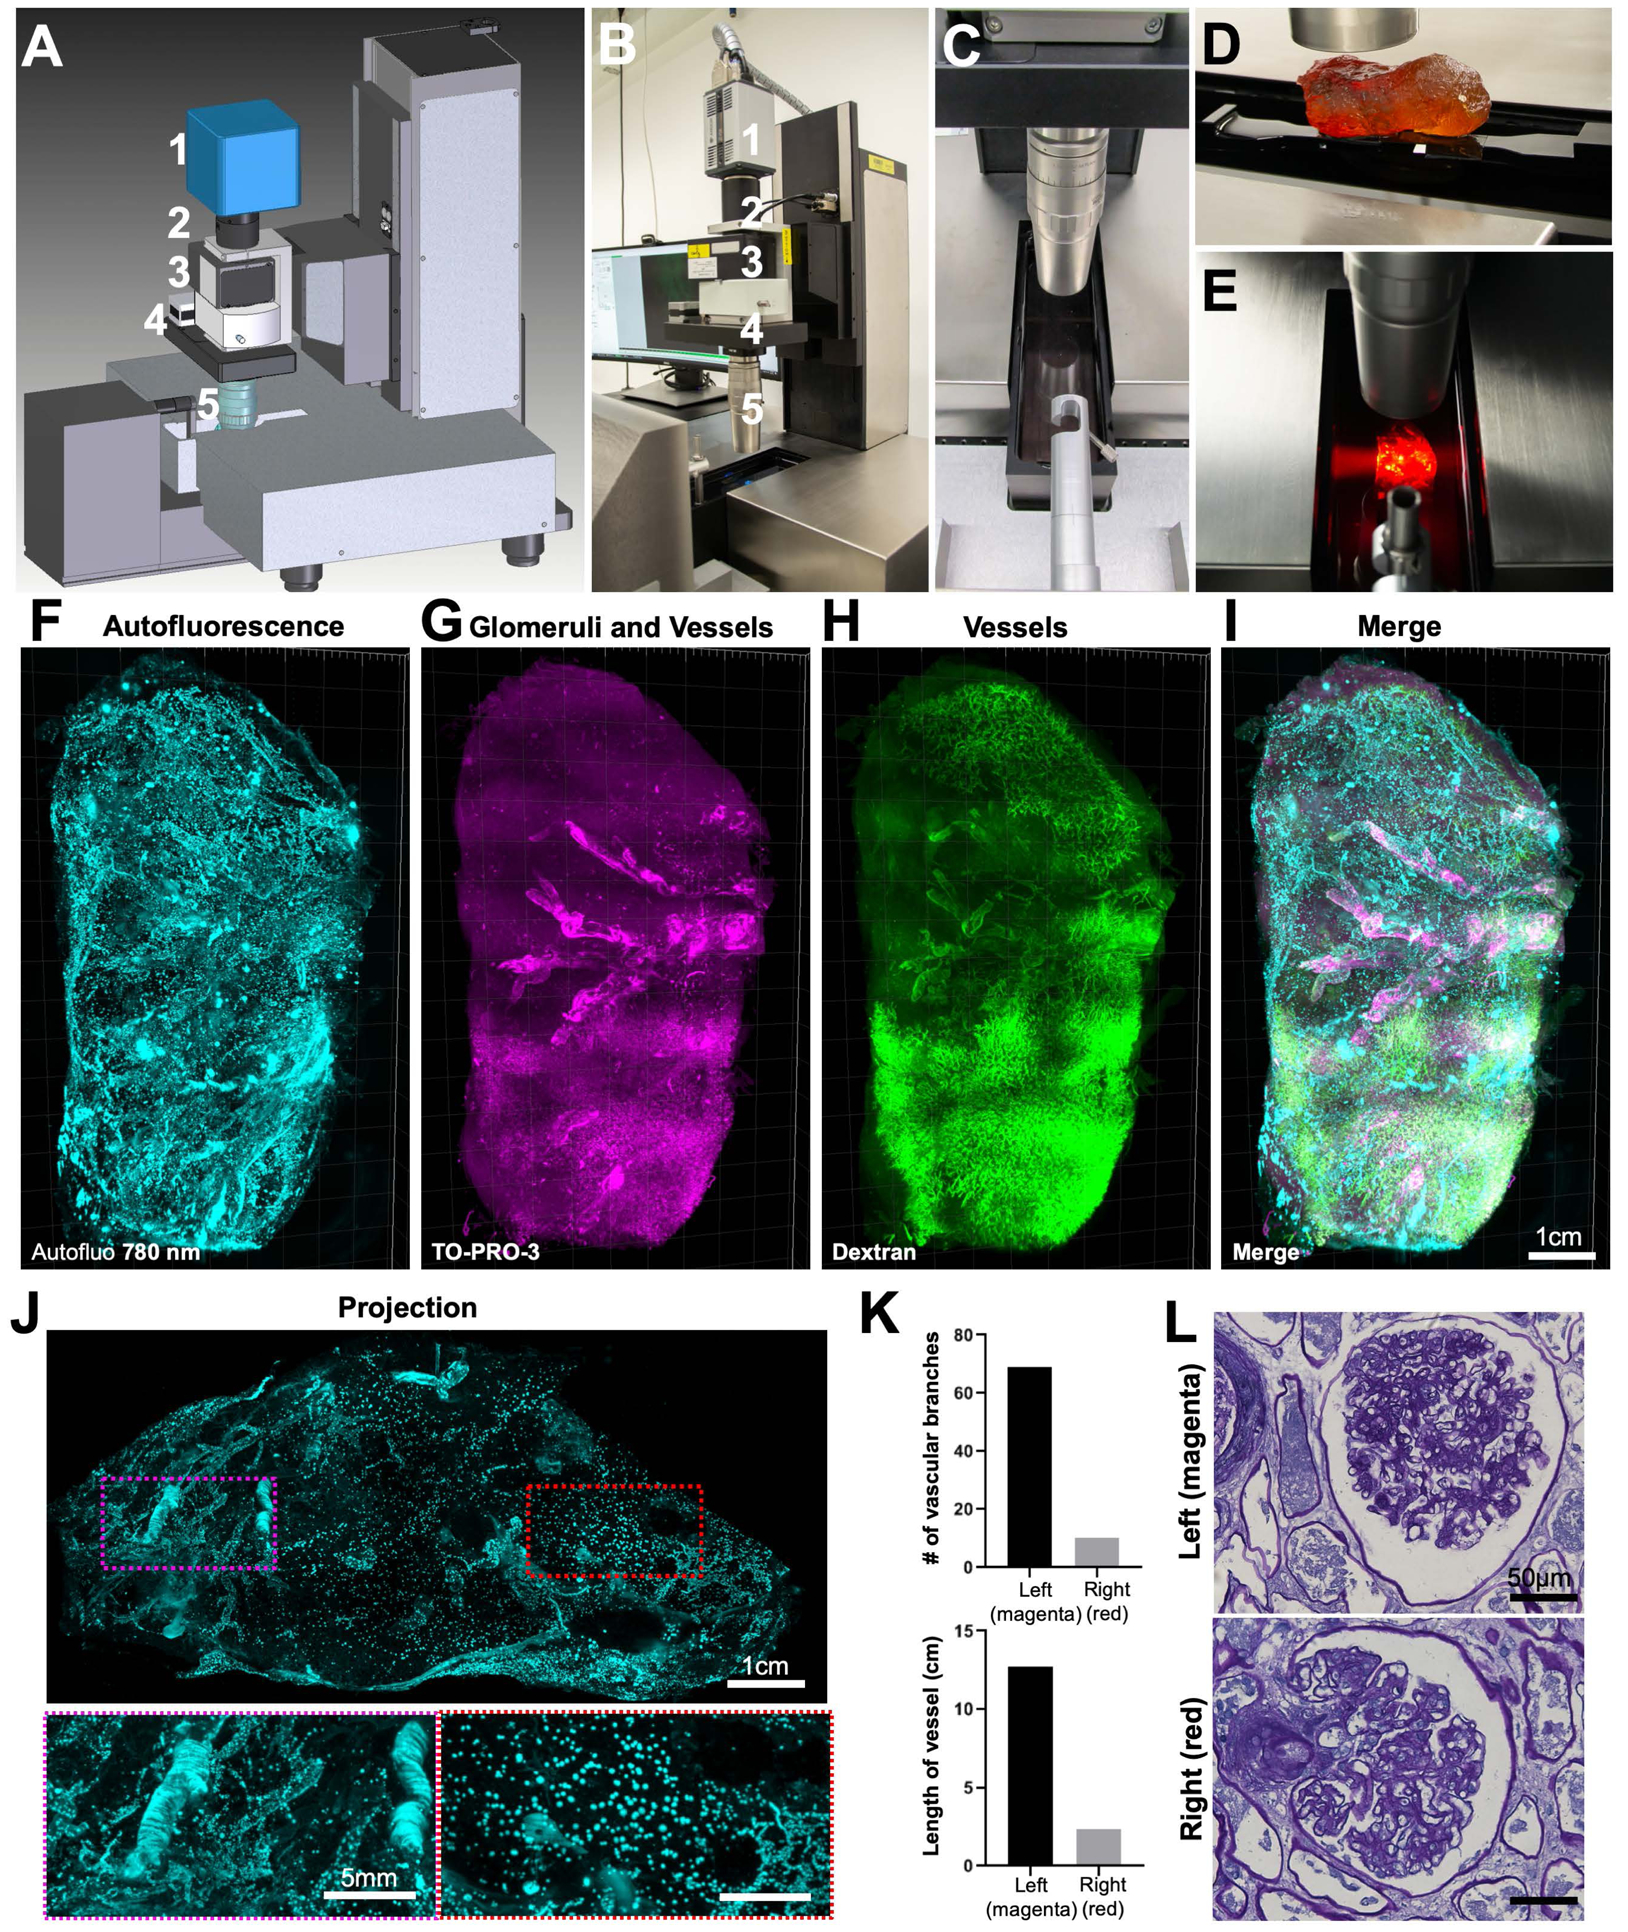
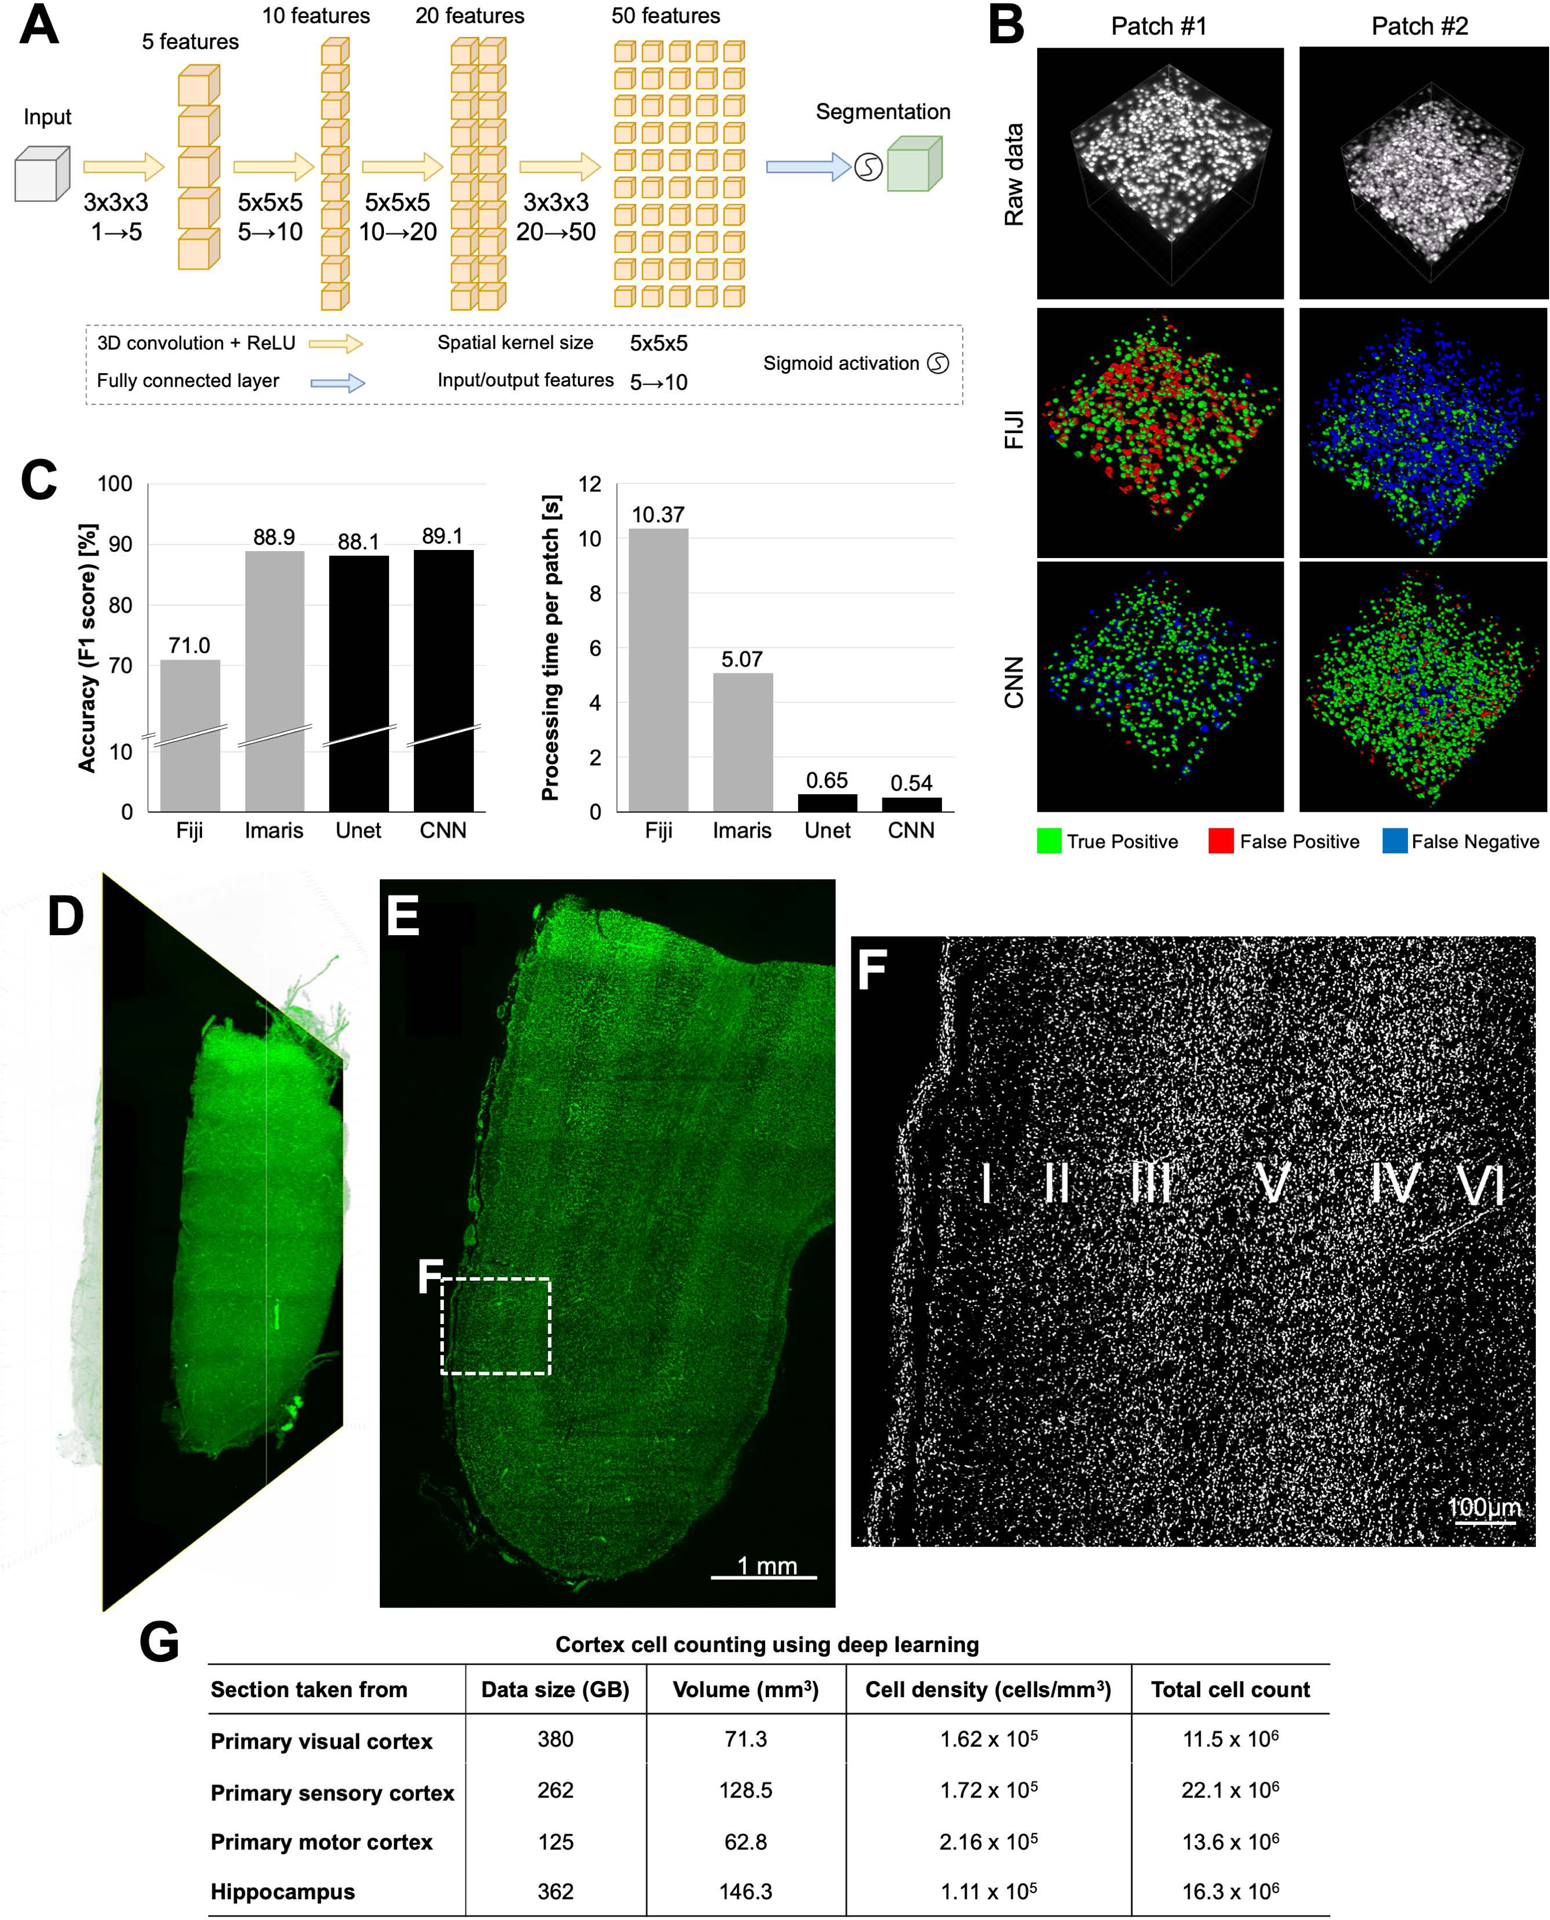
Optical tissue transparency permits scalable cellular and molecular investigation of complex tissues in 3D. Adult human organs are particularly challenging to render transparent because of the accumulation of dense and sturdy molecules in decades-aged tissues. To overcome these challenges, we developed SHANEL, a method based on a new tissue permeabilization approach to clear and label stiff human organs. We used SHANEL to render the intact adult human brain and kidney transparent and perform 3D histology with antibodies and dyes in centimeters-depth. Thereby, we revealed structural details of the intact human eye, human thyroid, human kidney, and transgenic pig pancreas at the cellular resolution. Furthermore, we developed a deep learning pipeline to analyze millions of cells in cleared human brain tissues within hours with standard lab computers. Overall, SHANEL is a robust and unbiased technology to chart the cellular and molecular architecture of large intact mammalian organs.


Conflict of interest statement

Declaration of Interests A.E. has filed a patent on SHANEL technologies described in this study.

Figures

Figure 1.
Figure 1.. CHAPS mediated deep tissue permeabilization and blood decolorization by forming small micelle
(A) 3D molecular and structural features of SDS and Triton X-100 exhibiting typical head-to-tail amphiphilicity, whereas, CHAPS exhibiting peculiar facial amphiphilicity. (B) Schematic diagram showing facial CHAPS could more efficiently and deeply permeabilize tissue compared to standard detergents (SDS and Triton X-100) owing to the formation of smaller micelle. (C) Radii of gyration determined for CHAPS and SDS with their literature values (full references are in Table S1) for Rg (the size of micelle is characterized by the squared radius of gyration of the micellar core, Rg2). Values for CHAPS and SDS represent mean and standard error from at least three independent repeats. (D) Methylene blue dye staining of pig pancreas samples (1–1.5 cm cubes) after detergents permeabilization, showing CHAPS greatly enhanced deep tissue permeabilization for dye travelling comparing with SDS or Triton X-100. (E) Profile plot along each sample dimension in D. (F) Quantification of the pixel numbers in E under selected threshold (Gray Value (GV) < 50) (n=3). (G) Screening of 11 chemicals in (H) without or with CHAPS admixtures for blood decolorization (see Table S2 for the name and CAS number of the chemicals). Good candidates show green supernatant and colorless pellet. CHAPS improves the decolorization efficiency with most tested chemicals. (I) Normalized OD600 of the supernatant corresponded well with the photocamera pictures in G (n=3).
Figure 2.
Figure 2.. SHANEL clearing of brain and pancreas from an adult pig
(A) PFA-fixed adult pig brain with retained blood. (B) Permeabilized and decolorized pig brain by CHAPS/NMDEA. (C) Fully transparent adult pig brain after SHANEL clearing. (D) PFA-fixed, dissected (INS-EGFP transgenic pig) pancreas with retained blood. (E) After CHAPS/NMDEA treatment, the pancreas is completely decolorized. (F) Transparent pig pancreas after SHANEL clearing. (G) 3D distribution of β-cell islets imaged by light-sheet microscopy after anti-EGFP nanobody boosting. (H) High magnification view of the region marked in G (middle panel). (I) High magnification view of the region marked in H showing β-cell islets of single cells (yellow arrows) or multiple cells (white arrows). The majority of larger islet shapes appear circular or oval. See also Movie S1. (J, K) Segmented 3D distribution of β-cells based on their volume in the islets of Langerhans. The heterogeneity of islet sizes is evident. (L) Quantification of the total number of detected islets and categorization according to their volume.
Figure 3.
Figure 3.. SHANEL clearing of intact adult human brain
(A) A sample of permeabilized and decolorized intact adult human brain by CHAPS/NMDEA via active pumping setup (black arrows). (B) SHANEL letters are visible, through the transparent whole human brain illuminated with 1450 nm short-wave infrared (SWIR) light. (C) Light of epifluorescent microscope can travel in the brain end-to-end, demonstrating the full transparency of intact human brain, which has volume of ~1344 cm3 and dimensions of ~15.0 × 10.4 × 14.4 cm. (D) Camera picture of an eye, dissected from the intact transparent human brain. (E) 3D reconstruction from light-sheet microscopy scans of the eye showing the sclera, suspensory ligament and iris structures. See also Movie S2.
Figure 4.
Figure 4.. SHANEL histology on centimeters-thick human tissues imaged by light-sheet microscopy
(A) SHANEL histology is further characterized by loosening extracellular matrix (ECM) and extracting lipids, which enable antibody-size molecules to fully penetrate into centimeter-thick sturdy human tissues. (B) The step by step SHANEL histology pipeline (with durations) for deep tissue antibody labeling. (C-F) Iba1 microglia (green) and propidium iodide (PI) (magenta) labeling of post-mortem human brain tissue with an original size of 2.0 × 1.8 × 1.5 cm (1.3 × 1.2 × 1.0 cm after shrinkage). The differences in microglia density and morphology are evident throughout the gray matter (G, H) and white matter (I, J). (K) Tyrosine hydroxylase (TH) (red) and propidium iodide (PI) (cyan) labeling of post-mortem human brain tissue with an original size of 1.8 × 1.8 × 1.5 cm (1.2 × 1.2 × 0.91 cm after shrinkage). (L-N) TH+ axonal extensions in gray matter (white arrowheads in L1-L2) and white matter (white arrowheads in M1-N2) throughout the entire depth of tissue are evident. Note that cyan channel is not shown in L1-N2 to emphasize the TH labeling. See also Movies S3.
Figure 5.
Figure 5.. Cellular investigation of human kidney
(A-C) A PFA-fixed adult human kidney (A) was rendered totally transparent after SHANEL clearing, revealing visible arteries (B,C). (D) 3D reconstruction of vessels and glomeruli of the kidney cortex region marked in (C) by light-sheet microscopy. TRITC-dextran labels mostly the vessels (magenta), while TO-PRO-3 labels glomeruli more prominently (green). High magnification light-sheet microscopy (E) and confocal microscopy (F) images show the structural details of afferent arteriole (magenta) and glomeruli (green). (G) Human kidney anatomy and cortex profiles from the 3D reconstruction. See also Movie S4.
Figure 6.
Figure 6.. Whole kidney imaging using Ultramicroscope Blaze with extended sample holding capacity
Plan (A) and picture (B) of the prototype LaVision (Miltenyi) Biotec light-sheet Ultramicroscope Blaze for large samples, featuring (1) Andor sCMOS camera, (2) tube, (3) LaVision autofocusing unit for automatic focus correction at different wavelengths, (4) zoom body, (5) 1.1x MI PLAN objective. (C) Imaging chamber. (D) A whole adult human kidney was mounted on the holder (note that the sample does not look transparent if not immersed in RI matching solution (BABB) as shown in the image). (E) View of cleared whole human kidney placed in the imaging chamber with the light-sheet from the left crossing through the sample. (F-I) 3D reconstruction of whole adult human kidney (original size of 11 × 6.5 × 5 cm) imaged by the prototype light-sheet microscope. Shown are the auto-fluorescence signal at 780 nm (F, cyan), the glomeruli and vessels from TO-PRO-3 labeling (G, magenta), the vessels from the dextran labeling (H, green), and themerged view of (F)–(H) in (I). (J) An orthogonal 1 mm projection of the kidney showing that vascular structures are significantly reduced at the right side (red-dashed region) compared to left side of the kidney (magenta-dashed region). See also Movie S4. (K) Quantification of vascular features between the left (magenta) and right (red) regions of the kidney. (L) Periodic Acid Schiff (PAS) images of rehydrated samples dissected from the left (magenta) and right (red) regions showing similar glomeruli structures for both sides.
Figure 7.
Figure 7.. Deep learning-based quantification of cleared human brain tissues
(A) The architecture of our convolutional neural network (CNN). (B) Visual comparisons of deep learning segmentation performance to alternative automated methods on two test patches, color-coded. (C) Comparisons of deep learning (black columns) and alternative automated methods (gray columns) for cell counting accuracy (left) and processing time (right). The cell counting accuracy is quantified as the F1 score, which represents the harmonic mean of recall (cell detection rate) and precision (false positive rate). Reported processing times were measured for the task of detecting and segmenting all cells of a 3D patch (291 μm3) on a normal workstation (32 Cores, 2 GPUs). (D) 3D reconstruction of primary visual cortex area having ~11.5 million cells. (E) Raw orthogonal image from the middle of D. (F) CNN segmented image from the region marked in E. Six layers of primary visual cortex can readily be identified in CNN segmented images (100 μm projection). (G) The summary of cell properties from different brain regions taken from cortex and hippocampus area analyzed using our CNN.

References

    1. Amunts K, Lepage C, Borgeat L, Mohlberg H, Dickscheid T, Rousseau ME, Bludau S, Bazin PL, Lewis LB, Oros-Peusquens AM, et al. (2013). BigBrain: an ultrahigh-resolution 3D human brain model. Science 340, 1472–1475. - PubMed
    1. Annunziato ME, Patel US, Ranade M, and Palumbo PS (1993). p-maleimidophenyl isocyanate: a novel heterobifunctional linker for hydroxyl to thiol coupling. Bioconjugate chemistry 4, 212–218. - PubMed
    1. Baek K, Jung S, Lee J, Min E, Jung W, and Cho H (2019). Quantitative assessment of regional variation in tissue clearing efficiency using optical coherence tomography (OCT) and magnetic resonance imaging (MRI): A feasibility study. Scientific Reports 9, 2923. - PMC - PubMed
    1. Belle M, Godefroy D, Couly G, Malone SA, Collier F, Giacobini P, and Chedotal A (2017). Tridimensional Visualization and Analysis of Early Human Development. Cell 169, 161–173 e112. - PubMed
    1. Belle M, Godefroy D, Dominici C, Heitz-Marchaland C, Zelina P, Hellal F, Bradke F, and Chedotal A (2014). A simple method for 3D analysis of immunolabeled axonal tracts in a transparent nervous system. Cell Rep 9, 1191–1201. - PubMed

Publication types

MeSH terms