. 2020 Mar 5;26(3):420-430.e6.
doi: 10.1016/j.stem.2020.01.016. Epub 2020 Feb 13.

Asymmetrically Segregated Mitochondria Provide Cellular Memory of Hematopoietic Stem Cell Replicative History and Drive HSC Attrition

Affiliations

Asymmetrically Segregated Mitochondria Provide Cellular Memory of Hematopoietic Stem Cell Replicative History and Drive HSC Attrition

Ashwini Hinge et al. Cell Stem Cell. .

Abstract

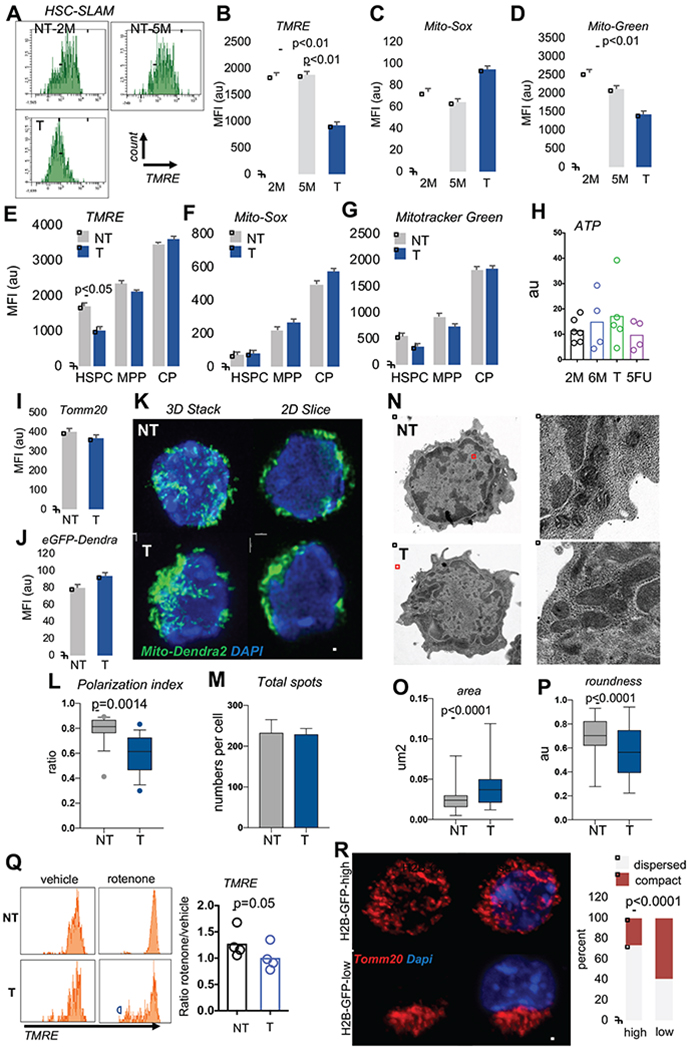
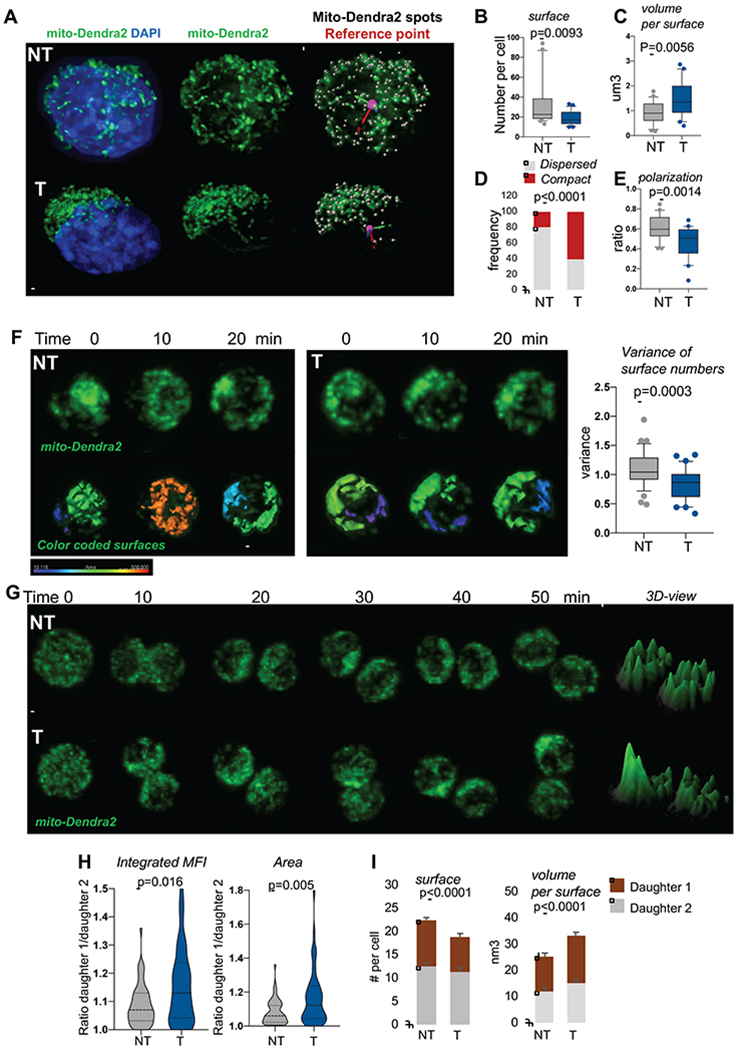
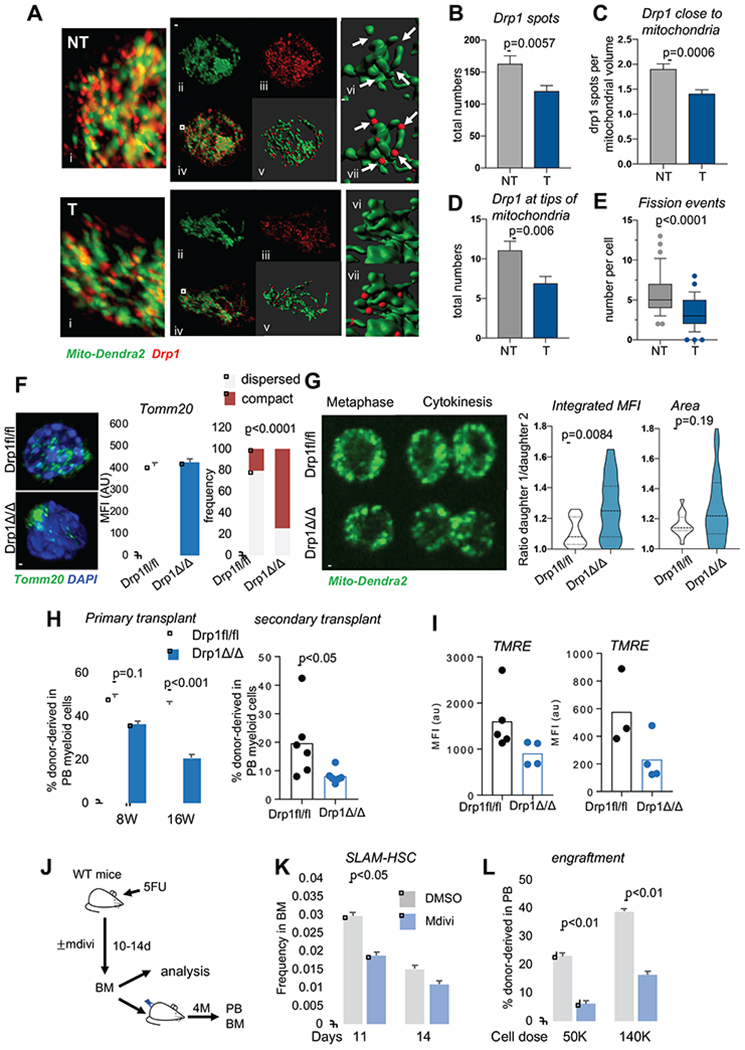
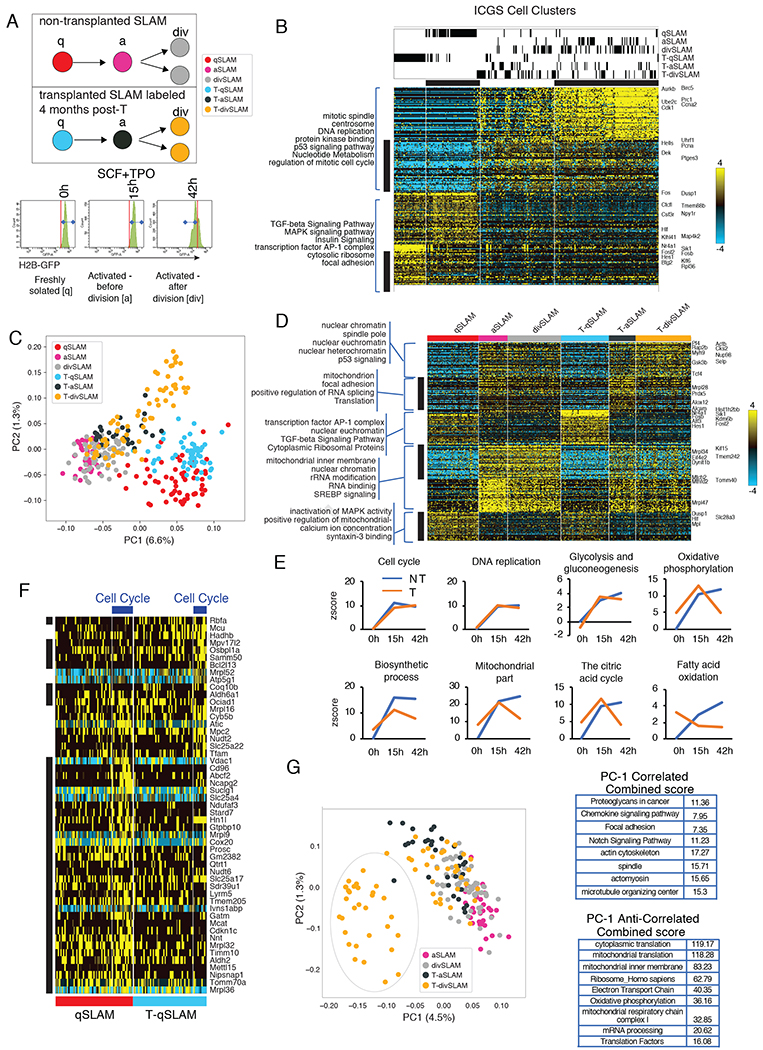
The metabolic requirements of hematopoietic stem cells (HSCs) change with their cell cycle activity. However, the underlying role of mitochondria remains ill-defined. Here we found that, after mitochondrial activation with replication, HSCs irreversibly remodel the mitochondrial network and that this network is not repaired after HSC re-entry into quiescence, contrary to hematopoietic progenitors. HSCs keep and accumulate dysfunctional mitochondria through asymmetric segregation during active division. Mechanistically, mitochondria aggregate and depolarize after stress because of loss of activity of the mitochondrial fission regulator Drp1 onto mitochondria. Genetic and pharmacological studies indicate that inactivation of Drp1 causes loss of HSC regenerative potential while maintaining HSC quiescence. Molecularly, HSCs carrying dysfunctional mitochondria can re-enter quiescence but fail to synchronize the transcriptional control of core cell cycle and metabolic components in subsequent division. Thus, loss of fidelity of mitochondrial morphology and segregation is one type of HSC divisional memory and drives HSC attrition.


Conflict of interest statement

Declaration of Interests The authors declare no competing interests.

Figures

Figure. 1.
Figure. 1.. HSC keep dysfunctional mitochondria after replication
(A) Representative flow cytometry histogram of mitochondrial TMRE levels in 2 month(M)-old and 5 month-old non-transplanted [NT] mice, and transplanted [T] mice. (B-D) quantification of mitochondrial parameters in 2M-old, and 5M-old NT SLAM and T SLAM, (mean±sem; n=7 mice). (E-G) quantification of mitochondrial parameters, mean±SD, n=6 mice. (HSPC: LSK-CD48-; MPP: LSK-CD48+; CP:LK) (H) quantification of ATP production in SLAMs from NT (2M, 6M), T and 14 days after 5FU (mean±SD, n=5). (I) mitochondrial mass in NT and T SLAMs using Tom20 staining, mean fluorescent intensity (MFI) of Tom20 staining (mean±SD, n=203 in NT; 95 in T). (J) Quantification of mito-Dendra2 MFI by flow cytometry mean±SD, n=6 mice. (K) Representative IF images of mito-Dendra2 NT or T SLAM, shown as a 3D stack or one 2D slice view. scale bar 2μm. (L-M) Mito-Drendra2 signals analyzed in Imaris using spot detection algorithm positioned relative to a reference point. (L) Polarization of mitochondrial spots per cell. (M) Total number of mito-Dendra2 spots per cell (n=24 NT and 20T, one representative experiment of 3) (N-P) Mitochondrial analysis using transmission electron microscopy. (N) Representative images of NT and T SLAM. Zoom view of cell area highlighted in red is shown on the right images. (O) Area occupied by mitochondria. (P) quantification of roundness of mitochondria. (n=77 NT, 99 T mitochondria in 24NT and 19T cells). (Q) Flow cytometry histogram and quantification of TMRE in NT and T HSPC after treatment with rotenone (1uM). (mean±s.e.m, paired student T-Test). (R) Representative IF images of Tom20 staining in SLAMs from GFP-labeled H2B mice [high GFP and low GFP] isolated after 5 months of doxycycline removal and frequency of SLAMs with large mitochondrial clusters (n=90-100 cells; exact fisher test). All data are from 2-3 independent experiments. scale bar 2μm
Figure 2.
Figure 2.. Mitochondria are asymmetrically inherited during HSC division.
(A) Representative IF images of mitochondria in activated SLAMs, scale bar 1μm. Mitochondria in green, nucleus stained with DAPI in blue. Scale bar 2μm (B-C) Mitochondrial network analyzed using Imaris surface building algorithm. (B) Number of separated mito-Dendra2 segments identified as surfaces per cell. (C) Average volume per mito-Dendra2 segments per cell, n=21 NT and 25 T. (D) Quantification of cells observed with dispersed versus compact mitochondrial organization; n=57 for NT, 74 for T, fisher exact test. (E) Quantification of polarization of mitochondria, n=23 NT and 24 T. (F) NT and T mito-Dendra2 SLAM were imaged live during interphase for several minutes. Representative IF images and quantification of mitochondrial motility. Graph is variance of surfaces per time point, n=36. Scale bar 5μm (G-I) NT and T mito-Dendra2 SLAM divisions were traced in vitro using live IF. (G) Representative images of mitochondria during mitosis, 3D representation of maximum intensity project using ImageJ. Scale bar 5μm (H) Integrated MFI and area occupied by mitochondria per daughter cell. Graph is ratio of each paired-daughter cell, n=55 NT and 44 T, Mann Whitney Test. (I) quantification of mitochondrial inheritance using Imaris surface building, numbers of surface per cell and average volumes per mitochondrial objects per cell are shown, mean±SD, n=30-35 cells.
Figure 3.
Figure 3.. Impaired distribution of Drp1 on mitochondria in HSC after division. Mitochondrial remodeling drives HSC functional decline.
(A-E). Analysis of Drp1 onto mitochondria during NT and T SLAM activation in vitro(24h in culture). Quantification of mito-Dendra2 (green) was done with Imaris surface building. Drp1 signals (in red) were analyzed using Imaris spot detection. (A) Representative IF images Scale bar 5μm. (B) Total number of Drp1 spots per cell. (C) Numbers of Drp1 spots that were within 0.3 microns of a mitochondrial surface. (D) Numbers of Drp1 spots that were at the tip of mitochondrial surfaces. (E) Numbers of fission events identified at mitochondrial segments separated by Drp1 spots per cell. (mean±s.e.m, n=27NT and 28T cells, unpaired T-Test, representative experiment. Analysis was done blind by 2 individuals (F) Representative IF images, quantification of Tom20 and observed cell frequency with dispersed vs compact mitochondria in Drp1fl/fl and Drp1Δ/Δ SLAMs (n=100-120 cells; exact fisher test). scale bar 5μm (G) Mito-Dendra2 Drp1fl/fl and Drp1Δ/Δ SLAM divisions were traced in vitro using live IF imaging. Representative images of mitosis, scale bar 5μm. Graphs are ratio of Integrated MFI and area occupied by mitochondria per daughter cell. (n=25 divisions, Mann-Whitney Test) (H) Serial competitive transplantation of Drp1fl/fl and Drp1Δ/Δ BM cells showing donor chimerism in peripheral blood in myeloid cells 4 months post-primary transplant and 3 months post-secondary transplant. mean±SD, n=12 mice for primary transplant; n=6 for secondary transplant. (I) TMRE in Drp1fl/fl and Drp1Δ/Δ SLAMs 4 months post-transplantation (n=3-4 mice per experiments, 2 independent experiments are shown). (J-L) WT mice challenged with 5FU were treated with mdivi or vehicle (DMSO) for 14 days. BM was analyzed and used for subsequent competitive transplant. (J) scheme of experiment. (K) donor-derived SLAM frequency in BM of treated mice. (L) donor chimerism in PB at 16 weeks post-transplantation (mean±SD, n=7-9 mice).
Figure 4.
Figure 4.. Asynchrony in expression of nuclear-encoded mitochondrial genes in HSC after division.
(A) Schema of gene expression analysis by sc-RNA-seq using H2BeGFP labeled SLAM from naïve animals or after transplantation on freshly isolated cells, activated cells (15 hours) and on cells that have divided once (42 hours, see Figure S4 and Table S1 for datasets). (B) Heatmap of genes delineated by ICGS in scRNA-Seq data (n=301 cells). Columns represent cells. Rows represent genes. ICGS cell clusters are indicated and cell populations comprised in each cluster is indicated at the top. ICGS guide genes are displayed (right). (see Table S1) (C) PCA visualization of indicated cells. (D) Hierarchical clustering of differentially expressed genes in indicated population using pairwise comparative analysis. (see Table S1) (E) Differential gene expression of each group of cells was compared to qSLAM. Graphs are z-scores of indicated GO category. (F) Hierarchical clustering of differentially expressed mitochondrial genes in freshly isolated SLAM from naive non-transplanted [qSLAM] and transplanted animals [T-qSLAM]. (see Table S1) (G) PCA visualization of indicated cells. Bar graph is top gene ontology category of differentially expressed genes represented in PC1.

Comment in

References

    1. Adachi Y, Itoh K, Yamada T, Cerveny KL, Suzuki TL, Macdonald P, Frohman MA, Ramachandran R, Iijima M, and Sesaki H. 2016. Coincident Phosphatidic Acid Interaction Restrains Drp1 in Mitochondrial Division. Molecular cell 63:1034–1043. - PMC - PubMed
    1. Anesti V, and Scorrano L. 2006. The relationship between mitochondrial shape and function and the cytoskeleton. Biochim Biophys Acta 1757:692–699. - PubMed
    1. Benard G, and Karbowski M. 2009. Mitochondrial fusion and division: Regulation and role in cell viability. Seminars in cell & developmental biology 20:365–374. - PMC - PubMed
    1. BenediktWestermann. 2014. Mitochondrial inheritance in yeast. BBA Bioenergetics 1837:1039–1046. - PubMed
    1. Bernitz JM, K. H, MacArthur B, Sieburg H, Moore K 2016. Hematopoietic Stem Cells Count and Remember Self-Renewal Divisions. Cell 167:1296–1309. - PMC - PubMed

Publication types

LinkOut - more resources