. 2020 May:213:161-176.
doi: 10.1016/j.ajo.2020.02.003. Epub 2020 Feb 12.

Quantification of Choriocapillaris with Phansalkar Local Thresholding: Pitfalls to Avoid

Affiliations

Quantification of Choriocapillaris with Phansalkar Local Thresholding: Pitfalls to Avoid

Zhongdi Chu et al. Am J Ophthalmol. 2020 May.

Abstract

Purpose: To demonstrate the proper use of the Phansalkar local thresholding method (Phansalkar method) in choriocapillaris (CC) quantification with optical coherence tomography angiography (OCTA).

Design: Retrospective, observational case series.

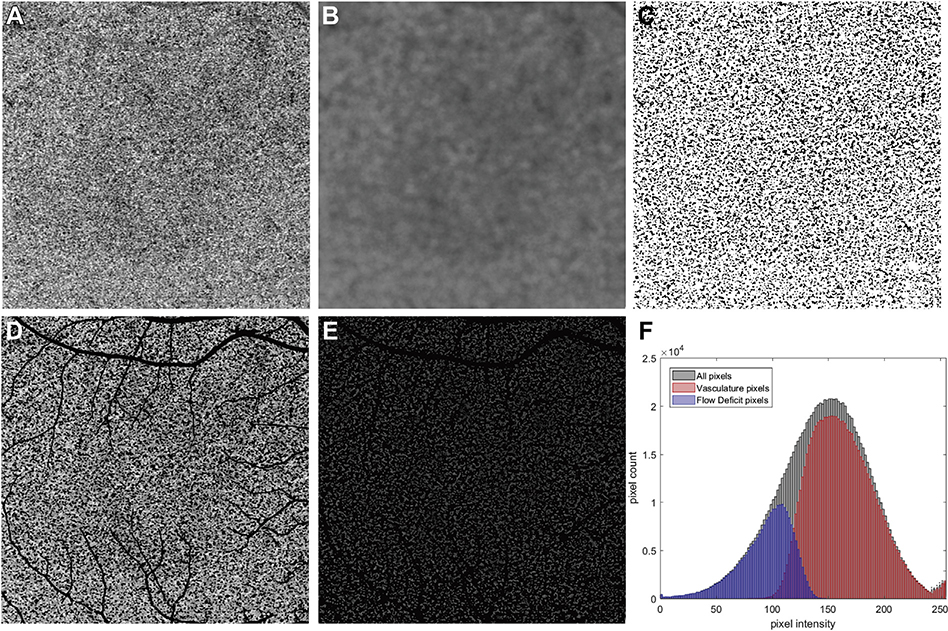
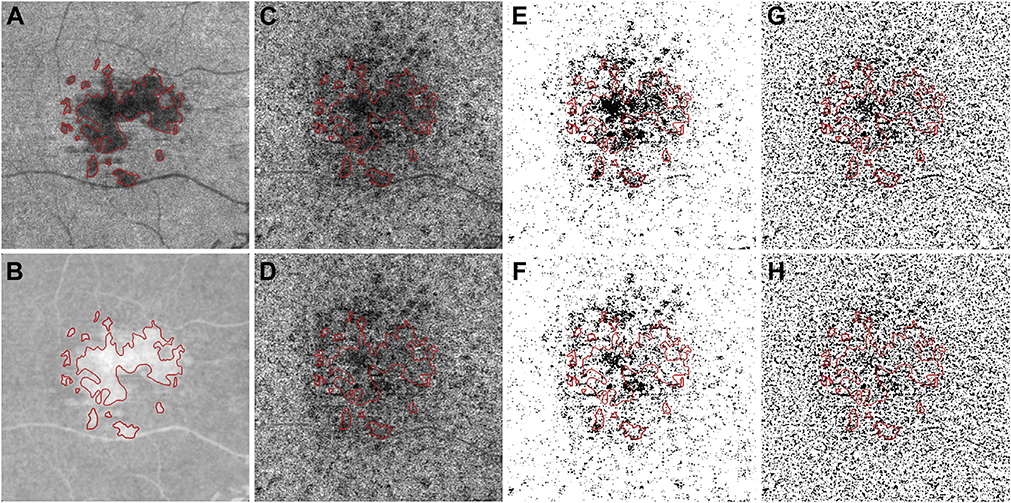
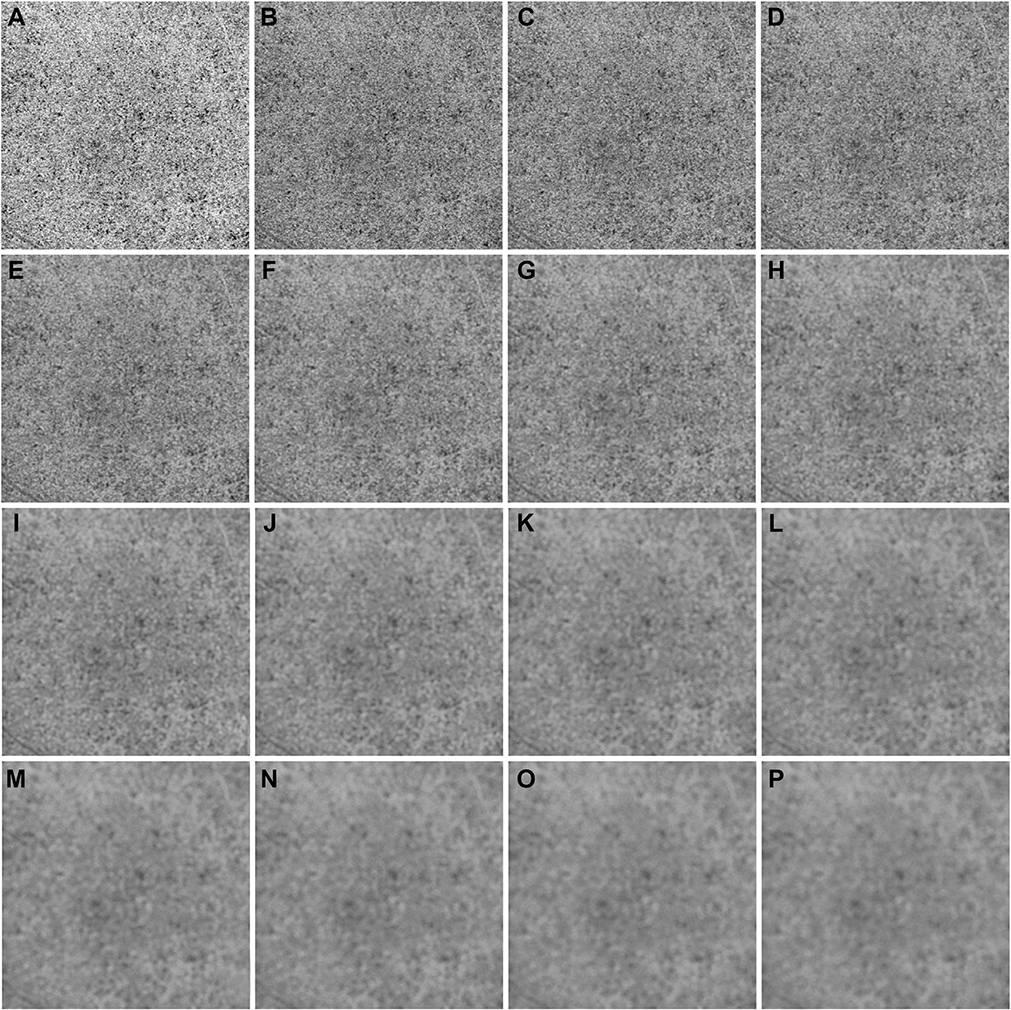
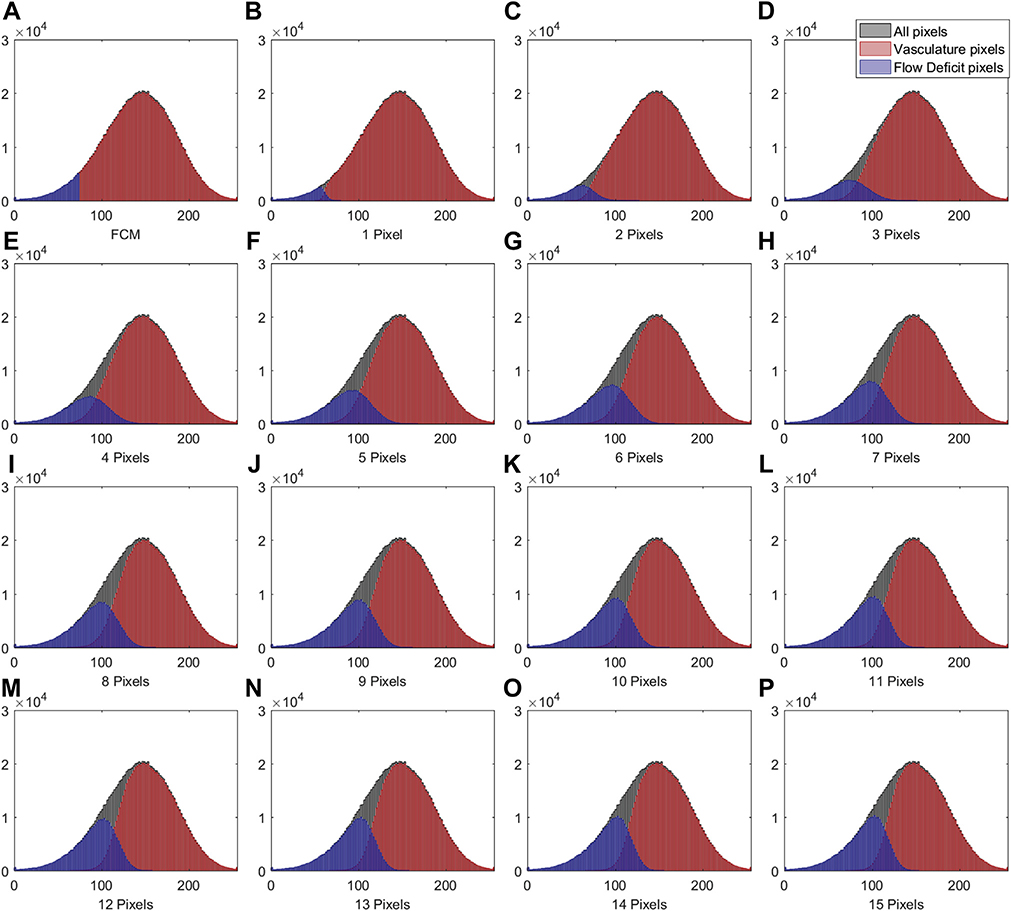
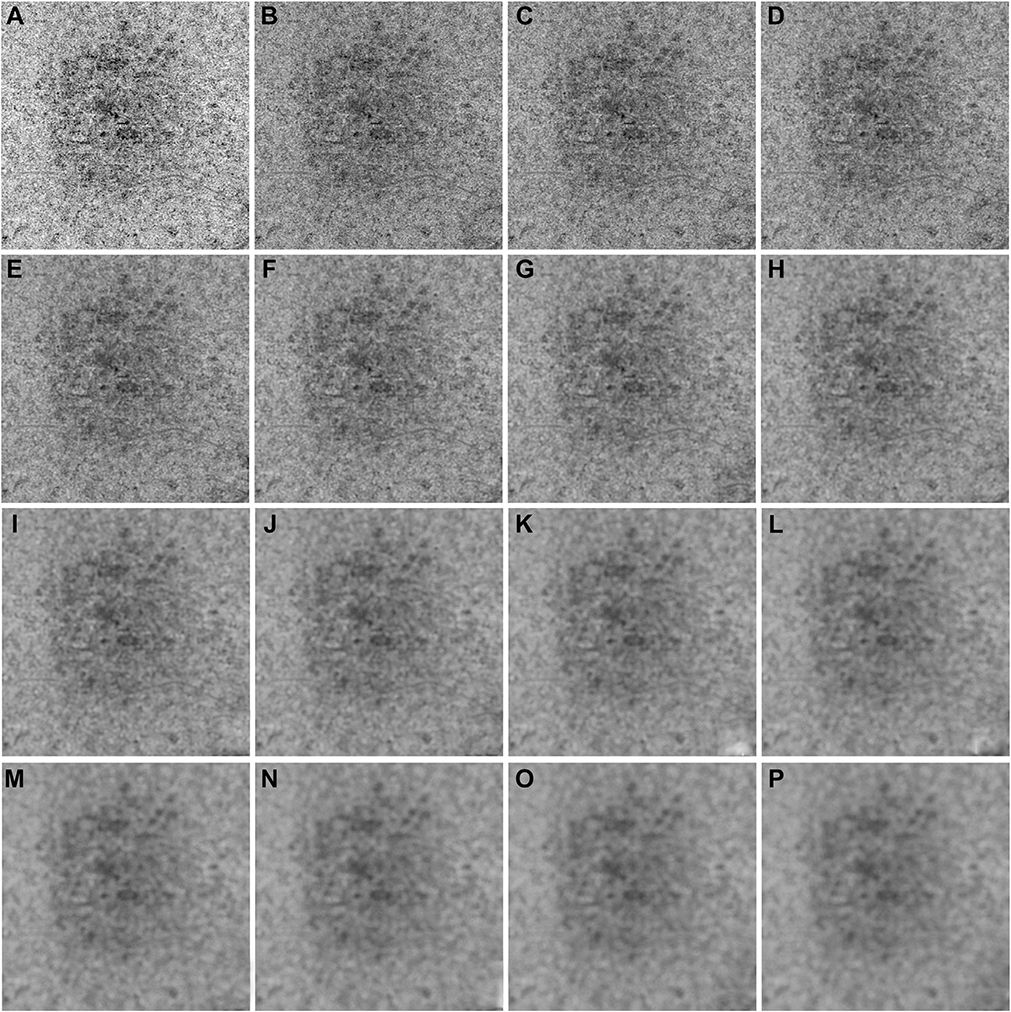
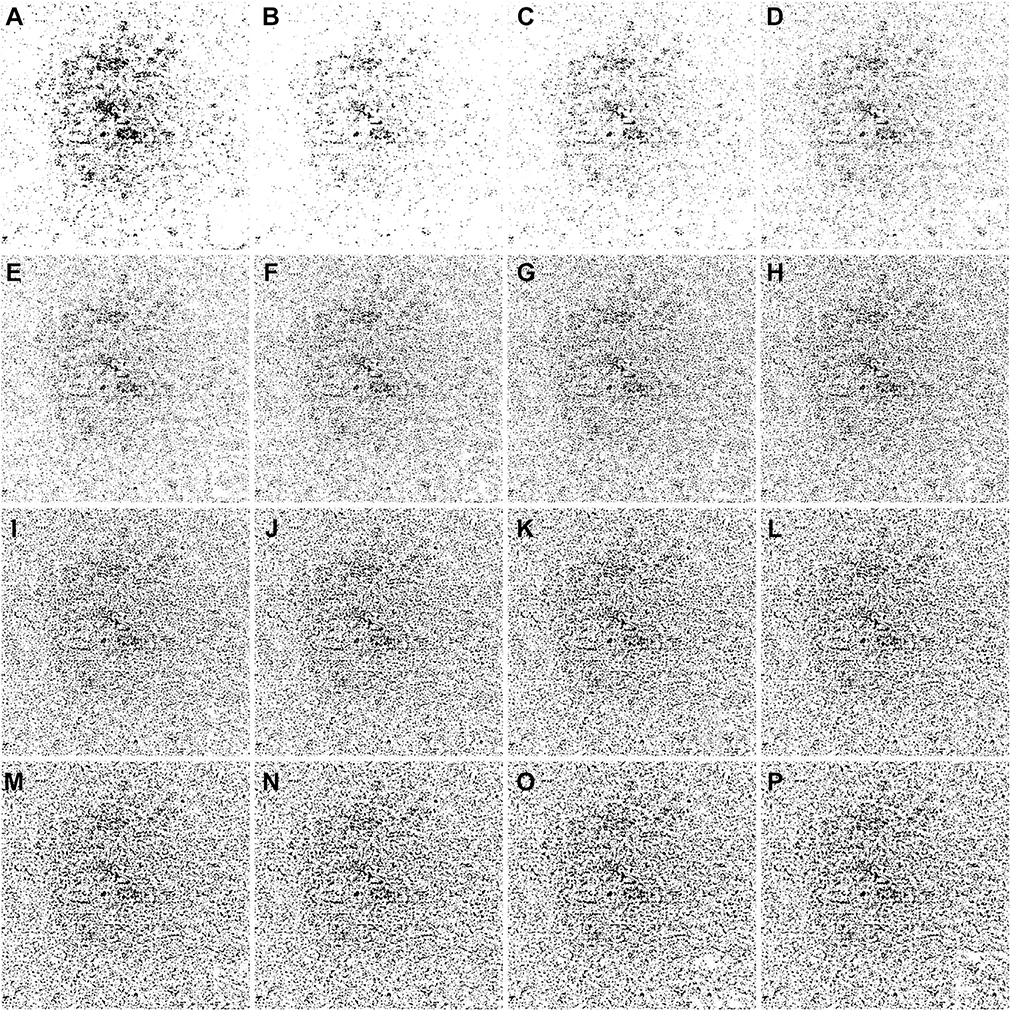
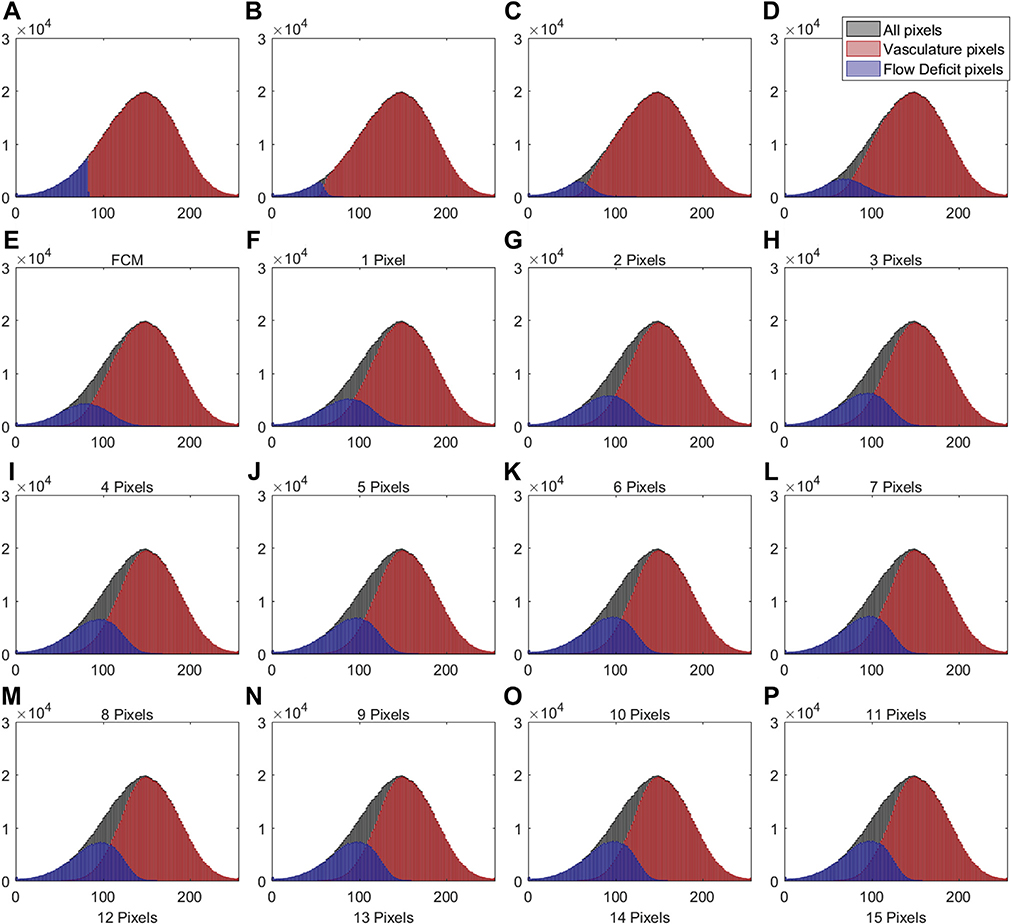
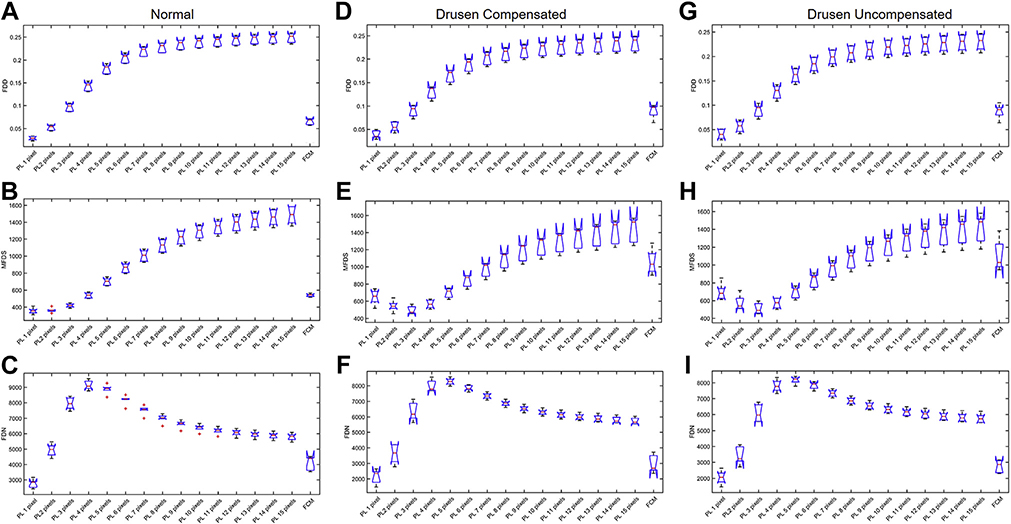
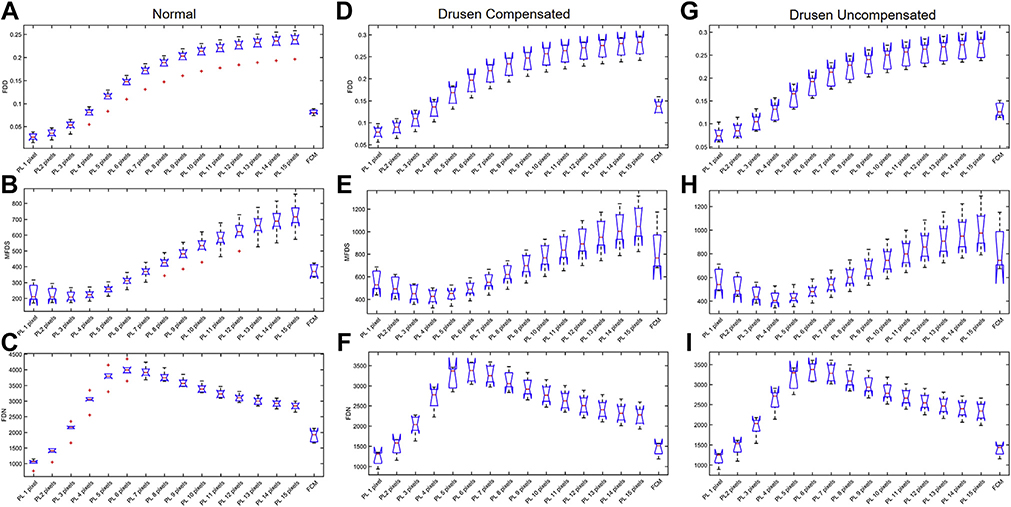
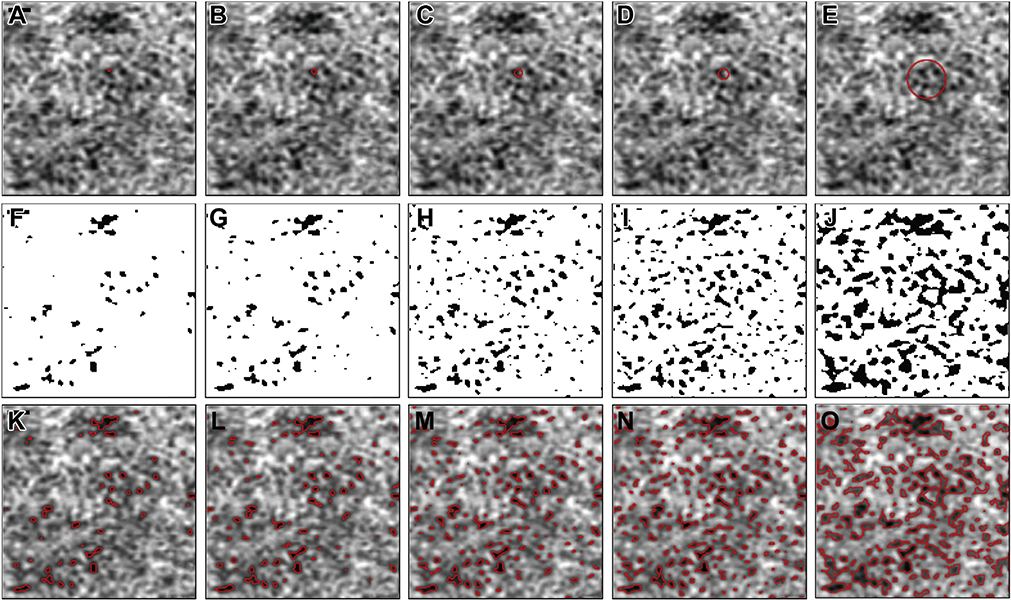
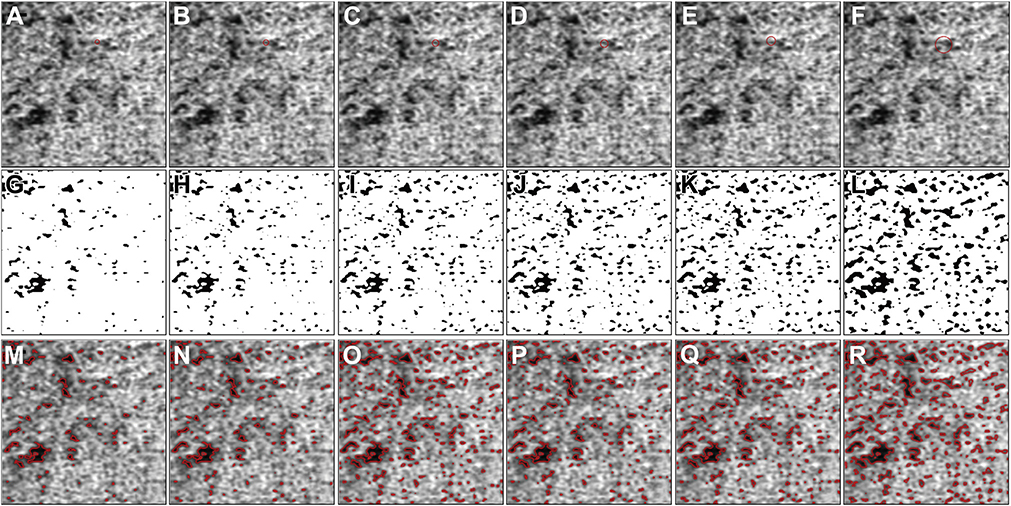
Methods: Swept source OCTA imaging was performed using 3×3 mm and 6×6 mm scanning patterns. The CC slab was extracted after semiautomatic segmentation of the retinal pigment epithelium/Bruch membrane complex. Retinal projection artifacts were removed before further analysis, and CC OCTA images from drusen eyes were compensated using a previously published strategy. CC flow deficits (FDs) were segmented with 2 previously published algorithms: the fuzzy C-means approach (FCM method) and the Phansalkar method. With the Phansalkar method, different parameters were tested and a local window radius of 1 to 15 pixels was used. FD density, mean FD size, and FD number were calculated for comparison.

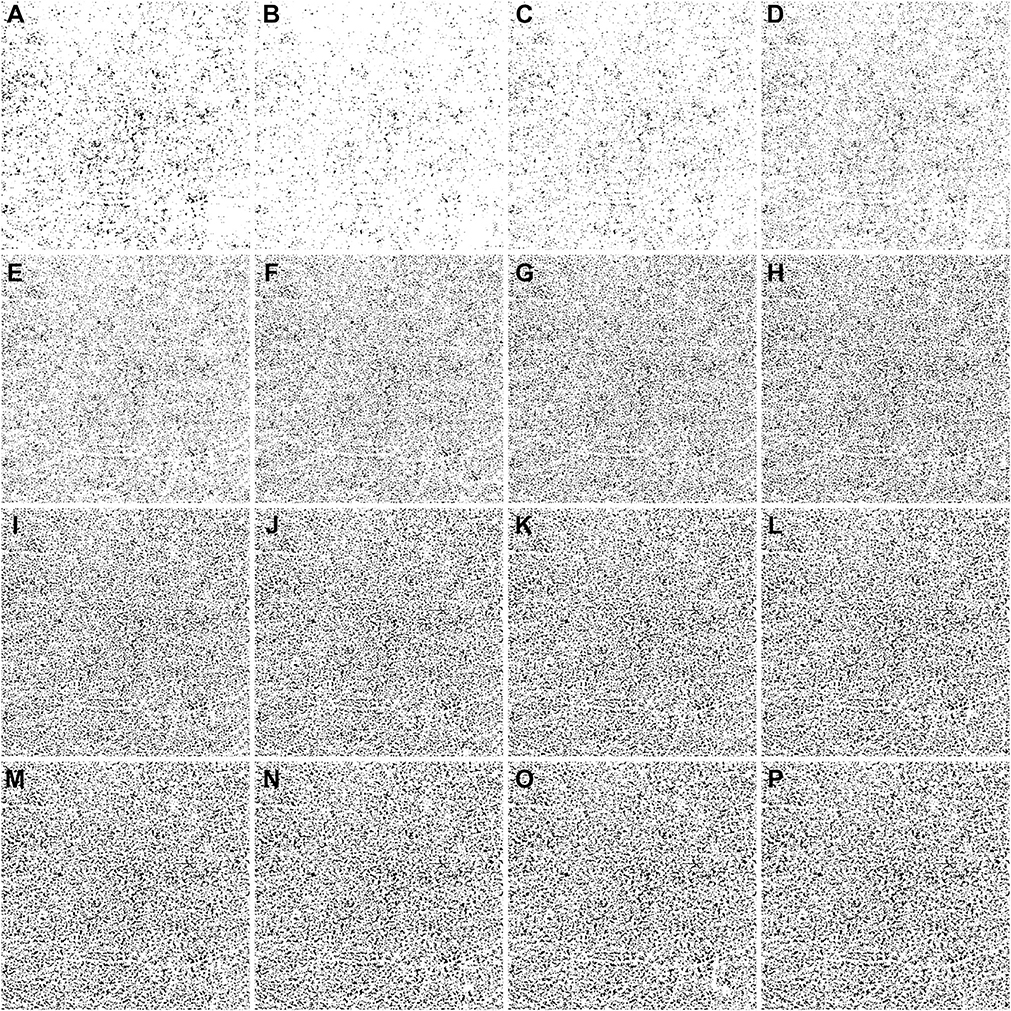
Results: Six normal eyes from 6 subjects and 6 eyes with drusen secondary to age-related macular degeneration from 6 subjects were analyzed. With both 3×3 mm and 6×6 mm scans from all eyes, the FD metrics were highly dependent on the selection of the local window radius when using the Phansalkar method. Larger window radii resulted in higher FD density values. FD number increased with the increase in the window radius but then decreased, with an inflection point at about 1 to 2 intercapillary distances. Mean FD size decreased then increased with increasing window radii.

Conclusions: Multiple parameters, especially the local window radius, should be optimized before using the Phansalkar method for the quantification of CC FDs with OCTA imaging. It is recommended that the proper use of the Phansalkar method should include the selection of the window radius that is related to the expected intercapillary distance in normal eyes.


Figures

FIGURE 1.
FIGURE 1.
Example of the Phansalkar local thresholding method (Phansalkar method) applied to a 6×6 mm scan and the corresponding pixel value histogram analysis after binarization. (A) 6×6 mm choriocapillaris (CC) swept source optical coherence tomography angiography (SS-OCTA) image from a normal subject. (B) Calculated threshold image using the Phansalkar method with a radius of 15 pixels. (C) Binarized CC image with white pixels representing the vasculature and black pixels representing the flow deficits (FDs). This image was derived by examining all pixels in part A and determining if their intensities are above or below the threshold image in part B. If the intensity in part A is above the threshold image in part B, then that pixel would represent flow and is represented as white, and if the intensity in part A is below the threshold image in part B, then that pixel would represent a flow deficit and is represented as black. (D) All pixels from part A that are white in part C are shown with their original image intensities from panel A and projection artifacts are represented as black. (E) All pixels from A that are black in part C are shown with their original image intensities from part A and the projection artifacts are represented as black. These pixels representing FDs are not totally black in part A and have a gray appearance with variable intensities. (F) Histograms of all pixels from part A, the vasculature pixels (CC) from part D, and the FD pixels from part E. In part F, the histograms representing all pixels are in black, the histogram representing vasculature pixels is in red, and the histogram representing FD pixels is in blue. The x-axis represents the intensities of the pixels (range from 0 to 255) and the y-axis represents the number of pixels with the given intensity. The projection artifacts are not included when quantifying the vascular and FD pixels, and that is why some of the histograms for all pixels exceeds the combined number of pixels when summing the CC and FD numbers along the y-axis.
FIGURE 2.
FIGURE 2.
Example of applying the compensation strategy when using a 6 × 6 mm image from an eye with drusen. (A) En face swept source optical coherence tomography (SS-OCT) structural image from the same slab used to image the choriocapillaris (CC). Red lines indicate the boundary of the drusen manually identified from the structural SS-OCT en face RPE to RPE fit slab; corresponding B-scans were also used to confirm the drusen-related RPE elevation. Drusen with greatest linear diameter < 125 μm were excluded. (B) The inverted en face CC SS-OCT image from part A that will be used to compensate for signal attenuation in the CC flow image. (C) En face SS-OCT angiography (SS-OCTA) image of the CC layer before compensation. (D) En face SS-OCTA image of the CC layer after compensation. (E) Binarized uncompensated CC image using the fuzzy C-means (FCM) method. (F) Binarized compensated CC image using the FCM method. (G) Binarized uncompensated CC image using the Phansalkar method with a radius of 15 pixels. (H) Binarized compensated CC image using the Phansalkar method with a radius of 15 pixels.
FIGURE 3.
FIGURE 3.
Examples of using the Phansalkar local thresholding method (Phansalkar method) with window radii ranging from 1 to 15 pixels on a 6×6 mm scan from a normal eye. (A) En face choriocapillaris (CC) swept source optical coherence tomography angiography image that has been compensated by using the inverted CC structure slab. (B through P) Each panel represents an increase in the radius of 1 pixel when using the Phansalkar method to threshold the image shown in part A. Part B represents the image derived from using a radius of 1 pixel and part P represents the image derived from using a radius of 15 pixels. The value of each pixel in parts B through P is the threshold for corresponding pixel in part A.
FIGURE 4.
FIGURE 4.
Examples of binarized choriocapillaris (CC) images using different strategies on the same 6×6 mm scan from the normal eye shown in Figure 3. (A) Binarized CC image using the fuzzy C-means method. (B through P) Binarized CC images using the Phansalkar local thresholding method with window radii ranging from 1 to 15 pixels.
FIGURE 5.
FIGURE 5.
Histogram plots of different groups of pixels corresponding to the 6- × 6mm choriocapillaris images shown in Figures 3 and 4. (A) Histogram of different groups of pixels using the fuzzy C-means method. (B through P) Histograms of different groups of pixels using the Phansalkar local thresholding method with window radii ranging from 1 to 15 pixels. As in Figure 1, part F, the black color represents all pixels from the compensated swept source optical coherence tomography angiography choriocapillaris (CC) image, the red color represents the vasculature pixels corresponding to the CC, and the blue color represents the pixels corresponding to the CC flow deficits.
FIGURE 6.
FIGURE 6.
Examples of a 6×6 mm image from an eye with drusen that has been thresholded using the Phansalkar local thresholding method (Phansalkar method) with a range of window radii from 1 through 15 pixels. (A) En face choriocapillaris (CC) swept source optical coherence tomography angiography (SS-OCTA) image that has been compensated by using the CC inverted structural slab. (B through P) Each panel represents an increase in the radius of 1 pixel when using the Phansalkar method to threshold the image shown in part A. Part B represents the threshold image derived from using a radius of 1 pixel and part P represents the threshold image derived from using a radius of 15 pixels. The value of each pixel in parts B through P is the threshold for corresponding pixel in part A.
FIGURE 7.
FIGURE 7.
Examples of binarized choriocapillaris (CC) images using different strategies on the same 6×6 mm scan from an eye with drusen shown in Figure 6. (A) Binarized CC image using the fuzzy C-means method. (B through P) Binarized CC image using the Phansalkar local thresholding method with window radii ranging from 1 to 15 pixels.
FIGURE 8.
FIGURE 8.
Histogram plots of different groups of pixels corresponding to the 6×6 mm choriocapillaris images shown in Figures 6 and 7. (A) Histogram of different groups of pixels using the fuzzy C-means method. (B through P) Histograms of different groups of pixels using the Phansalkar local thresholding method with window radii ranging from 1 to 15 pixels. As in Figure 1, part F, the black color represents all pixels from the compensated swept source optical coherence tomography angiography choriocapillaris (CC) image, the red color represents the vasculature pixels corresponding to the CC, and the blue color represents the pixels corresponding to the CC flow deficits.
FIGURE 9.
FIGURE 9.
Comparison of different choriocapillaris (CC) measurements obtained by using different thresholding techniques on a 6×6 mm scan obtained from normal eyes and eyes with drusen with and without compensation. In each plot, the results from the Phansalkar local thresholding method (PL) using a range of window radii from 1 to 15 pixels are compared with the fuzzy C-means (FCM) method. The box plots correspond to flow deficit densities (FDDs) (A, D, and G), mean flow deficit sizes (MFDSs) (B, E, and H), and flow deficit numbers (FDNs) (C, F, and I) from 6×6 mm scans using different thresholding techniques in normal subjects (A through C), drusen subjects with compensation (D through F), and drusen subjects without compensation (G through I).
FIGURE 10.
FIGURE 10.
Comparison of different choriocapillaris (CC) measurements obtained by using different thresholding techniques on a 3×3 mm scan obtained from normal eyes and eyes with drusen with and without compensation. In each plot, the results from the Phansalkar local thresholding method (PL) using a range of window radii from 1 to 15 pixels are compared with the fuzzy C-means (FCM) method. The box plots correspond to flow deficit densities (FDDs) (A, D, and G), mean flow deficit sizes (MFDSs) (B, E, and H), and flow deficit numbers (FDNs) (C, F, and I) from 6×6 mm scans using different thresholding techniques in normal subjects (A through C), drusen subjects with compensation (D through F), and drusen subjects without compensation (G through I).
FIGURE 11.
FIGURE 11.
The effect of choosing different window radii in the Phansalkar local thresholding method for 6×6 mm choriocapillaris ept source optical coherence tomography angiography (SS-OCTA) images. (A through E) Cropped 6×6 mm CC SS-OCTA images with red circles representing a local window with radii of 1, 2, 3, 4, and 15 pixels, which correspond to circles with 29.30 μm, 41.02 μm, 52.73 μm, and 181.64 μm diameters. (F through J) Corresponding binarized CC images with a local window radius of 1, 2, 3, 4, and 15 pixels, which correspond to circles with 29.30 μm, 41.02 μm, 52.73 μm, and 181.64 μm diameters. (K through O) The overlay of detected CC FDs from panels F and G represented as red lines on the corresponding SS-OCTA CC images from parts A through E. Scale bar = 100 μm.
FIGURE 12.
FIGURE 12.
The effect of choosing different window radii in the Phansalkar local thresholding method for 3×3 mm choriocapillaris (CC) swept source optical coherence tomography angiography (SS-OCTA) images. (A through F) Cropped 3×3 mm CC OCTA image with red circles representing a local window with radii of 4, 5, 6, 7, 8, and 15 pixels, which correspond to circles with 26.37 μm, 32.23 μm, 38.09 μm, 43.95 μm, 49.80 μm, and 90.82 μm diameters. (G through L) Corresponding binarized CC images with a local window radius of 4, 5, 6, 7, 8, and 15 pixels, which correspond to circles with 26.37 μm, 32.23 μm, 38.09 μm, 43.95 μm, 49.80 μm, and 90.82 μm diameters. (M through R) The overlay of detected CC FDs from parts G through K represented as red lines on the corresponding SS-OCTA CC images from parts A through F. Scale bar = 100 μm.

Similar articles

Cited by

References

    1. Bernstein M, Hollenberg M. Fine structure of the choriocapillaris and retinal capillaries. Invest Ophthalmol Vis Sci 1965; 4(6):1016–1025. - PubMed
    1. Schmetterer L, Kiel J, eds. Ocular Blood Flow. New York, NY: Springer Science & Business Media; 2012.
    1. Bhutto I, Lutty G. Understanding age-related macular degeneration (AMD): relationships between the photoreceptor/retinal pigment epithelium/Bruch’s membrane/choriocapillaris complex. Mol Aspects Med 2012;33(4):295–317. - PMC - PubMed
    1. Cao J, McLeod DS, Merges CA, Lutty GA. Choriocapillaris degeneration and related pathologic changes in human diabetic eyes. Arch Ophthalmol 1998;116(5):589–597. - PubMed
    1. Herbort C Posterior uveitis: new insights provided by indocyanine green angiography. Eye (Lond) 1998;12(pt 5): 757–759. - PubMed

Publication types