

Viral and Bacterial Fecal Indicators in Untreated Wastewater across the Contiguous United States Exhibit Geospatial Trends
- PMID: 32060019
- PMCID: PMC7117942
- DOI: 10.1128/AEM.02967-19
Viral and Bacterial Fecal Indicators in Untreated Wastewater across the Contiguous United States Exhibit Geospatial Trends
Abstract
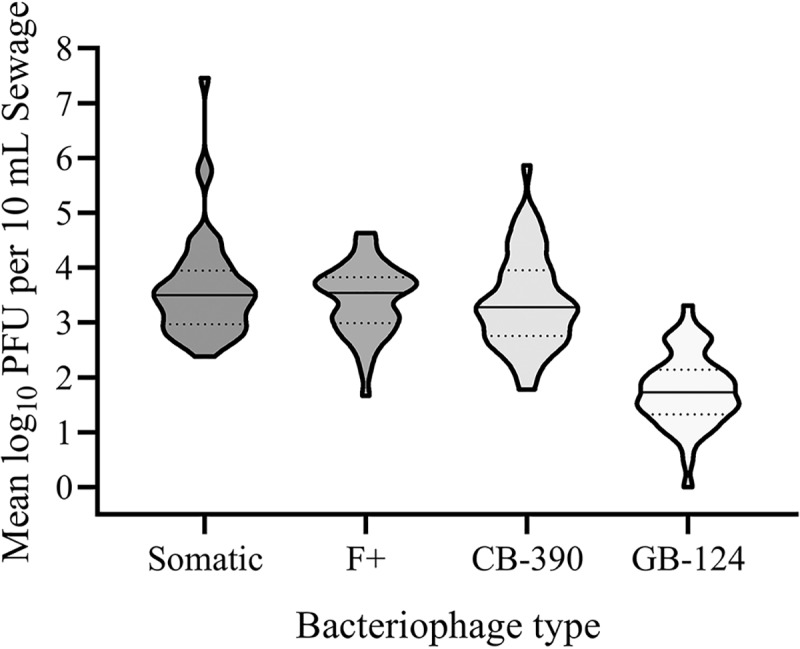
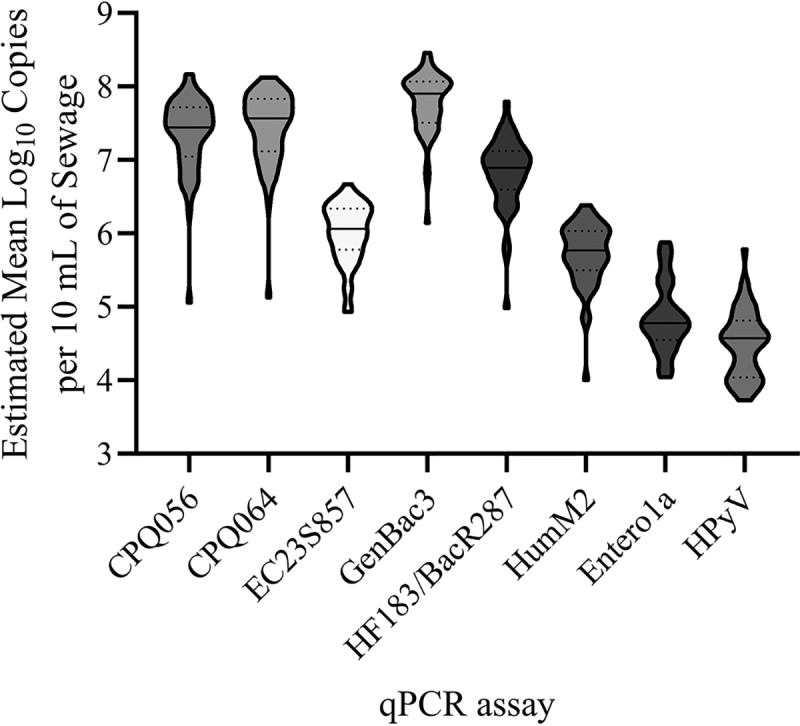
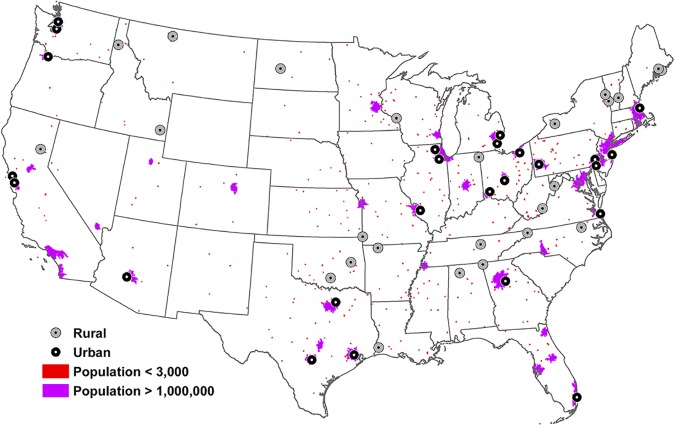
Cultivated fecal indicator bacteria such as Escherichia coli and enterococci are typically used to assess the sanitary quality of recreational waters. However, these indicators suffer from several limitations, such as the length of time needed to obtain results and the fact that they are commensal inhabitants of the gastrointestinal tract of many animals and have fate and transport characteristics dissimilar to pathogenic viruses. Numerous emerging technologies that offer same-day water quality results or pollution source information or that more closely mimic persistence patterns of disease-causing pathogens that may improve water quality management are now available, but data detailing geospatial trends in wastewater across the United States are sparse. We report geospatial trends of cultivated bacteriophage (somatic, F+, and total coliphages and GB-124 phage), as well as genetic markers targeting polyomavirus, enterococci, E. coli, Bacteroidetes, and human-associated Bacteroides spp. (HF183/BacR287 and HumM2) in 49 primary influent sewage samples collected from facilities across the contiguous United States. Samples were selected from rural and urban facilities spanning broad latitude, longitude, elevation, and air temperature gradients by using a geographic information system stratified random site selection procedure. Most indicators in sewage demonstrated a remarkable similarity in concentration regardless of location. However, some exhibited predictable shifts in concentration based on either facility elevation or local air temperature. Geospatial patterns identified in this study, or the absence of such patterns, may have several impacts on the direction of future water quality management research, as well as the selection of alternative metrics to estimate sewage pollution on a national scale.IMPORTANCE This study provides multiple insights to consider for the application of bacterial and viral indicators in sewage to surface water quality monitoring across the contiguous United States, ranging from method selection considerations to future research directions. Systematic testing of a large collection of sewage samples confirmed that crAssphage genetic markers occur at a higher average concentration than key human-associated Bacteroides spp. on a national scale. Geospatial testing also suggested that some methods may be more suitable than others for widespread implementation. Nationwide characterization of indicator geospatial trends in untreated sewage represents an important step toward the validation of these newer methods for future water quality monitoring applications. In addition, the large paired-measurement data set reported here affords the opportunity to conduct a range of secondary analyses, such as the generation of new or updated quantitative microbial risk assessment models used to estimate public health risk.
Keywords: bacteriophage; general fecal indicators; geospatial; microbial source tracking; sewage; wastewater.
This is a work of the U.S. Government and is not subject to copyright protection in the United States. Foreign copyrights may apply.
Figures
References
-
- Hendriksen RS, Global Sewage Surveillance Project Consortium, Munk P, Njage P, van Bunnik B, McNally L, Lukjancenko O, Röder T, Nieuwenhuijse D, Pedersen SK, Kjeldgaard J, Kaas RS, Clausen PTLC, Vogt JK, Leekitcharoenphon P, van de Schans MGM, Zuidema T, de Roda Husman AM, Rasmussen S, Petersen B, Amid C, Cochrane G, Sicheritz-Ponten T, Schmitt H, Alvarez JRM, Aidara-Kane A, Pamp SJ, Lund O, Hald T, Woolhouse M, Koopmans MP, Vigre H, Petersen TN, Aarestrup FM. 2019. Global monitoring of antimicrobial resistance based on metagenomic analyses of urban sewage. Nat Commun 10:1124. doi:10.1038/s41467-019-08853-3. - DOI - PMC - PubMed
-
- U.S. EPA. 2004. Report to Congress: impacts and control of CSOs and SSOs. EPA 833-R-04-001 U.S. EPA, Washington, DC.
-
- American Society of Civil Engineers. 2017. Report card for America’s infrastructure. ASCE, Reston, VA: https://www.infrastructurereportcard.org/. Accessed September 2019.
Publication types
MeSH terms
Substances
LinkOut - more resources
Full Text Sources
Medical
Molecular Biology Databases
Miscellaneous
