. 2020 May 7;55(5):1900110.
doi: 10.1183/13993003.00110-2019. Print 2020 May.

Eosinophils, basophils and type 2 immune microenvironments in COPD-affected lung tissue

Affiliations

Eosinophils, basophils and type 2 immune microenvironments in COPD-affected lung tissue

Prajakta Jogdand et al. Eur Respir J. .

Abstract

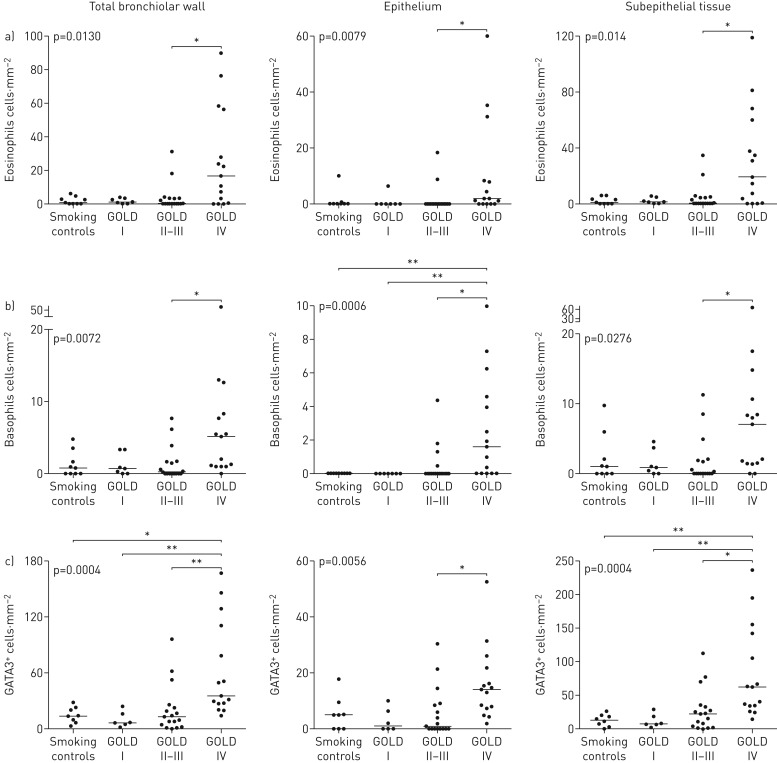
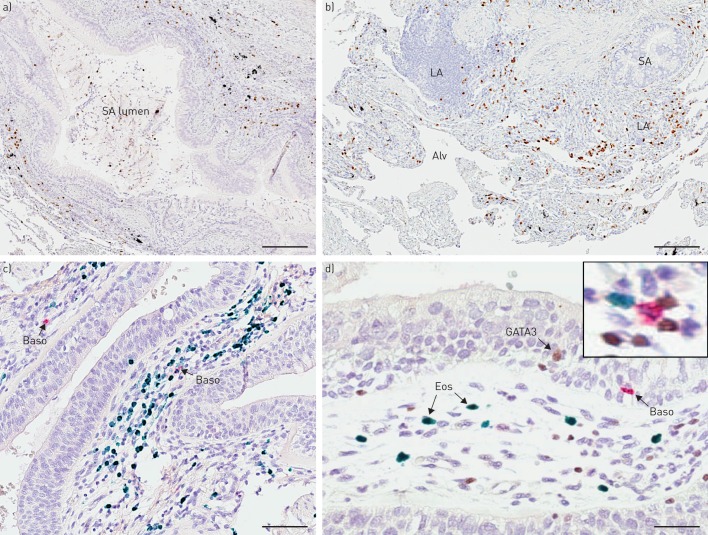
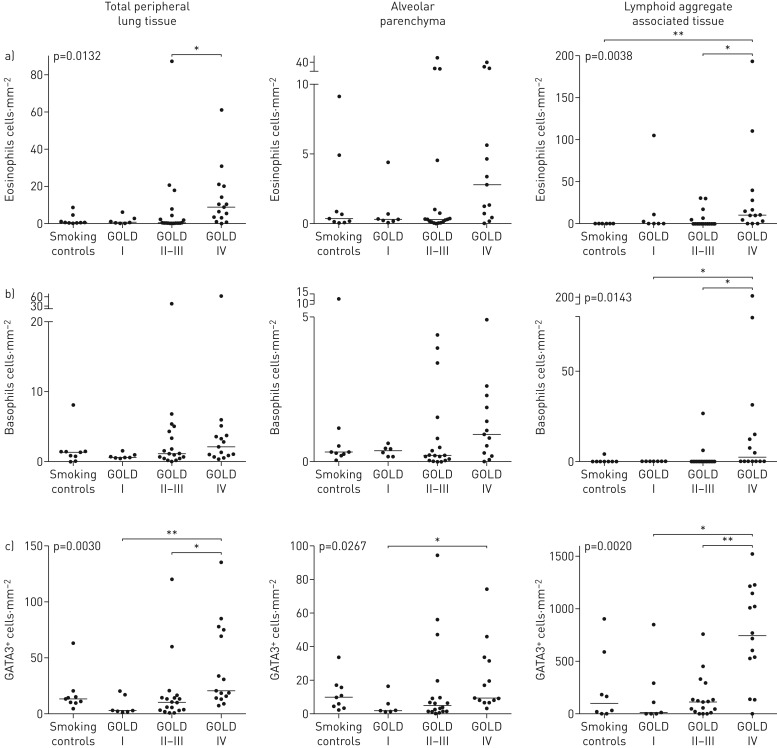
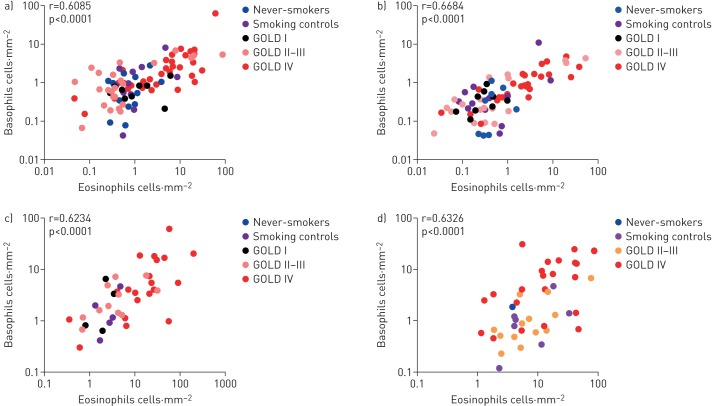
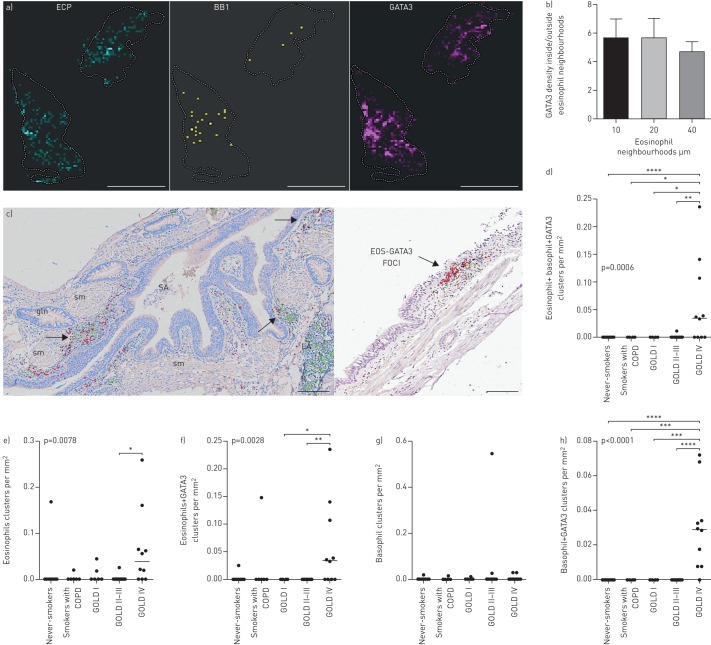
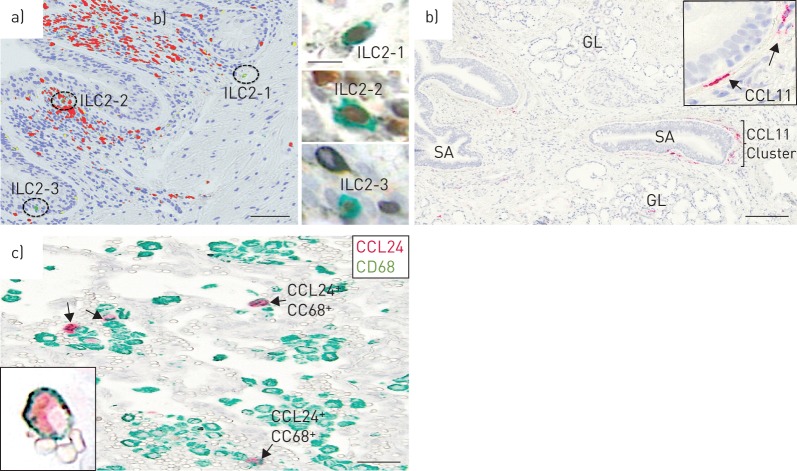
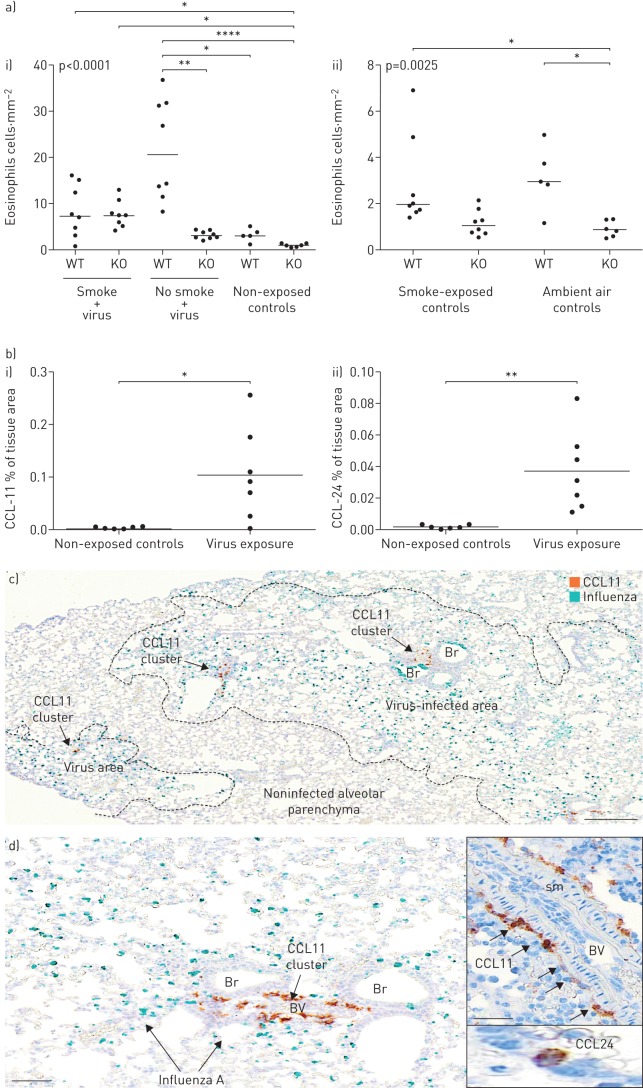
Although elevated blood or sputum eosinophils are present in many patients with COPD, uncertainties remain regarding the anatomical distribution pattern of lung-infiltrating eosinophils. Basophils have remained virtually unexplored in COPD. This study mapped tissue-infiltrating eosinophils, basophils and eosinophil-promoting immune mechanisms in COPD-affected lungs.Surgical lung tissue and biopsies from major anatomical compartments were obtained from COPD patients with severity grades Global Initiative for Chronic Obstructive Lung Disease stages I-IV; never-smokers/smokers served as controls. Automated immunohistochemistry and in situ hybridisation identified immune cells, the type 2 immunity marker GATA3 and eotaxins (CCL11, CCL24).Eosinophils and basophils were present in all anatomical compartments of COPD-affected lungs and increased significantly in very severe COPD. The eosinophilia was strikingly patchy, and focal eosinophil-rich microenvironments were spatially linked with GATA3+ cells, including type 2 helper T-cell lymphocytes and type 2 innate lymphoid cells. A similarly localised and interleukin-33/ST2-dependent eosinophilia was demonstrated in influenza-infected mice. Both mice and patients displayed spatially confined eotaxin signatures with CCL11+ fibroblasts and CCL24+ macrophages.In addition to identifying tissue basophilia as a novel feature of advanced COPD, the identification of spatially confined eosinophil-rich type 2 microenvironments represents a novel type of heterogeneity in the immunopathology of COPD that is likely to have implications for personalised treatment.


Conflict of interest statement

Conflict of interest: P. Jogdand has nothing to disclose. Conflict of interest: P. Siddhuraj has nothing to disclose. Conflict of interest: M. Mori has nothing to disclose. Conflict of interest: C. Sanden has nothing to disclose. Conflict of interest: J. Jönsson has nothing to disclose. Conflict of interest: A.F. Walls has nothing to disclose. Conflict of interest: J. Kearley is an employee of AstraZeneca (formerly MedImmune LLC) and has stock options in AstraZeneca. Conflict of interest: A.A. Humbles was an employee of AstraZeneca (formerly MedImmune LLC) at the time these analyses were conducted. Conflict of interest: R. Kolbeck was an employee of AstraZeneca (formerly MedImmune LLC) at the time these analyses were conducted. Conflict of interest: L. Bjermer has nothing to disclose. Conflict of interest: P. Newbold is an employee of AstraZeneca (formerly MedImmune LLC) and has stock options in AstraZeneca. Conflict of interest: J.S. Erjefält is founder (and stock owner) of Medetect AB, who received funding from AstraZeneca for conducting parts of the present study.

Figures

FIGURE 1
FIGURE 1
Scattergrams showing densities of tissue-infiltrating a) eosinophils and b) basophils and c) the surrogate type 2 immune marker GATA3 in the total wall, epithelial and subepithelial compartments of bronchioles (small airways) in patients with Global Initiative for Chronic Obstructive Lung Disease (GOLD) I–IV COPD and matching controls. Data are presented as patient mean densities and group median values. p-values quoted in the figure represent overall statistical difference between patients with COPD and controls, as determined by a nonparametric Kruskal–Wallis one-way ANOVA with Dunn's multiple comparison post hoc test (mean rank of each subgroup is compared to every other subgroup). *: p<0.05, **: p<0.01.
FIGURE 2
FIGURE 2
Bright-field micrographs exemplifying eosinophil, basophil and GATA3 staining in patients with COPD representative of an eosinophil-high profile. a and b) Single eosinophil staining (brown EG2 immunoreactivity); c) double immunohistochemistry (IHC) lung section stained for basophils (red, alkaline phosphatase) and eosinophils (vina green). d) Triple IHC staining for eosinophils (vina green), basophils (red, alkaline phosphatase) and GATA3 (brown diaminobenzidine; inset in d exemplifies greater magnification of triple-stained section and brown GATA3+ cells amid green EG2+ eosinophils and a red BB1+ basophil). Arrows indicate positive cells. SA: small airway; LA: lymphoid aggregate; Alv: alveolar parenchyma; Baso: basophil; Eos: eosinophil. Scale bars a) 100 μm, b) 120 μm, c) 85 μm, d) 50 μm.
FIGURE 3
FIGURE 3
Scattergrams of densities of tissue-infiltrating a) eosinophils and b) basophils and c) the surrogate type 2 helper T-cell marker GATA3 in distal lung compartments, here divided into total peripheral lung tissue (i.e. lung tissue in which any large conducting airways and large pulmonary vessels have been excluded), alveolar parenchyma (with small airways and large to mid-sized vessels and lymphoid tissue excluded) and lymphoid-associated tissue. Data are presented as patient mean densities and group median values. p-values represent overall statistical difference between patients with COPD and controls, as determined by a nonparametric Kruskal–Wallis one-way ANOVA with Dunn's multiple comparison post hoc test (mean rank of each subgroup is compared to every other subgroup). GOLD: Global Initiative for Chronic Obstructive Lung Disease. *: p<0.05, **: p<0.01.
FIGURE 4
FIGURE 4
Scattergrams showing correlations between eosinophils and basophils in lung compartments a) peripheral tissue; b) alveolar parenchyma; c) small airways; d) bronchi. Data are presented as mean values in individual tissue blocks (i.e. blocks representing distinct and spatially separated anatomical regions within each analysed type of lung compartment). Values were log-transformed to yield better visualisation of the correlation (as a result sections with zero values for any of the cell type are omitted). Whereas a–c represent surgical cases from the main study, d represents pooled mean values from surgical Global Initiative for Chronic Obstructive Lung Disease (GOLD) stage IV COPD samples and endobronchial biopsies from GOLD I–II patients collected to yield mRNA-preserved tissue samples for chemokine mRNA visualisation by in situ hybridisation. Spearman rank correlation test was used to determine the degree of correlation.
FIGURE 5
FIGURE 5
Heterogeneous spatial distribution and presence of distinct eosinophil-rich type 2 skewed microenvironments in COPD lungs. a) Spatially linked heat maps exemplifying a gross codistribution of EG2+ eosinophils, BB1+ basophils and GATA3 and depicting individual 300×300 μm microenvironments colour-coded for cell density (black–bright represents low–high density). b) Spatial statistics analysis (see supplementary figure E1 and text for methodology details) shows the quotient of GATA3 densities inside eosinophil neighbourhoods over GATA3 densities outside eosinophil neighbourhoods. Data are shown for three levels of computer-created circular eosinophil neighbourhoods/microenvironments, defined by a radius of 10, 20 and 40 μm around individual eosinophils. c) Distinct spatial foci of eosinophils (pseudo-colour-coded red after computerised image analysis) and GATA3 (green). The clustering of eosinophils was also confirmed by point pattern statistics, nearest neighbour's distance analysis, and Ripley's K point pattern analysis (supplementary material). d–h) Quantitative data on tissue density of eosinophil clusters and/or basophil clusters, with and without content of any GATA3 cells. Data are presented as patient mean clusters per mm2 lung tissue and group median values. p-values represent overall statistical difference between patients with COPD and controls, as determined by a nonparametric Kruskal–Wallis one-way ANOVA with Dunn's multiple comparison post hoc test (mean rank of each subgroup is compared to every other subgroup). EOS: eosinophils; gln: subepithelial gland; LA: lymphoid aggregate; SA: small airway; sm: smooth muscle. Scale bars a) 1 cm, b) 150 μm, c) 250 μm. *: p<0.05, **: p<0.01, ***: p<0.001.
FIGURE 6
FIGURE 6
a) Example of bronchiolar eosinophil (red) foci and presence of lineage-negative GATA3+CD25+ type 2 innate lymphoid cells (ILC2) in a Global Initiative for Chronic Obstructive Lung Disease (GOLD) IV patient (green; cell nuclei in blue). Inserts depict the original micrographs of the same ILC2s (GATA3 brown; CD25 green). b) Bright-field images exemplifying focal distribution of CCL-11 (eotaxin 1) mRNA expression. CCL-11 mRNA was detected using in situ hybridisation and visualised by permanent red substrate chromogen. The low-power overview illustrates patchy clustering of CCL-11+ cells, whereas greater magnification (inset in b) reveals the elongated fibroblast-like morphology of the CCL-11+ cells. c) Example of CD68-negative CCL11+ (green only) cells and CD68+ CCL24+ (red and green) cells in a COPD-affected lung. GL: subepithelial mucus glands; SA: small airway (i.e. bronchioles). Scale bars a) 100 μm (inset 10 μm), b) 200 μm, c) 50 μm.
FIGURE 7
FIGURE 7
An influenza viral infection triggers a patchy eosinophilia and a highly localised induction of pro-eosinophilic chemokines. a) Infection-induced eosinophilia. Data are presented for wild-type (WT) and interleukin (IL)-33 knockout (KO) mice i) at 6 days post-influenza A infection with and without 11 days of daily tobacco smoke exposure; ii) noninfected baseline counts (no virus) of eosinophils in ambient air and tobacco smoke-exposed controls. Data are presented for WT and IL-33 KO mice. b) Mean measurements of lung tissue i) CCL11 and ii) CCL24 immunoreactivity in control and virus-infected WT mice at 6 days post-infection. c and d) Spatially localised presence of CCL11 in mouse lungs at 6 days post-infection. Example of typical and highly localised CCL11 clusters (brown) in virus-infected areas (virus is stained by vina green chromogen). Note the distinct CCL11 localisation around bronchial- and bronchiole-associated pulmonary blood vessels (BV). Inset in d exemplifies perivascular CCL11+ cells as well as a typical solitary CCL24+ alveolar cell. Br: bronchi; sm: smooth muscle. Scale bars c) 200 μm, d) 100 μm (inset 50 μm).

References

    1. Rabe KF, Hurd S, Anzueto A, et al. . Global strategy for the diagnosis, management, and prevention of chronic obstructive pulmonary disease: GOLD executive summary. Am J Respir Crit Care Med 2007; 176: 532–555. doi:10.1164/rccm.200703-456SO - DOI - PubMed
    1. Hogg JC, Timens W. The pathology of chronic obstructive pulmonary disease. Annu Rev Pathol 2009; 4: 435–459. doi:10.1146/annurev.pathol.4.110807.092145 - DOI - PubMed
    1. Barnes PJ. Immunology of asthma and chronic obstructive pulmonary disease. Nat Rev Immunol 2008; 8: 183–192. doi:10.1038/nri2254 - DOI - PubMed
    1. Mori M, Andersson CK, Svedberg KA, et al. . Appearance of remodelled and dendritic cell-rich alveolar-lymphoid interfaces provides a structural basis for increased alveolar antigen uptake in chronic obstructive pulmonary disease. Thorax 2013; 68: 521–531. doi:10.1136/thoraxjnl-2012-202879 - DOI - PubMed
    1. Hogg JC, Chu F, Utokaparch S, et al. . The nature of small-airway obstruction in chronic obstructive pulmonary disease. N Engl J Med 2004; 350: 2645–2653. doi:10.1056/NEJMoa032158 - DOI - PubMed

Publication types