. 2020 Jun 1;26(11):2640-2653.
doi: 10.1158/1078-0432.CCR-19-3231. Epub 2020 Feb 14.

Single-Cell Genomic Characterization Reveals the Cellular Reprogramming of the Gastric Tumor Microenvironment

Affiliations

Single-Cell Genomic Characterization Reveals the Cellular Reprogramming of the Gastric Tumor Microenvironment

Anuja Sathe et al. Clin Cancer Res. .

Abstract

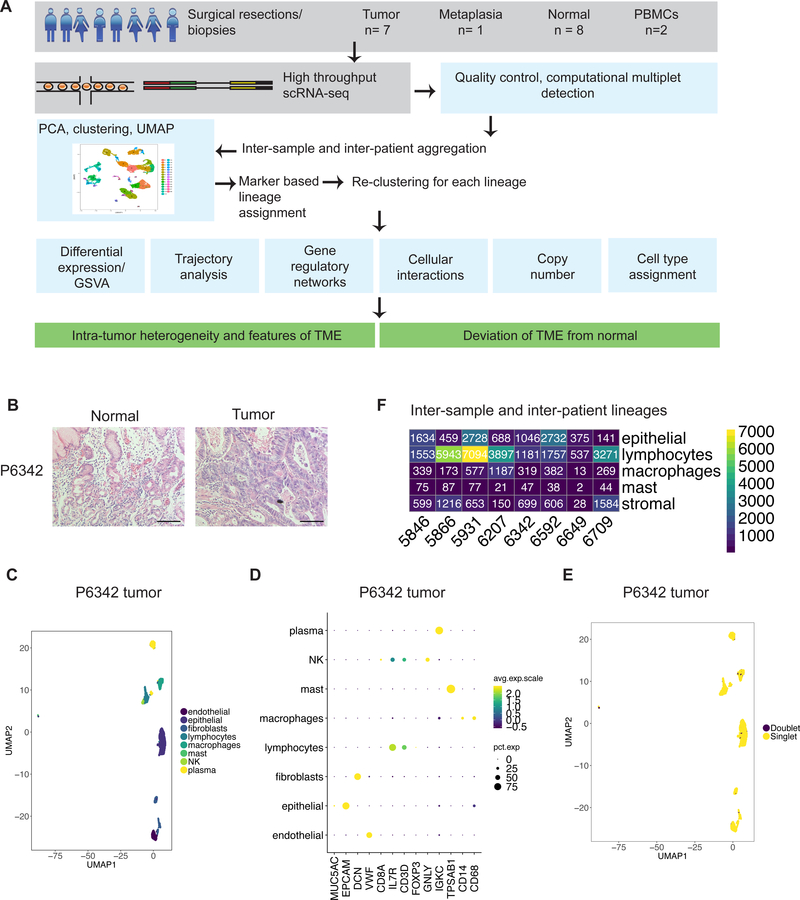
Purpose: The tumor microenvironment (TME) consists of a heterogenous cellular milieu that can influence cancer cell behavior. Its characteristics have an impact on treatments such as immunotherapy. These features can be revealed with single-cell RNA sequencing (scRNA-seq). We hypothesized that scRNA-seq analysis of gastric cancer together with paired normal tissue and peripheral blood mononuclear cells (PBMC) would identify critical elements of cellular deregulation not apparent with other approaches.

Experimental design: scRNA-seq was conducted on seven patients with gastric cancer and one patient with intestinal metaplasia. We sequenced 56,167 cells comprising gastric cancer (32,407 cells), paired normal tissue (18,657 cells), and PBMCs (5,103 cells). Protein expression was validated by multiplex immunofluorescence.

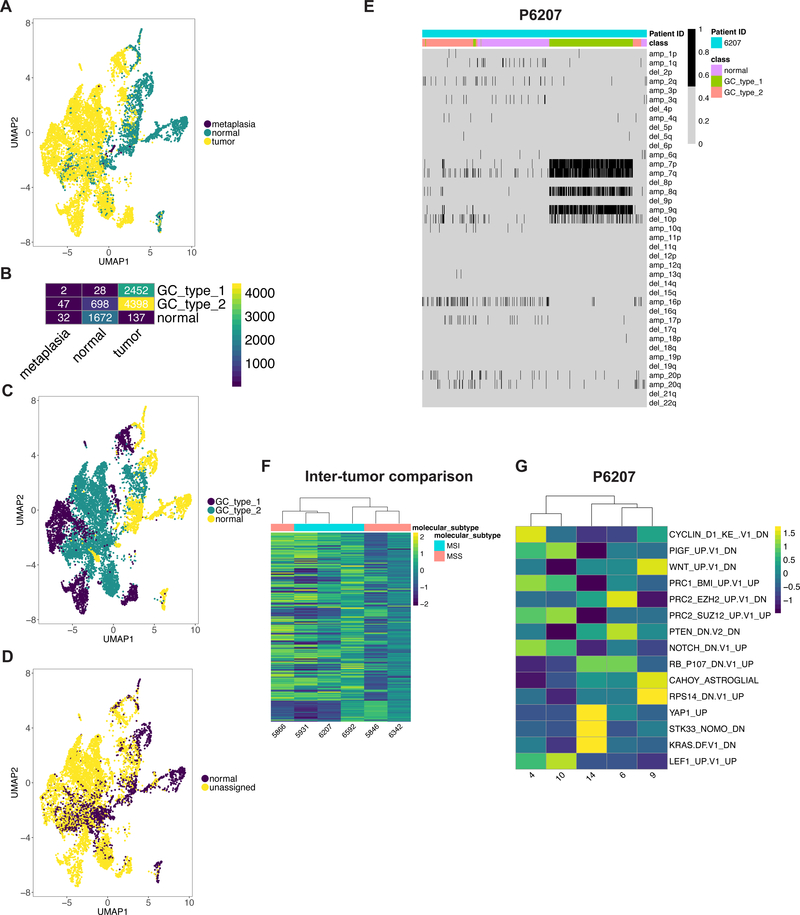
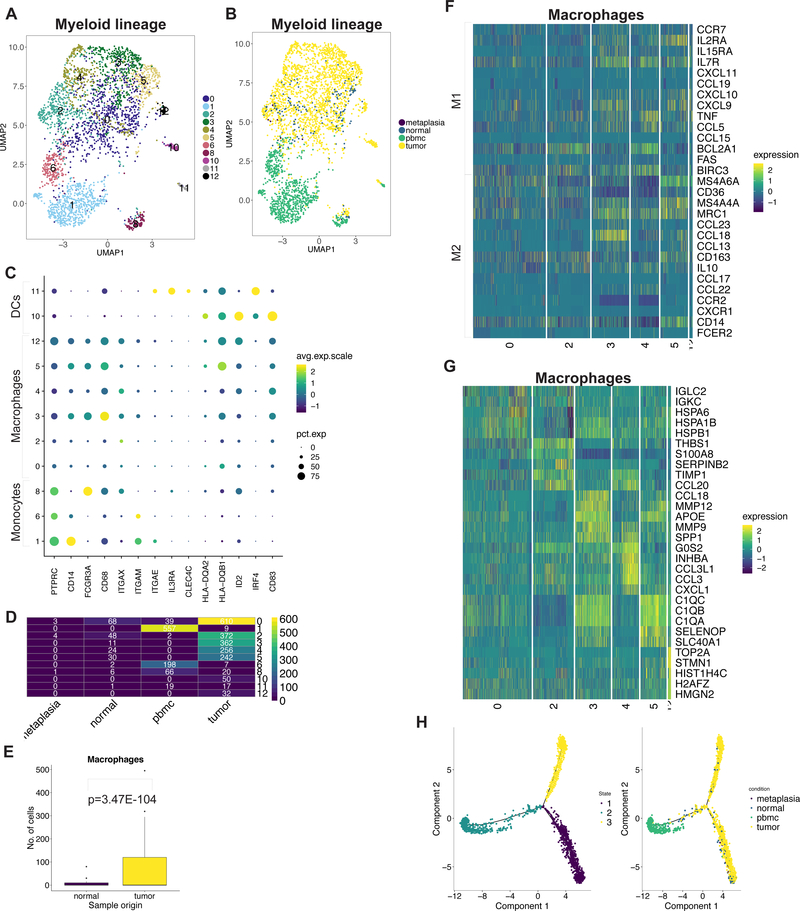
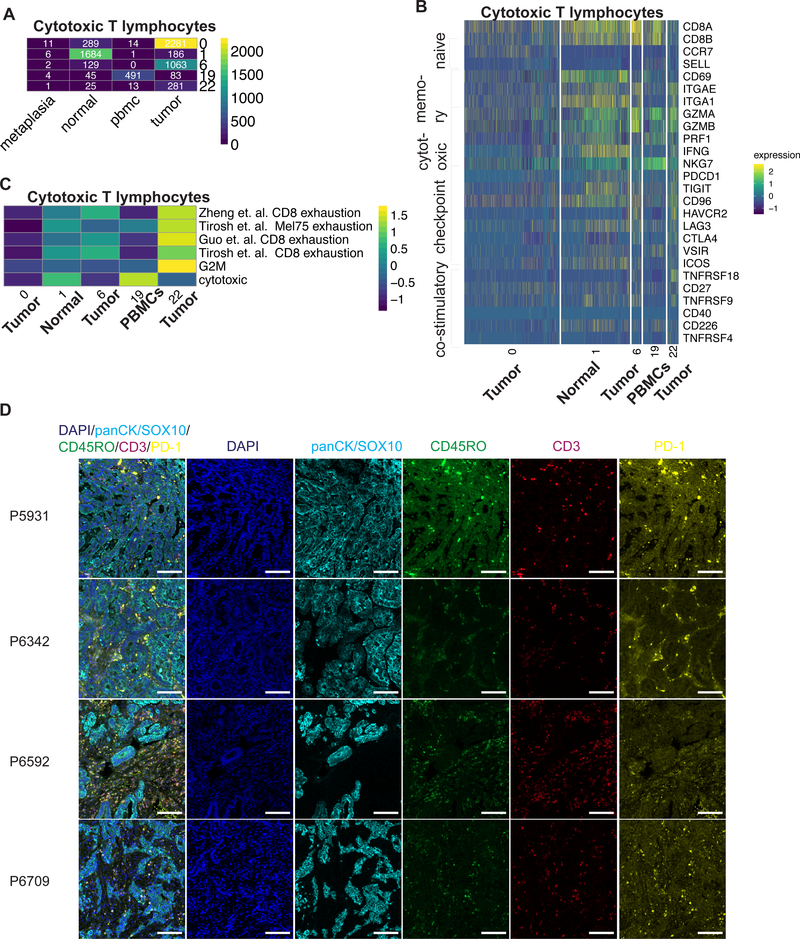
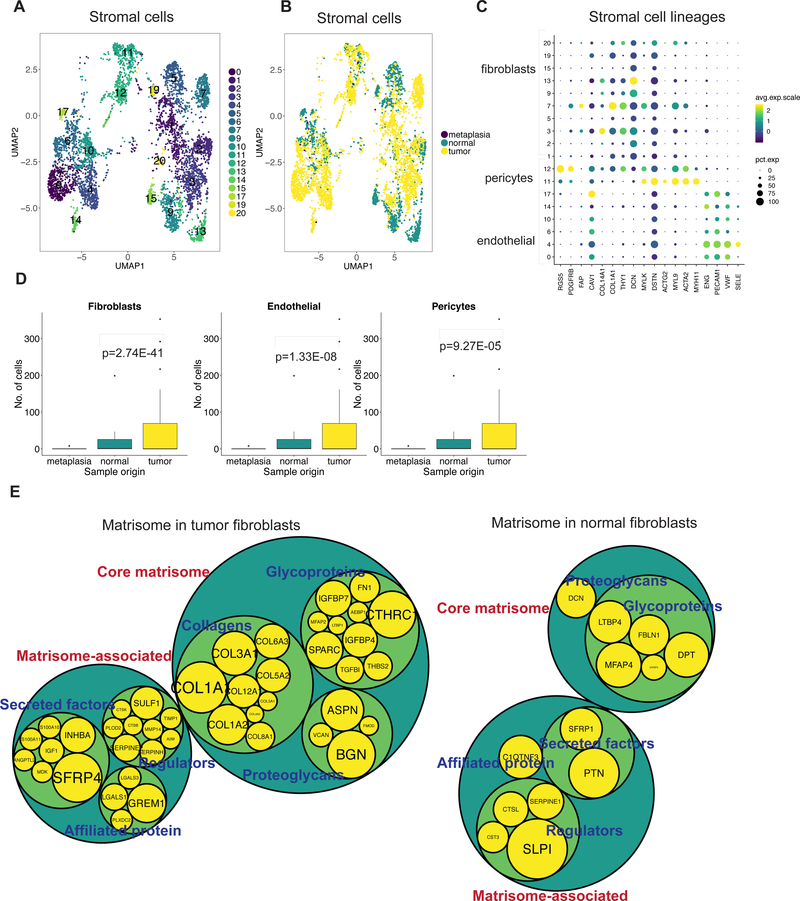
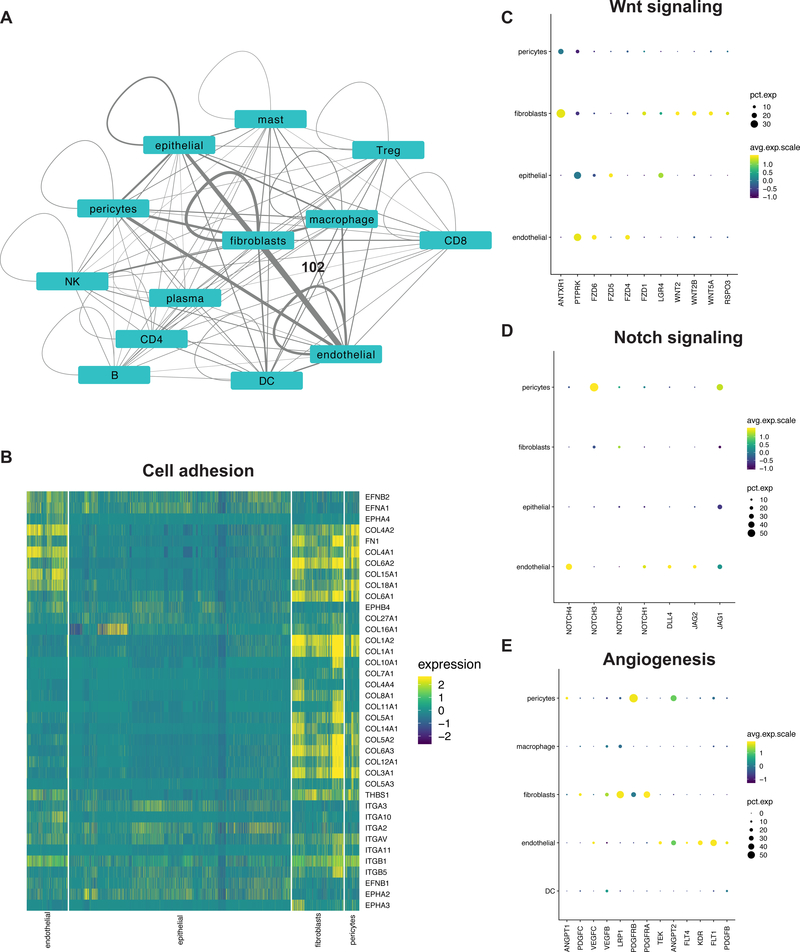
Results: Tumor epithelium had copy number alterations, a distinct gene expression program from normal, with intratumor heterogeneity. Gastric cancer TME was significantly enriched for stromal cells, macrophages, dendritic cells (DC), and Tregs. TME-exclusive stromal cells expressed distinct extracellular matrix components than normal. Macrophages were transcriptionally heterogenous and did not conform to a binary M1/M2 paradigm. Tumor DCs had a unique gene expression program compared to PBMC DCs. TME-specific cytotoxic T cells were exhausted with two heterogenous subsets. Helper, cytotoxic T, Treg, and NK cells expressed multiple immune checkpoint or co-stimulatory molecules. Receptor-ligand analysis revealed TME-exclusive intercellular communication.

Conclusions: Single-cell gene expression studies revealed widespread reprogramming across multiple cellular elements in the gastric cancer TME. Cellular remodeling was delineated by changes in cell numbers, transcriptional states, and intercellular interactions. This characterization facilitates understanding of tumor biology and enables identification of novel targets including for immunotherapy.


Conflict of interest statement

Conflict of interest statement: The authors declare no potential conflicts of interest.

Figures

Figure 1:
Figure 1:
(A) Schematic representation of experimental design and analytical methods used in this study. (B) Representative images of hematoxylin and eosin staining of FFPE tissue from P6342. Scale bar indicates 50 μm. (C-F) Example of clustering analysis in tumor sample of P6342. (C) UMAP representation of dimensionally reduced data following graph-based clustering with marker-based cell type assignments. (D) Dot plot depicting expression levels of specific lineage-based marker genes together with the percentage of cells expressing the marker. (E) UMAP representation of dimensionally reduced data following graph-based clustering with computational doublet identification. (F) Heatmap depicting number of cells identified in aggregated analysis for each lineage per patient.
Figure 2:
Figure 2:
(A) UMAP representation of epithelial cells following graph-based clustering colored by sample origin. (B) Heatmap depicting number of cells per defined epithelial class according the sample origin. (C-D) UMAP representation of epithelial cells following graph-based clustering colored by (C) class (D) predicted class according to scPred. (E) Heatmap representation of statistically significant copy number changes for depicted chromosomes for epithelial cells from P6207 as a representative example. ‘amp’ denotes amplification, ‘del’ denotes deletion. (F-G) Heatmaps depicting average gene set activity of top MSigDB oncogenic c6 gene signatures following GSVA (ANOVA FDR p value < 0.05) across tumor epithelial clusters for (F) all patients and (G) all clusters for P6207.
Figure 3:
Figure 3:
(A) UMAP representation of macrophage cells following graph-based clustering with arbitrary cluster numbers. (B) UMAP representation colored according to the sample origin. (C) Dot plot depicting expression levels of specific genes across clusters with marker-based lineage assignments. (D) Heatmap depicting number of cells identified for each cluster according the sample origin. (E) Box plots depicting proportion of macrophages from total cells derived from tumor or normal site with p value derived from two proportions z-test. (F) Heatmap depicting expression of M1/M2 genes from each macrophage cluster. (G) Heatmap depicting top 5 highest significantly expressed genes detected from each macrophage cluster. (H) Trajectory plots of macrophages in normal and tumor tissue with monocytes from PBMCs with cells colored by identified trajectories (left) and sample origin (right).
Figure 4:
Figure 4:
(A) Heatmap depicting number of cytotoxic T cells identified for each cluster according the sample origin. (B) Heatmap depicting expression of respective genes from each cytotoxic T cell cluster. (C) Heatmap representing average GSVA enrichment score for respective exhaustion signature for each cluster. (D) Representative images of fluorescence staining for respective markers and merged image for respective patients. Scale bar indicates 100 μm
Figure 5:
Figure 5:
(A) UMAP representation of stromal cells following graph-based clustering with arbitrary cluster numbers and (B) colored according to the sample origin. (C) Dot plot depicting expression levels of specific genes across clusters with marker-based lineage assignments. (D) Box plots depicting proportion of fibroblasts, pericytes or endothelial cells from total cells derived from tumor, normal or metaplastic site with p value derived from two proportions z-test. (E) Comparison of differentially expressed genes in tumor or normal fibroblasts to the genes of the matrisome program. Size of gene level circles is proportional to the logFC.
Figure 6:
Figure 6:
(A) Network depicting interactions between various cell types in tumors. Each node is a cell type and scaled edges represent the number of statistically significant detected interactions. Scale: fibroblast and endothelial edge = 102 interactions (B) Heatmap and (C-E) dot plots depicting the expression of respective genes in specific cell types.

References

    1. Bray F, Ferlay J, Soerjomataram I, Siegel RL, Torre LA, Jemal A. Global cancer statistics 2018: GLOBOCAN estimates of incidence and mortality worldwide for 36 cancers in 185 countries. CA Cancer J Clin 2018;68(6):394–424 doi 10.3322/caac.21492. - DOI - PubMed
    1. Correa P, Piazuelo MB. The gastric precancerous cascade. J Dig Dis 2012;13(1):2–9 doi 10.1111/j.1751-2980.2011.00550.x. - DOI - PMC - PubMed
    1. Cancer Genome Atlas Research N. Comprehensive molecular characterization of gastric adenocarcinoma. Nature 2014;513(7517):202–9 doi 10.1038/nature13480. - DOI - PMC - PubMed
    1. Cristescu R, Lee J, Nebozhyn M, Kim KM, Ting JC, Wong SS, et al. Molecular analysis of gastric cancer identifies subtypes associated with distinct clinical outcomes. Nat Med 2015;21(5):449–56 doi 10.1038/nm.3850. - DOI - PubMed
    1. Sade-Feldman M, Yizhak K, Bjorgaard SL, Ray JP, de Boer CG, Jenkins RW, et al. Defining T Cell States Associated with Response to Checkpoint Immunotherapy in Melanoma. Cell 2018;175(4):998–1013 e20 doi 10.1016/j.cell.2018.10.038. - DOI - PMC - PubMed

Publication types

MeSH terms

Substances