. 2020 Apr;32(4):1018-1034.
doi: 10.1105/tpc.19.00784. Epub 2020 Feb 14.

GROWTH-REGULATING FACTORS Interact with DELLAs and Regulate Growth in Cold Stress

Affiliations

GROWTH-REGULATING FACTORS Interact with DELLAs and Regulate Growth in Cold Stress

Ourania Lantzouni et al. Plant Cell. 2020 Apr.

Abstract

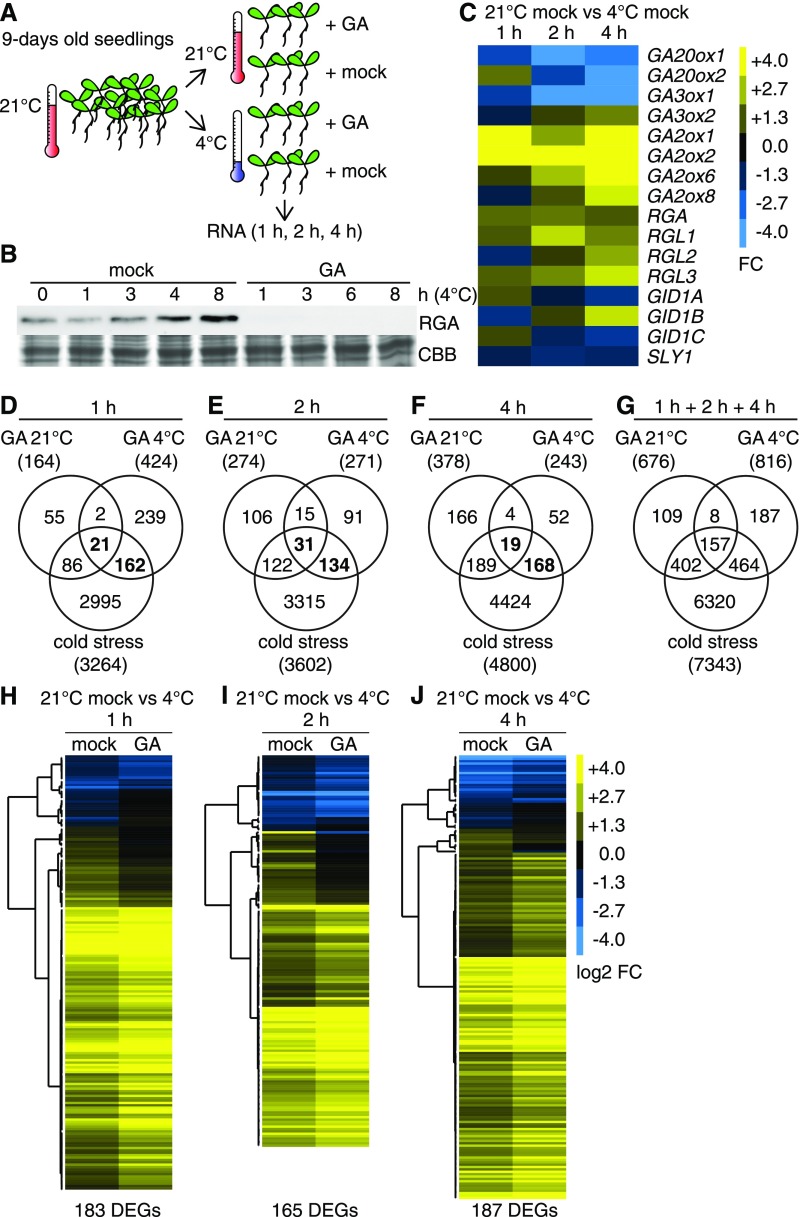
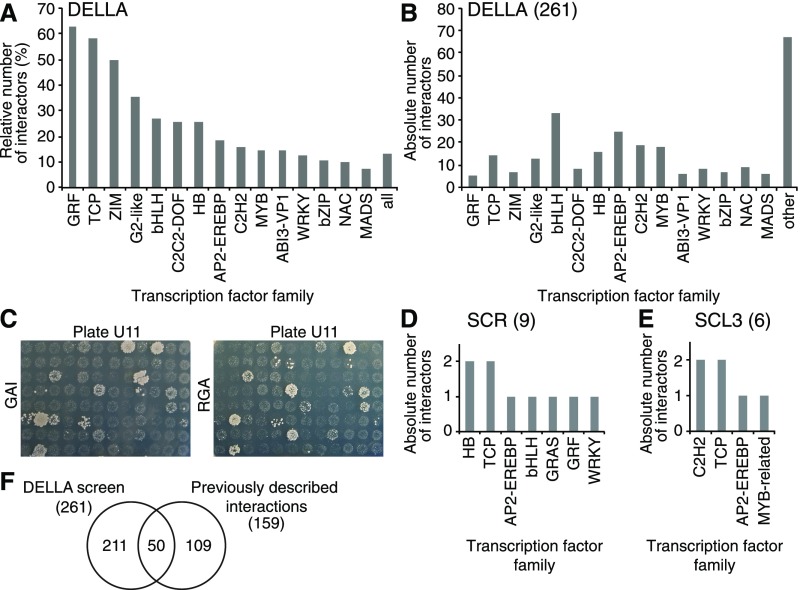
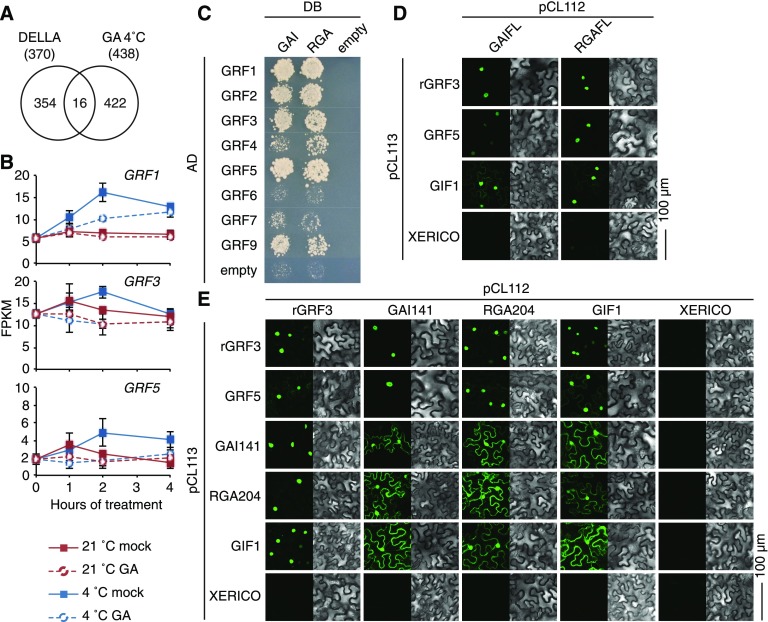
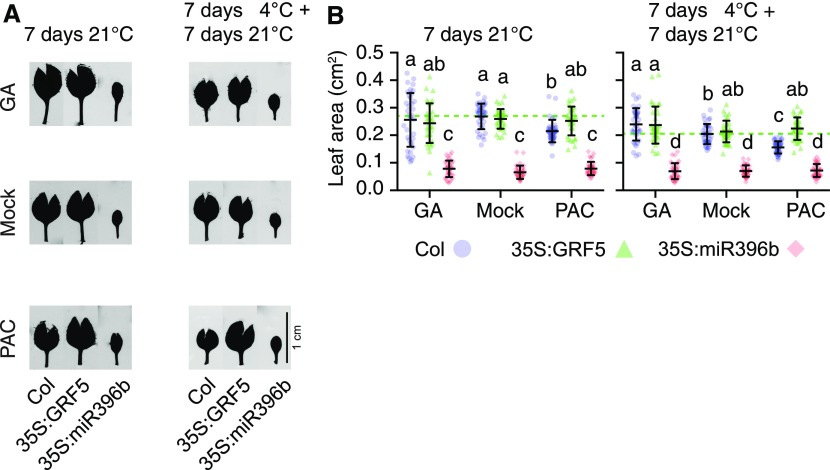
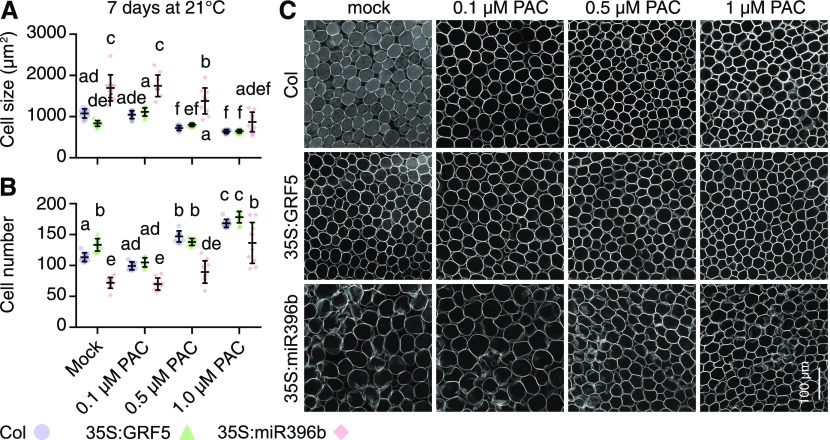
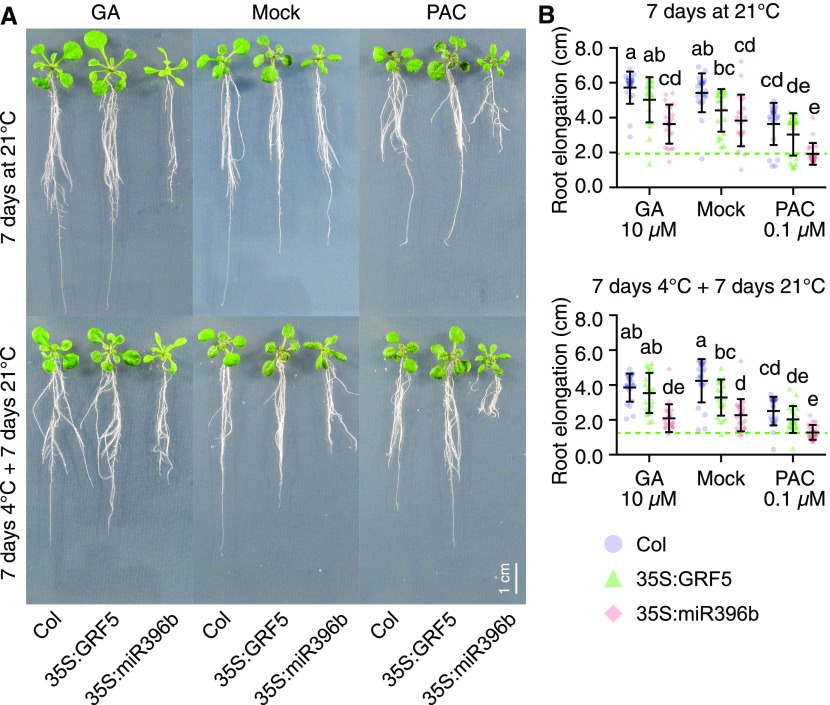
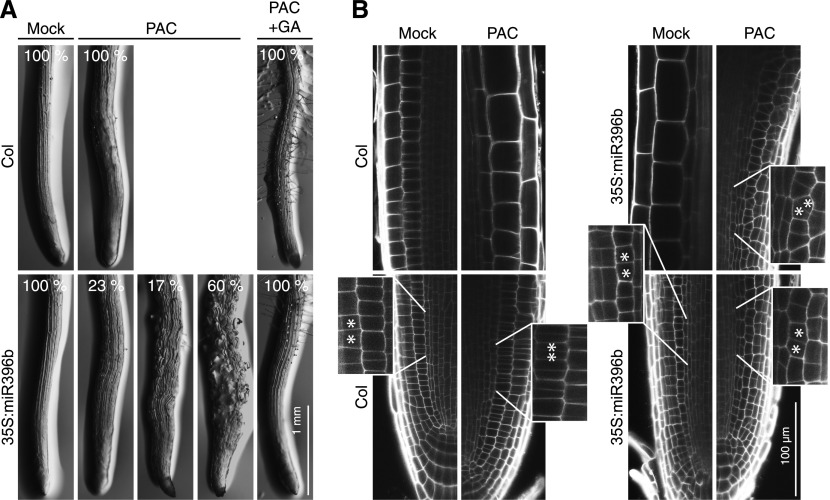
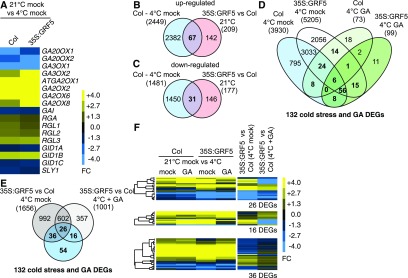
DELLA proteins are repressors of the gibberellin (GA) hormone signaling pathway that act mainly by regulating transcription factor activities in plants. GAs induce DELLA repressor protein degradation and thereby control a number of critical developmental processes as well as responses to stresses such as cold. The strong effect of cold temperatures on many physiological processes has rendered it difficult to assess, based on phenotypic criteria, the role of GA and DELLAs in plant growth during cold stress. Here, we uncover substantial differences in the GA transcriptomes between plants grown at ambient temperature (21°C) and plants exposed to cold stress (4°C) in Arabidopsis (Arabidopsis thaliana). We further identify over 250, to the largest extent previously unknown, DELLA-transcription factor interactions using the yeast two-hybrid system. By integrating both data sets, we reveal that most members of the nine-member GRF (GROWTH REGULATORY FACTOR) transcription factor family are DELLA interactors and, at the same time, that several GRF genes are targets of DELLA-modulated transcription after exposure to cold stress. We find that plants with altered GRF dosage are differentially sensitive to the manipulation of GA and hence DELLA levels, also after cold stress, and identify a subset of cold stress-responsive genes that qualify as targets of this DELLA-GRF regulatory module.


Figures

Figure 1.
Figure 1.
GA Treatments Induce Substantially Different Transcriptome Changes in the Cold (4°C) and at Ambient (21°C) Temperature. (A) Schematic representation of the experimental setup. (B) Immunoblot analysis with an anti-RGA antibody and Coomassie Brilliant Blue (CBB)-stained gel of 9-d-old seedlings exposed to cold stress (4°C) in mock-treated and 100 µM GA3-treated (GA) samples for the specified periods of time. (C) Heat map of the FC of GA biosynthesis and signaling genes after cold stress. (D) to (G) Venn diagrams comparing differentially expressed gene sets in cold-stressed samples and GA-treated samples grown at ambient temperature and in the cold as specified. The total number of differentially expressed genes is provided in parentheses. Genes that are GA-regulated and cold stress-regulated are highlighted in boldface. (H) to (J) Heat maps displaying the logarithmic FC (log2 FC) regulation of the cold- and GA-regulated genes as identified in (D) to (G) for the specified time points. DEGs, differentially expressed genes.
Figure 2.
Figure 2.
Yeast Two-Hybrid Analyses Identify a Large Number of Structurally Diverse DELLA-Interacting Transcription Factors. (A) and (B) Relative (A) and absolute (B) numbers of the 261 transcription factor interactions detected in the screens with GAI and RGA for the 15 most prominent transcription factor families. Sixty-seven interactors do not belong to the transcription factor families shown here. Both screens identified a largely overlapping set of interactions (86.6%). (C) Photographs of one screening plate as a representative result for the GAI and RGA yeast two-hybrid baits, demonstrating the large overlap in the results obtained with the two DELLA bait proteins. (D) and (E) Absolute numbers of the nine and six DELLA interactions detected in the screens with the non-DELLA GRAS proteins SCR and SCL3, respectively. The identities of the individual transcription factors, as well as an explanation of the transcription factor family nomenclature, are provided in Supplemental Data Set 6. (F) Venn diagram showing the overlap between results of the DELLA interaction screen as described in this study and previoulsy described interactions.
Figure 3.
Figure 3.
GRF Transcription Factors Are DELLA Interactors and GRF Expression Is GA-Regulated in the Cold. (A) Venn diagram showing the overlap between all 370 previously identified DELLA interactions and the 438 cold-regulated genes whose expression is GA- and cold-regulated. (B) Graphs displaying fragments per kilobase million (FPKM) values of GRF gene expression of seedlings grown in ambient temperature (21°C) and in cold stress (4°C) in the absence (mock) and presence of 100 µM GA3. Shown are means and sd of three biological replicate samples from pooled seedling shoots. (C) Targeted yeast two-hybrid interaction analysis between eight of the nine Arabidopsis GRF proteins and GAI as well as RGA together with the respective empty vector controls. AD, activation domain; DB, DNA-binding domain. (D) and (E) Results of BiFC experiments performed in transiently transformed N. benthamiana leaf epidermal cells between full-length DELLA proteins (GAIFL and RGAFL; [D]) and N-terminally truncated DELLA proteins (GAI141 and RGA204; [E]) with interaction candidates as specified. XERICO is a biologically unrelated protein that serves as a negative control (Ko et al., 2006).
Figure 4.
Figure 4.
GA Levels Differentially Modulate Leaf Area after Cold Stress in 35S:GRF5. (A) Representative first true leaves of wild-type seedlings (Col) and of seedlings of transgenic lines overexpressing GRF5 (35S:GRF5), which is not targeted by miRNA396, or the GRF-targeting miRNA396b (35S:miR396b). Seedlings were germinated for 6 d on half strenth MS (without mock or hormone treatment) at ambient temperature. Seedlings were then transferred for 7 d to half strenth MS containing 10 µM GA3 (GA) or 0.1 µM PAC (PAC) or a corresponding mock solution for 7 d at 21°C. In a parallel setup, the seedlings were first exposed to a 7-d 4°C cold stress treatment, which fully arrests plant growth, followed by a 7-d recovery period at 21°C. (B) Scatterplots of individual measurements (dots) of leaf areas from seedlings shown in (A). Also shown are means and sd of 16 seedlings. The dotted lines mark the means of the mock-treated wild-type sample and serve for orientation. Data sets with no statistical difference after ANOVA and Tukey’s HSD posthoc test fall into one group and are labeled with identical letters.
Figure 5.
Figure 5.
Cell Size Is Differentially Sensitive to PAC Treatments in Different GRF Genotypes. (A) and (B) Scatterplots of individual measurements (dots) of cell size (A) and cell number (B) from 400-µm × 400-µm photographs taken from the first two true leaves from 10 seedlings, as shown in (C). Also shown are means and sd of measurements from 10 different leaves. Data sets with no statistical difference after ANOVA and Tukey’s HSD posthoc test fall into one group and are labeled with identical letters. (C) Representative images of leaf palisade cells underlying the adaxial epidermis in the middle region of the leaf from plants with the specified genotypes and grown on medium supplemented with the specified concentrations of PAC.
Figure 6.
Figure 6.
GA Abundance Modulates Root Elongation in Seedlings after Cold Stress in a GRF-Dependent Manner. (A) Representative images of wild-type seedlings (Col) and of seedlings of transgenic lines overexpressing GRF5 (35S:GRF5), which is not targeted by miRNA396, or the GRF-targeting miRNA396b (35S:miR396b). Seedlings were germinated for 6 d on half strenth MS (without mock or hormone treatment) at ambient temperature. Seedlings were then transferred for 7 d to half strenth MS containing 10 µM GA3 (GA) or 0.1 µM PAC (PAC) or a corresponding mock solution for 7 d at 21°C. In a parallel setup, the seedlings were first exposed to a 7-d 4°C cold stress treatment, which fully arrests plant growth, followed by a 7-d recovery period at 21°C. (B) Scatterplots of individual measurements (dots) of root elongation measurements of seedlings shown in (A). The dotted lines mark the means of the mock-treated wild-type sample and serve for orientation. Data sets with no statistical difference after ANOVA and Tukey’s HSD posthoc test fall into one group and are labeled with identical letters.
Figure 7.
Figure 7.
miRNA396b Overexpression Lines Are Hypersensitive to PAC Treatments. (A) Representative images of 13-d-old roots of wild-type and miRNA396b-overexpressing seedlings grown for 8 d on PAC (5 µM), PAC (5 µM) and GA3 (10 µM), and a corresponding mock solution. The relative abundances of seedling roots with the different phenotypes are provided in the images. (B) Representative photographs of 10-d-old wild-type (Col) and 35S:miR396b roots grown for 5 d on mock or 5 μM PAC. Magnifications of epidermis and cortex cell layers showing cell division defects are shown in boxes.
Figure 8.
Figure 8.
Genetic Modulation of GRF Levels Results in Changes of the Cold and the GA Transcriptomes. (A) Heat map of the FC of GA biosynthesis and signaling genes after cold stress in the wild type (Col) and 35S:GRF5 (Supplemental Data Set 9). (B) and (C) Venn diagrams identifying genes that are cold stress-regulated in the wild type and upregulated or downregulated in the GRF5 overexpressor grown at ambient temperatures, which may represent GRF targets during cold responses. The total numbers of differentially expressed genes are provided in parentheses (Supplemental Data Sets 10 and 11). (D) Venn diagram comparing the cold stress-regulated transcriptomes of wild-type and GRF5 overexpressor seedlings and the GA-modulated cold transcriptomes of the two genotypes. Shown in boldface are 132 cold stress-regulated genes whose expression is GA modulated in the wild type and/or the GRF5 overexpression line, as further analyzed in (E) and (F). The total numbers of differentially expressed genes (DEGs) are provided in parentheses (Supplemental Data Set 10). (E) Venn diagram comparing the 132 cold stress- and GA-modulated genes (D) with the differential cold stress and GA-modulated cold stress transcriptomes between GRF5 overexpression lines and the wild type (Supplemental Data Set 12). (F) Heat maps of the FC of the 26, 16, and 36 differentially expressed genes identified in the comparisons between 35S:GRF5 and the wild-type (Col) transcriptomes in the cold. An expanded version of this heat map with gene identities is provided in Supplemental Figure 8.
Figure 9.
Figure 9.
GRF5 Represses CBF Gene Expression in a GA-Modulated Manner. (A) Schematic representation of the interactions in response to cold stress as determined in this study with a special emphasis on a possible crosstalk of the GA- and DELLA-dependent GRF5 regulation in the cold and cold stress-induced gene expression. (B) and (C) Graphs displaying reads per kilobase of transcript per million mapped reads (RPKM) values of CBF1 to CBF3 (B) and CBF target (C) gene expression of seedlings grown in ambient temperature (21°C) or in cold stress (4°C) in the absence (mock) and presence of 100 µM GA3. Shown are means and sd of three biological replicate samples from pooled seedling shoots.

Comment in

References

    1. Achard P., Baghour M., Chapple A., Hedden P., Van Der Straeten D., Genschik P., Moritz T., Harberd N.P.(2007). The plant stress hormone ethylene controls floral transition via DELLA-dependent regulation of floral meristem-identity genes. Proc. Natl. Acad. Sci. USA 104: 6484–6489. - PMC - PubMed
    1. Achard P., Gong F., Cheminant S., Alioua M., Hedden P., Genschik P.(2008a). The cold-inducible CBF1 factor-dependent signaling pathway modulates the accumulation of the growth-repressing DELLA proteins via its effect on gibberellin metabolism. Plant Cell 20: 2117–2129. - PMC - PubMed
    1. Achard P., Renou J.P., Berthomé R., Harberd N.P., Genschik P.(2008b). Plant DELLAs restrain growth and promote survival of adversity by reducing the levels of reactive oxygen species. Curr. Biol. 18: 656–660. - PubMed
    1. Altmann M., Altmann S., Falter C., Falter-Braun P.(2018). High-quality yeast-2-hybrid interaction network mapping. Curr. Protoc. Plant Biol. 3: e20067. - PubMed
    1. Arabidopsis Interactome Mapping Consortium (2011). Evidence for network evolution in an Arabidopsis interactome map. Science 333: 601–607. - PMC - PubMed

Publication types

MeSH terms

LinkOut - more resources