. 2020 Feb 14;11(1):913.
doi: 10.1038/s41467-020-14682-6.

MYCN amplification and ATRX mutations are incompatible in neuroblastoma

Affiliations

MYCN amplification and ATRX mutations are incompatible in neuroblastoma

Maged Zeineldin et al. Nat Commun. .

Abstract

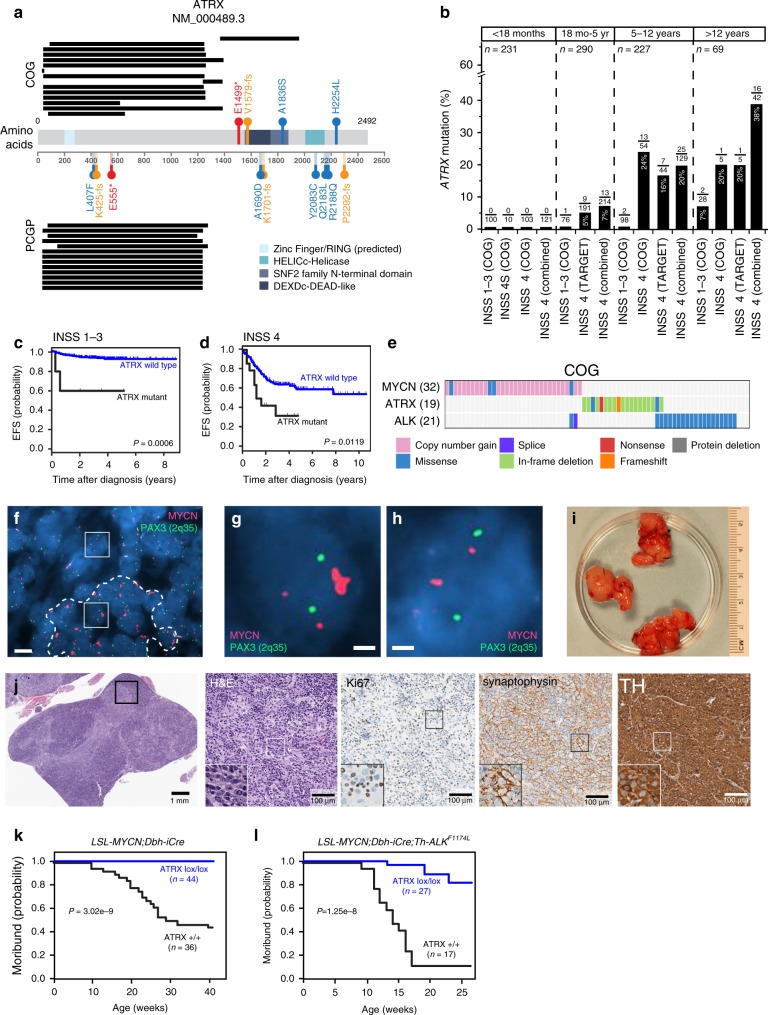
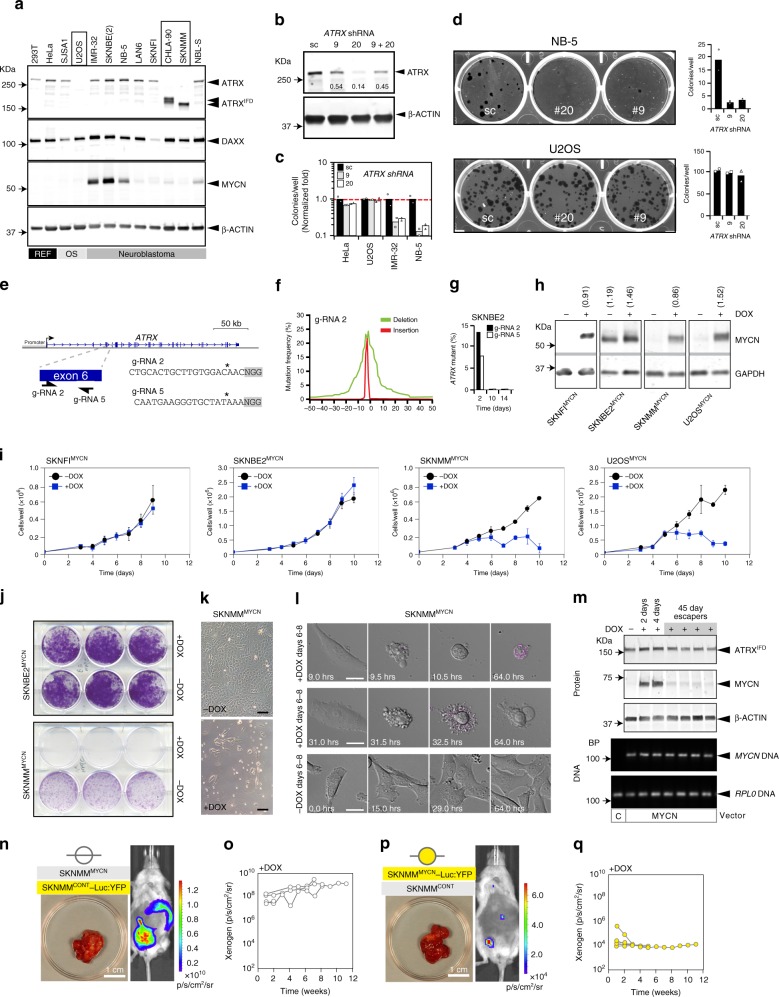
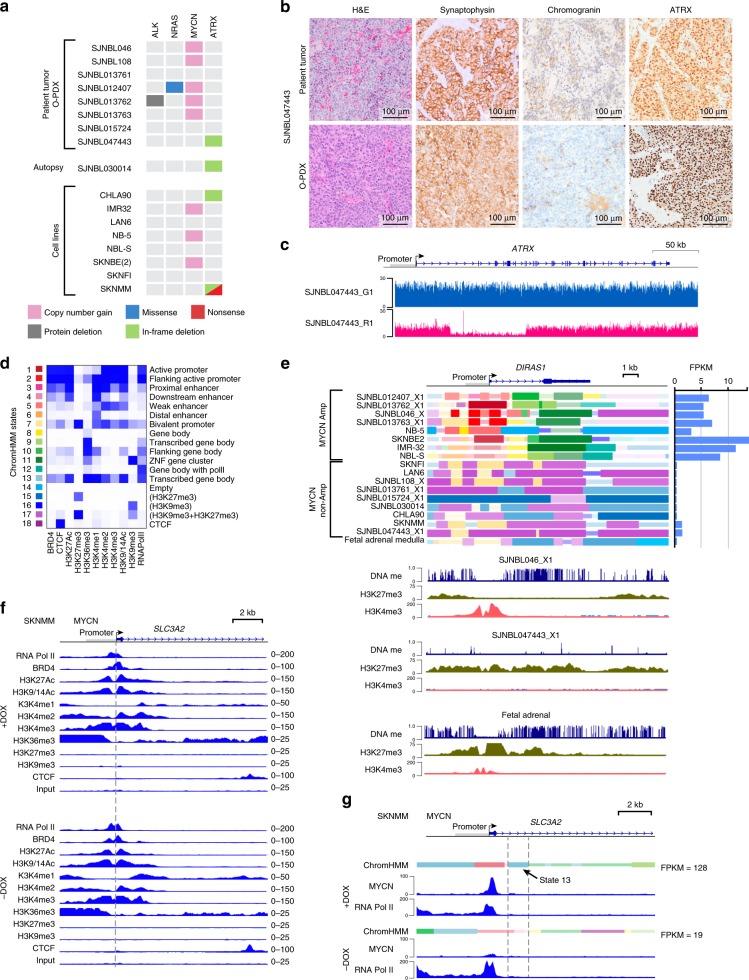
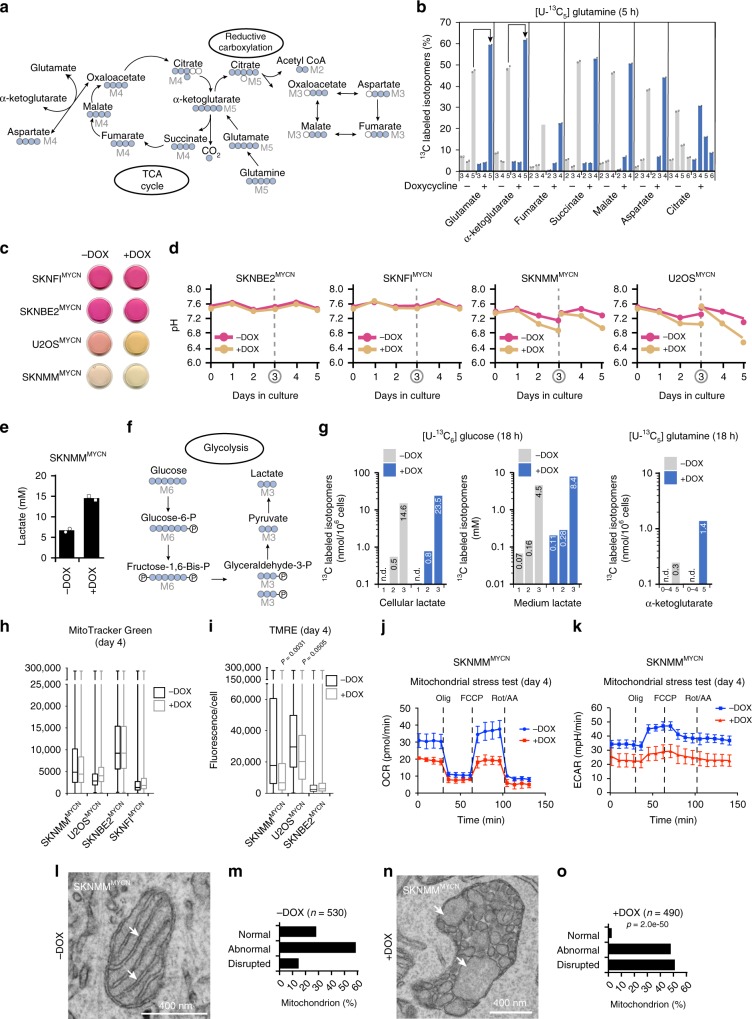
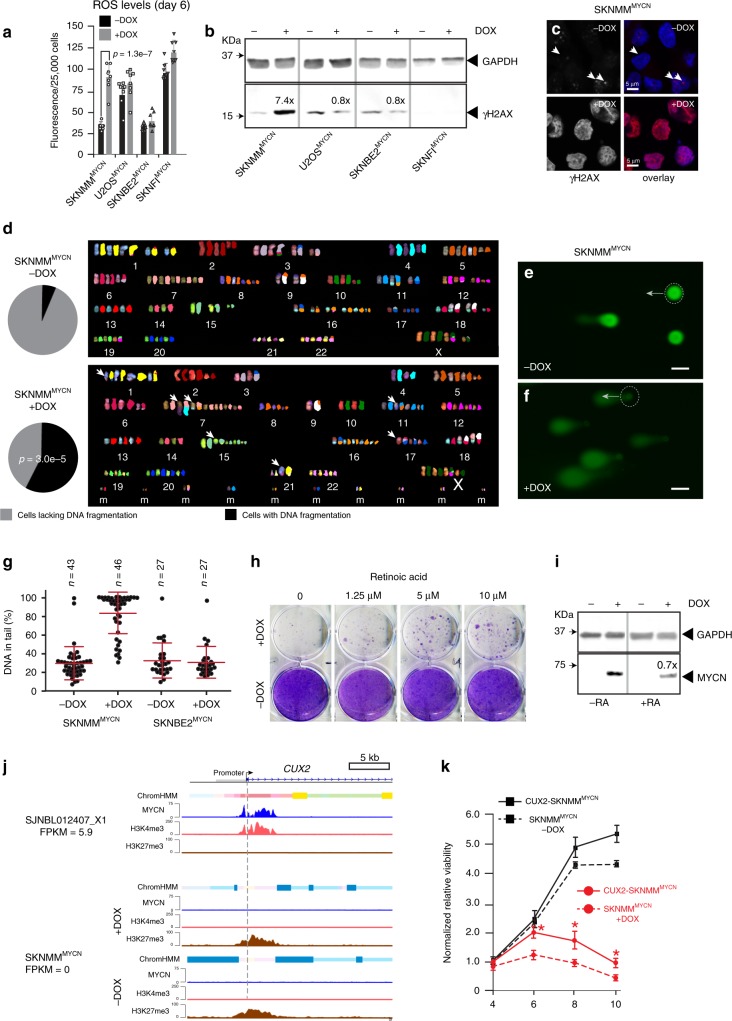
Aggressive cancers often have activating mutations in growth-controlling oncogenes and inactivating mutations in tumor-suppressor genes. In neuroblastoma, amplification of the MYCN oncogene and inactivation of the ATRX tumor-suppressor gene correlate with high-risk disease and poor prognosis. Here we show that ATRX mutations and MYCN amplification are mutually exclusive across all ages and stages in neuroblastoma. Using human cell lines and mouse models, we found that elevated MYCN expression and ATRX mutations are incompatible. Elevated MYCN levels promote metabolic reprogramming, mitochondrial dysfunction, reactive-oxygen species generation, and DNA-replicative stress. The combination of replicative stress caused by defects in the ATRX-histone chaperone complex, and that induced by MYCN-mediated metabolic reprogramming, leads to synthetic lethality. Therefore, ATRX and MYCN represent an unusual example, where inactivation of a tumor-suppressor gene and activation of an oncogene are incompatible. This synthetic lethality may eventually be exploited to improve outcomes for patients with high-risk neuroblastoma.


Conflict of interest statement

The authors declare no competing interests.

Figures

Fig. 1
Fig. 1. ATRX mutations are mutually exclusive of MYCN amplification in neuroblastoma.
a Summary of ATRX mutations in the COG and PCGP cohorts. Black bars indicate the deleted amino acids; red indicates nonsense mutations; orange indicates frameshift mutations; and blue indicates missense mutations. The major protein domains are shaded in blue. b Bar plot of the percentage of the 819 patients analyzed in this study with ATRX mutations for each age and stage. c, d EFS for patients with neuroblastoma with or without ATRX mutations for stages 1–3 or stage 4 for all age groups. P values were calculated using Cox model. e Heatmap of the distribution of mutations in MYCN, ATRX, and ALK in the COG cohort. Only those tumors with a mutation in at least one of the three genes are indicated. f Micrograph of MYCN FISH (red) for the one neuroblastoma sample with an ATRX mutation and MYCN amplification showing regional amplification (dashed line). The PAX3 (2q35) probe (green) is the control. g Micrograph of a neuroblastoma cell with MYCN homogenously staining region within a region of the tumor that has MYCN amplification (box within the dashed line region in f. h Micrograph of a neuroblastoma cell with two copies of MYCN outside of the region with amplification (box outside of the dashed line region). i Representative photograph of neuroblastoma tumors from a LSL-MYCN;Dbh-iCre mouse. All the tumors developed in this mouse cohorts were harvested and examined. j Micrographs of the histology of the tumor shown in i. The boxed region in each micrograph is magnified in the lower left panel of each image. Three tumors from each group of mice were examined by both H&E and immune-staining. k, l Survival curves for two mouse models of neuroblastoma with or without conditional ATRX deletion. The numbers of mice in each group are indicated. P values were calculated using Log-rank test. Scale bar: f, 5 μm, g, h, 1 μm. COG Children’s Oncology Group, PCGP Pediatric Cancer Genome Project, INSS International Neuroblastoma Staging System, H&E hematoxylin and eosin, TH tyrosine hydroxylase.
Fig. 2
Fig. 2. ATRX mutations and MYCN amplification are incompatible.
a Immunoblot of 12 cell lines. Boxes indicate ATRX-mutant lines. b Immunoblot for HeLa cells transfected with sc-shRNA or ATRX-specific shRNAs. The fraction of ATRX relative to sc-shRNA is indicated. c Bar plot of the number of colonies/well (mean of duplicates) after transfection of shRNAs, normalized to the sc-shRNA (dashed line). d Photograph of cresyl violet-stained colonies after transfection with shRNAs and bar plots of the average number of colonies/well. e Map of two gRNAs targeting ATRX. f Plot of the mutation frequency for gRNA-2, deletions (green) and insertions (red). g Bar plot of the proportion of ATRX-mutant alleles (100,000× coverage/sample). h Immunoblot for the cell lines with the doxycycline-inducible MYCN expression construct. Numbers indicate MYCN/GAPDH fluorescence intensity. The experiment was done three times with similar results. i Line graphs of the growth curves (mean ± SD) for each cell line ± doxycycline, n = 3. j Colony assay for SKNBE2MYCN and SKNMMMYCN cells ± doxycycline, the experiment was repeated twice with similar results. k Brightfield micrograph of SKNMMMYCN cells after 8 days in culture ± doxycycline, the experiment was repeated twice with similar results. l Brightfield micrographs of three individual SKNMMMYCN cells ± doxycycline at indicated timepoints, relative to the starting point of the movies (6 days + doxycycline), 44 cells were analyzed. m Immunoblots of SKNMMMYCN cells without doxycycline or after 2, 4, or 45 days in culture. The escapers are pools of cells that grew in the presence of doxycycline (n = 4). PCR for MYCN transgene and a control locus (RPL0) is indicated in the lower portion. n Xenogen image of a mouse with an orthotopic neuroblastoma tumor (photograph), that arose from a 1:1 mixture of SKNMMMYCN cells and SKNMMCONT–Luc:YFP cells (n = 5). o Line graph of xenogen image data described in n. p Xenogen image of a mouse with an orthotopic neuroblastoma tumor (photograph), that arose from a 1:1 mixture of SKNMMMYCN–Luc:YFP cells and SKNMMCONT cells (n = 5). q Line graph of xenogen image data described in p. Scale bars: k, 10-μm. DOX doxycycline, IFD in-frame deletion, sc scrambled.
Fig. 3
Fig. 3. Transcriptional and epigenetic changes induced by MYCN in ATRX-deficient neuroblastoma cells.
a Heatmap of the mutations in the O-PDXs and cell lines used in this study. An autopsy sample was also used for molecular profiling. b Micrographs of histologic analysis of the ATRX-mutant neuroblastoma O-PDX and corresponding patient tumor. c Plot of sequence read depth from Illumina sequencing for the ATRX gene in the patient’s germline (blue) and tumor (red), showing somatic deletion of exons 2–11. d Heatmap of the chromHMM states used in this study with functional annotation. e ChromHMM plot of the DIRAS1 gene and a bar plot of the gene’s expression on the right. DNA methylation and H3K27me3 and H3K4me3 ChIP-seq for DIRAS1 for a MYCN-amplified tumor (SJNBL046_X1), an ATRX-mutant tumor (SJNBL047443_X1), and fetal adrenal medulla. f ChIP-seq tracks for a portion of the SLC3A2 gene spanning the promoter in SKNMMMYCN cells in the presence or absence of doxycycline after 4 days in culture. Dashed line indicates the start of transcription. The scales are indicated on the right. g ChromHMM and ChIP-seq for MYCN and RNA PolII for a portion of the SLC3A2 gene spanning the promoter in SKNMMMYCN cells in the presence or absence of doxycycline after 4 days. The dashed lines indicate the region with induction of ChromHMM state 13 that is expanded after MYCN binds the promoter. ChromHMM chromatin Hidden Markov Modeling, FPKM fragments per kilobase of transcript per million mapped reads, O-PDX orthotopic patient-derived xenograft.
Fig. 4
Fig. 4. Expression of MYCN in ATRX-mutant cells leads to metabolic reprogramming and mitochondrial dysfunction.
a Simplified drawing of the TCA cycle and reductive carboxylation, blue circles: 13C derived from 13C5-glutamine. b Bar plot (mean of two technical replicates) of 13C-labeled isotopomers in SKNMMMYCN cells on day 4 ± doxycycline after 5 h of labeling with 13C5-glutamine. The arrows indicate an increase in M + 5 glutamate and M + 5 α-ketoglutarate (the most abundant and direct derivatives of 13C5-glutamine) in the presence of doxycycline. c Photograph of culture media on day 3 ± doxycycline. d Line plots of media pH ± doxycycline for each day. The culture media were changed on Day 3. e Histogram (mean of two biological replicates) of the levels of lactate at Day 4 in SKNMMMYCN cells ± doxycycline. f Simplified drawing of the glycolysis highlighting the production of lactate from 13C6-glucose. g Bar plots of 13C-labeled isotopomers of lactate and α-ketoglutarate in the medium or cells after 18 h of labeling with 13C6-glucose or 13C5-glutamine, respectively, at Day 4 in SKNMMMYCN cells ± doxycycline, with concentrations indicated on the bars. h, i Box and Whiskers plots of MitoTracker Green (H) and TMRE (I) staining ± doxycycline on Day 4. Each Box shows the 10th to 90th percentiles range of data (at least 15,000 cells), the line represents the median and the Whiskers show the minimum and maximum data range. P values were calculated using two-tailed Mann–Whitney non-parametric test. j, k Representative results of oxygen consumption rate (OCR) and extracellular acidification rate (ECAR) (mean and SEM of three technical replicates) for 2.5 × 104 SKNMMMYCN cells grown under the Mito-Stress assay conditions for the Seahorse. The experiment was done three times with similar results. lo Representative electron micrograph of mitochondria from SKNMMMYCN cells after 4 days ± doxycycline l, n showing disruption in the mitochondrial cristae (arrows). Bar plot of scoring of mitochondrial morphology for the SKNMMMYCN cells ± doxycycline, numbers of scored mitochondria are indicated m, o. P value was calculated using Chi-square test. DOX doxycycline, FCCP carbonyl cyanide-p-trifluoromethoxy phenylhydrazone, Olig oligomycin, Rot/AA rotenone/antimycin A, TCA tricarboxylic acid, TMRE tetramethylrhodamine ethyl ester.
Fig. 5
Fig. 5. Expression of MYCN in ATRX-mutant cells leads to ROS production, DNA damage, and replicative stress.
a Bar plot (mean±SD) of ROS levels on Day 6 ± doxycycline. P value was calculated using two-tailed Student t test. b Immunoblots on Day 4 ± doxycycline. The experiment was repeated with the same results. c Immunofluorescent detection of γH2AX (red) and nuclei (blue) in SKNMMMYCN cells on Day 4 ± doxycycline. The experiment was repeated with the same results. d Spectral karyotype analysis (SKY) of SKNMMMYCN cells ± DOX on Day 8. Chromosomes are shown adjacent to the pseudo-colored representation. Arrows indicate translocations. The pie charts show the proportion of cells with DNA fragmentation (n = 50). P value was calculated using Chi-square test. e, f Micrographs of single-cell electrophoresis of individual nuclei (dashed circles) and their COMET tail (arrows) ± doxycycline on Day 5. g Mean±SD of the COMET assay scoring. The number of analyzed cells are presented on the graph. h Photograph of cresyl violet-stained colonies from SKNMMMYCN cells ± doxycycline, with increasing concentrations of retinoic acid (RA). i Immunoblots of SKNMMMYCN cells ± doxycycline, with or without 5 μm RA. The level of MYCN protein was reduced by 30% (0.7×) in the presence of RA. j ChromHMM and ChIP-seq for MYCN, H3K4me3, and H3K27me3 for the CUX2 promoter for a MYCN-amplified neuroblastoma (SJNBL012407_X1) xenograft and SKNMMMYCN cells in the presence or absence of doxycycline after 4 days in culture. The gene expression (FPKM) is indicated, and the dashed line indicates the start of transcription. k Line plot of SKNMMMYCN cells in the presence or absence of doxycycline after 4, 6, 8, and 10 days in culture with or without ectopic expression of CUX2 or the GFP control from lentiviral infection. Each point is the mean and standard deviation of triplicate experiments, and the asterisks indicate statistical significance (P = 0.005, 0.001, and 0.008 at days 6, 8, and 10, respectively, two-tailed Student's t test). Scale bars e, f, 10 μm. DOX doxycycline, RA retinoic acid, ROS reactive-oxygen species, m marker chromosome fragments that could not be definitively identified.
Fig. 6
Fig. 6. H3.3 deposition is altered at G4 sequences in ATRX-mutant neuroblastomas.
a Stack bar plot of H3.3 peaks in the ATRX-deficient (CHLA90, SKNMM), MYCN amplified (SKNBE2, IMR32), and ATRX wild type, MYCN non-amplified (LAN6, SKNFI) cell lines. The H3.3 peaks that overlap with G4 sequences are shown in gray. b Stack bar plot of H3.3 peaks that are constitutive (C) across all three groups (ATRX, MYCN, WT), enriched (E) in ATRX mutant, depleted (D) in ATRX mutant, or overlap (O) between ATRX mutant and MYCN or WT. The H3.3 peaks that overlap with G4 sequences are shown in gray and the number of peaks for the D group are shown. c Piechart of the location of D group H3.3 peaks that have a correlation between the presence or absence of an H3.3 peak and ChromHMM state. Separate pie charts are shown for those that overlap with G4 sequences and those that lack G4 sequences. d Heatmap of the ChromHMM states used in this study with color coding. e Stack bar plot of the distribution of ChromHMM states for each cell line in the non-genic regions that have D group H3.3 peaks that correlate with ChromHMM state and overlap with G4 sequences or lack f G4 sequences. g ChromHMM, WGBS, and ChIP-seq tracks for the DUSP26 gene in SKNMM (ATRX mutant) and SKNBE2 (MYCN amplified) cells. Gene expression is indicated (FPKM) and G4 motif sequences are shown below the ChromHMM tracks. h ChromHMM, WGBS, and ChIP-seq tracks for the SLC3A2 gene in SKNMMMYCN cells with and without doxycycline. Gene expression is indicated (FPKM) and G4 motif sequences are shown below the ChromHMM tracks. DOX doxycycline, ChromHMM chromatin hidden markov modeling, G4 guanine quadruplex structure.

References

    1. Cheung NK, Dyer MA. Neuroblastoma: developmental biology, cancer genomics and immunotherapy. Nat. Rev. Cancer. 2013;13:397–411. doi: 10.1038/nrc3526. - DOI - PMC - PubMed
    1. Mosse YP, et al. Neuroblastoma in older children, adolescents and young adults: a report from the International Neuroblastoma Risk Group project. Pediatr. Blood Cancer. 2014;61:627–635. doi: 10.1002/pbc.24777. - DOI - PubMed
    1. Cheung NK, et al. Association of age at diagnosis and genetic mutations in patients with neuroblastoma. JAMA. 2012;307:1062–1071. doi: 10.1001/jama.2012.228. - DOI - PMC - PubMed
    1. Clynes D, Gibbons RJ. ATRX and the replication of structured DNA. Curr. Opin. Genet. Dev. 2013;23:289–294. doi: 10.1016/j.gde.2013.01.005. - DOI - PubMed
    1. Clynes D, Higgs DR, Gibbons RJ. The chromatin remodeller ATRX: a repeat offender in human disease. Trends Biochem. Sci. 2013;38:461–466. doi: 10.1016/j.tibs.2013.06.011. - DOI - PubMed

Publication types

Substances