. 2020 Feb 14;11(1):896.
doi: 10.1038/s41467-020-14639-9.

Immunoproteasome expression is associated with better prognosis and response to checkpoint therapies in melanoma

Affiliations

Immunoproteasome expression is associated with better prognosis and response to checkpoint therapies in melanoma

Shelly Kalaora et al. Nat Commun. .

Abstract

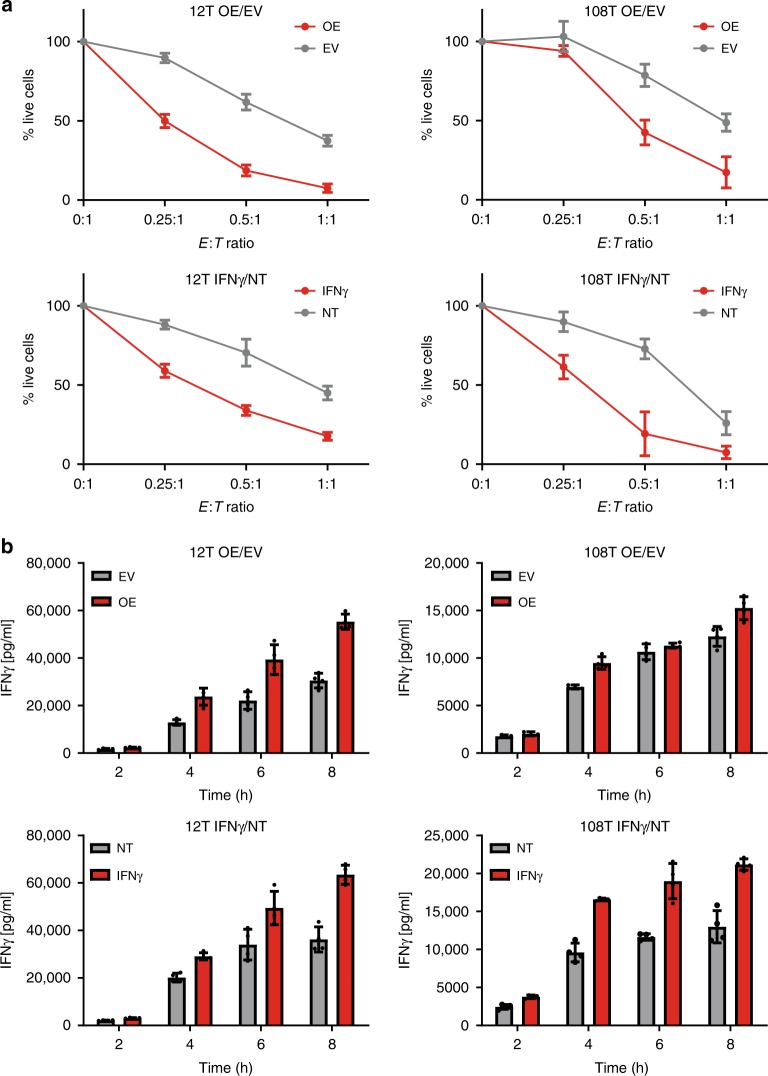
Predicting the outcome of immunotherapy treatment in melanoma patients is challenging. Alterations in genes involved in antigen presentation and the interferon gamma (IFNγ) pathway play an important role in the immune response to tumors. We describe here that the overexpression of PSMB8 and PSMB9, two major components of the immunoproteasome, is predictive of better survival and improved response to immune-checkpoint inhibitors of melanoma patients. We study the mechanism underlying this connection by analyzing the antigenic peptide repertoire of cells that overexpress these subunits using HLA peptidomics. We find a higher response of patient-matched tumor infiltrating lymphocytes against antigens diferentially presented after immunoproteasome overexpression. Importantly, we find that PSMB8 and PSMB9 expression levels are much stronger predictors of melanoma patients' immune response to checkpoint inhibitors than the tumors' mutational burden. These results suggest that PSMB8 and PSMB9 expression levels can serve as important biomarkers for stratifying melanoma patients for immune-checkpoint treatment.


Conflict of interest statement

The authors declare no competing interests.

Figures

Fig. 1
Fig. 1. IP subunits expression is associated with better prognosis.
a, b Kaplan–Meier plot of TCGA melanoma patients (n = 472), where the survival of patients with high (a) IP expression, and (b) Mutational load (top tertile; blue) is compared with that of the patients with the low counterparts (bottom tertile; yellow) (logrank P = 0.00014 and P = 0.27 with median survival time difference 4094 and 783 days, respectively). c The estimated abundance of CD4 + T-cell, CD8+ T-cell, regulatory T-cell (Treg), NK cell (NK), M1 macrophage (M1), and cytolytic score (CYT score) of patients with high IP subunits expression (top tertile; blue) are higher compared to patients with low IP subunits expression (bottom tertile; yellow) (FDR-corrected Wilcoxon ranksum P < 0.05).
Fig. 2
Fig. 2. Reactivity toward cells with overexpression of immunoproteasome subunits is higher compared to control.
a Cells with immunoproteasome overexpression compared to empty vector control or cells treated with IFNγ compared to untreated cells were co-cultured in different ratios with autologous TILs. (E:T, different effector to target ratios). Number of live cells were counted after 8 or 12 h for 12T and 108T, respectively. b IFNγ secretion was measured after 2, 4, 6, and 8 h of co-culture of cells with immunoproteasome overexpression compared to empty vector control or cells treated with IFNγ compared to untreated cells. Data were analyzed from n = 3 biological repeats per each condition and represented as mean ± SD.
Fig. 3
Fig. 3. Differently presented peptide repertoire in cells with immunoproteasome overexpression.
Volcano plots were plotted to identify the peptides that were differentially presented by cells with overexpression of the immunoproteasome subunits (OE) compared to the control (EV) (ac), or of the cells that were treated with IFNγ (IFNγ) compared to non-treated cells (NT) (d, e). Each HLA peptidomics experiment was done on three independent cell cultures. Peptides were determined as significantly changed if they passed statistical analysis (Two side student’s t-test, permutation based FDR = 0.05, S0 = 1) and were found in the plot above the lines. TAAs were marked in blue dots and neo-antigens in red dots. The number of differentially presented peptides is indicated in the table (f).
Fig. 4
Fig. 4. HLA peptide repertoire of 12T cells with overexpression of immunoproteasome subunits is more immunogenic compared to the control peptide repertoire.
All peptides whose fold change in intensity was greater or smaller than one by cells with immunoproteasome overexpression compared to empty vector control (a) or cells treated with IFNγ compared to untreated cells (b) were tested for their ability to elicit an immune response by the autologous TILs. The reactivity of each peptide was measured from n = 3 biological repeats per each peptide and represented as mean ± SD. The sum reactivity of each group of peptides, and the number of peptides in each group is indicated. Red and gray areas represent all peptides whose fold change intensity was greater or smaller than one by the OE/IFNγ cells and EV/NT cells, respectively (including the significantly changed peptides). Dark red and dark gray areas represent the peptides that were significantly differentially presented by the OE/IFNγ cells and EV/NT cells respectively. For each condition the sum reactivity was calculated for all peptides and for the ones that were significantly differentially presented.
Fig. 5
Fig. 5. IP expression is associated with better response to anti-CTLA4 and anti-PD1 therapy.
a The responders to anti-CTLA4 therapy show significantly higher expression of IP subunits (one-sided Wilcoxon ranksum P < 0.006) and mutational load (one-sided Wilcoxon ranksum P < 0.03). No significant difference was observed in regular proteasome subunit expression (PSMB5/6; Wilcoxon ranksum P > 0.5). b The IP subunits expression is predictive of the response to anti-CTLA4 therapy, quantified by area under the curve (AUC = 0.80, orange) of receiver operating curve (ROC), superior or comparable to the mutational load (AUC = 0.72, blue) and IFNγ signature (AUC = 0.75, black). In combination with ML, IP (PSMB) is the most predictive (AUC = 0.89, red) followed by CD8T (AUC = 0.87) and IFNγ (AUC = 0.84, black) or CD8T as a single variable (AUC = 0.82, gray). Precision-recall curve is shown in Supplementary Fig. 18a. c The responders to anti-PD1 therapy show significantly higher expression of IP subunits (one-sided Wilcoxon ranksum P < 0.03). No significant difference was observed in regular proteasome subunit expression (PSMB5/6; one-sided Wilcoxon ranksum P > 0.5) and mutational load (one-sided Wilcoxon ranksum P > 0.1). d The IP (orange) is predictive of the response to anti-PD1 therapy (quantified by area under the curve (AUC = 0.75 of receiver operating curve (ROC)), superior to the mutational load (AUC = 0.67, blue), IFNγ signature (AUC = 0.52, black), CD8+ T-cell abundance (AUC = 0.55, yellow), and PDL1 expression (AUC = 0.64, gray). The combination of IP subunit expression and mutational load provides AUC = 0.79 (red). Precision-recall curve is shown in Supplementary Fig. 18b.

References

    1. Snyder A, et al. Genetic basis for clinical response to CTLA-4 blockade in melanoma. N. Engl. J. Med. 2014;371:2189–2199. doi: 10.1056/NEJMoa1406498. - DOI - PMC - PubMed
    1. Hugo W, et al. Genomic and transcriptomic features of response to anti-PD-1 therapy in metastatic melanoma. Cell. 2016;165:35–44. doi: 10.1016/j.cell.2016.02.065. - DOI - PMC - PubMed
    1. Zaretsky JM, et al. Mutations associated with acquired resistance to PD-1 blockade in melanoma. N. Engl. J. Med. 2016;375:819–829. doi: 10.1056/NEJMoa1604958. - DOI - PMC - PubMed
    1. Rooney MS, Shukla SA, Wu CJ, Getz G, Hacohen N. Molecular and genetic properties of tumors associated with local immune cytolytic activity. Cell. 2015;160:48–61. doi: 10.1016/j.cell.2014.12.033. - DOI - PMC - PubMed
    1. Patel SJ, et al. Identification of essential genes for cancer immunotherapy. Nature. 2017;548:537–542. doi: 10.1038/nature23477. - DOI - PMC - PubMed

Publication types