. 2020 Feb 14;11(1):884.
doi: 10.1038/s41467-020-14724-z.

Exceptional subgenome stability and functional divergence in the allotetraploid Ethiopian cereal teff

Affiliations

Exceptional subgenome stability and functional divergence in the allotetraploid Ethiopian cereal teff

Robert VanBuren et al. Nat Commun. .

Abstract

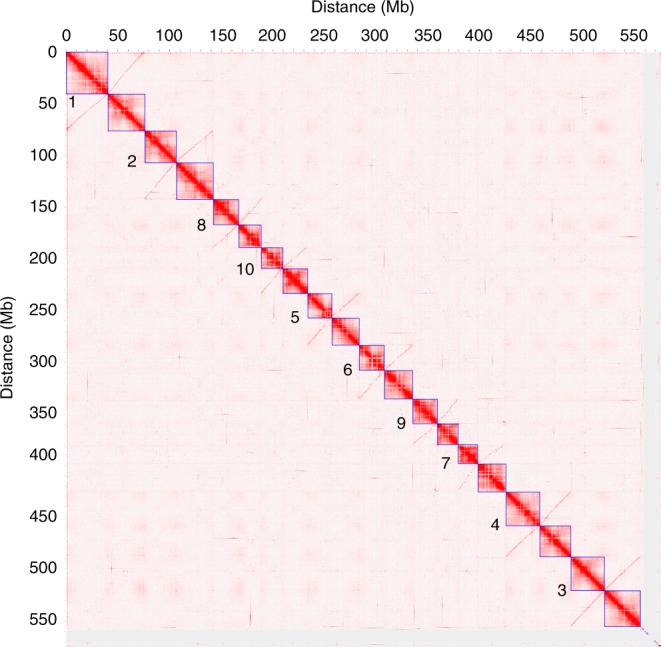
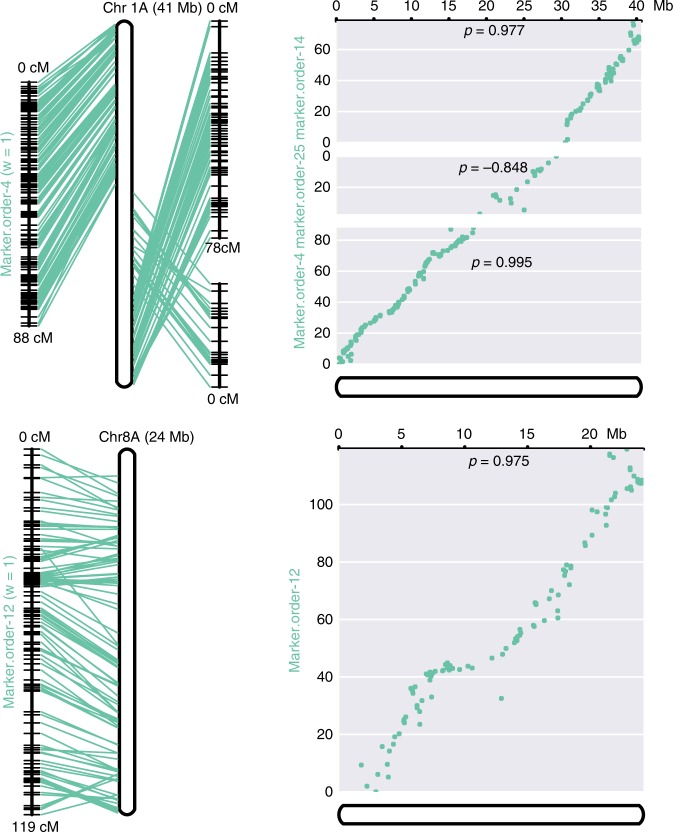
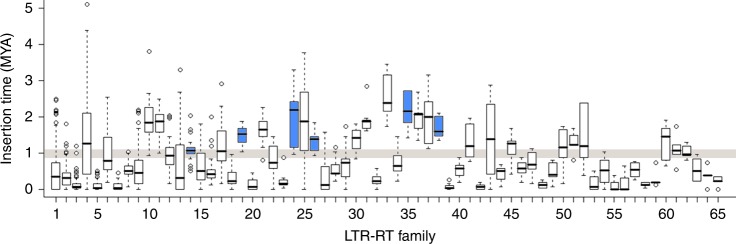
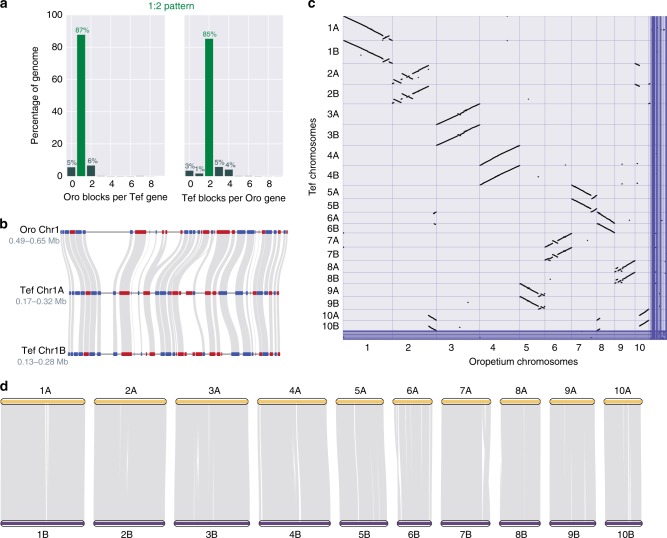
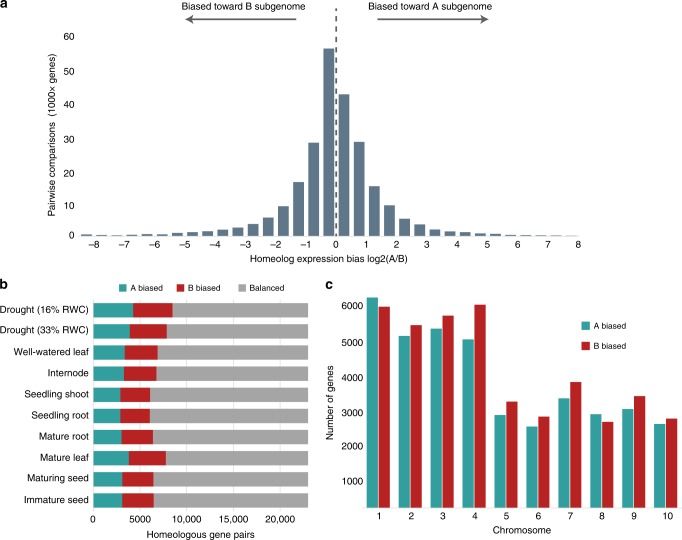
Teff (Eragrostis tef) is a cornerstone of food security in the Horn of Africa, where it is prized for stress resilience, grain nutrition, and market value. Here, we report a chromosome-scale assembly of allotetraploid teff (variety Dabbi) and patterns of subgenome dynamics. The teff genome contains two complete sets of homoeologous chromosomes, with most genes maintaining as syntenic gene pairs. TE analysis allows us to estimate that the teff polyploidy event occurred ~1.1 million years ago (mya) and that the two subgenomes diverged ~5.0 mya. Despite this divergence, we detect no large-scale structural rearrangements, homoeologous exchanges, or biased gene loss, in contrast to many other allopolyploids. The two teff subgenomes have partitioned their ancestral functions based on divergent expression across a diverse expression atlas. Together, these genomic resources will be useful for accelerating breeding of this underutilized grain crop and for fundamental insights into polyploid genome evolution.


Conflict of interest statement

The authors declare no competing interests.

Figures

Fig. 1
Fig. 1. Hi-C-based clustering of the teff genome.
Heat map showing the density of Hi-C interactions between contigs, with red indicating high density of interactions. Distinct chromosomes are highlighted by blue boxes and homoeologous chromosome pairs are numbered.
Fig. 2
Fig. 2. Collinearity of tef pseudomolecules with the high-density genetic map.
Two example chromosomes demonstrate a pseudomolecule spanning three linkage groups (top) and a pseudomolecule spanning a single linkage group (bottom). Lines connect the genetic makers with their physical location on the pseudomolecules. p Values within the scatterplots indicate the Pearson’s correlation coefficient of marker distance (cM) and physical distance (bp). Source data are provided as a Source Data file.
Fig. 3
Fig. 3. Insertion dynamics of 65 LTR-RT families in teff.
Box plots of insertion time for the 65 LTR-RT families having ≥5 intact LTR elements are plotted. Families 1–5 have ≥100 intact LTRs, 6–33 have ≥10 LTRs, and 34–65 have ≥5 LTRs. The exact number of LTR-RTs in each family is available in the TE annotation gff file. The six subgenome-specific families are highlighted in blue and the estimated range for the teff polyploidy event is shown in brown. A substitution rate of 1.3e-8 per site per year was used to infer the element insertion times. Box boundaries indicate the 25th and 75th percentiles of the insertion time and whiskers extend to 1.5 times the interquartile range.
Fig. 4
Fig. 4. Comparative genomics of the teff genome.
a Ratio of syntenic depth between Oropetium and teff. Syntenic blocks of Oropetium per teff gene (left) and syntenic blocks of teff per Oropetium gene (right) are shown indicating a clear 1:2 pattern of Oropetium to teff. b Microsynteny of the teff and Oropetium genomes. A region of the Oropetium chromosome 1 and the corresponding syntenic regions in homoeologous teff chromosomes 1A and 1B are shown. Genes are shown in red and blue (for forward and reverse orientation, respectively) and syntenic gene pairs are connected by gray lines. c Macrosynteny of the teff and Oropetium genomes. Syntenic gene pairs are denoted by gray points. d Collineariy of the teff subgenomes. The ten chromosomes belonging to the teff A and B subgenomes are shown in yellow and purple, respectively. Syntenic blocks between homoeologous regions are shown in grey. Source data underlying Fig. 4c are provided as a Source Data file.
Fig. 5
Fig. 5. Homoeolog expression bias between the A and B subgenomes of teff.
a The distribution of homoeolog expression bias (HEB) between all gene pairs in all tissues. An HEB >0 indicates bias toward the A subgenome and a HEB <0 indicates bias toward the B subgenome. b HEB across the ten tissues in the teff expression atlas. Gene pairs were classified as biased toward the A (blue) or B (red) subgenomes or balanced with no statistically significant differential expression (gray). c HEB in each of the ten pairs of chromosomes across all ten tissue types. Source data underlying Fig. 5a are provided as a Source Data file.

References

    1. Mueller NG, Fritz GJ, Patton P, Carmody S, Horton ET. Growing the lost crops of eastern North America’s original agricultural system. Nature Plants. 2017;3:17092. doi: 10.1038/nplants.2017.92. - DOI - PubMed
    1. Khoury CK, et al. Increasing homogeneity in global food supplies and the implications for food security. Proc. Natl Acad. Sci. USA. 2014;111:4001–4006. doi: 10.1073/pnas.1313490111. - DOI - PMC - PubMed
    1. CSA. Agricultural Sample Survey 2011/2012: Report on Area and Production of Major Crops (Central Statistical Agency Addis Ababa, 2012).
    1. Stallknecht, G. F., Gilbertson, K. M. & Eckhoff, J. in New crops 231–234 (Wiley, New York, 1993).
    1. Demissie, A. in Narrowing the Rift. Tef Research and Development. Proc. International Workshop on Tef Genetics and Improvement (Debre Zeit, Ethiopia, 2000).

Publication types