. 2020 Feb 14;11(1):903.
doi: 10.1038/s41467-020-14767-2.

CEP44 ensures the formation of bona fide centriole wall, a requirement for the centriole-to-centrosome conversion

Affiliations

CEP44 ensures the formation of bona fide centriole wall, a requirement for the centriole-to-centrosome conversion

Enrico S Atorino et al. Nat Commun. .

Abstract

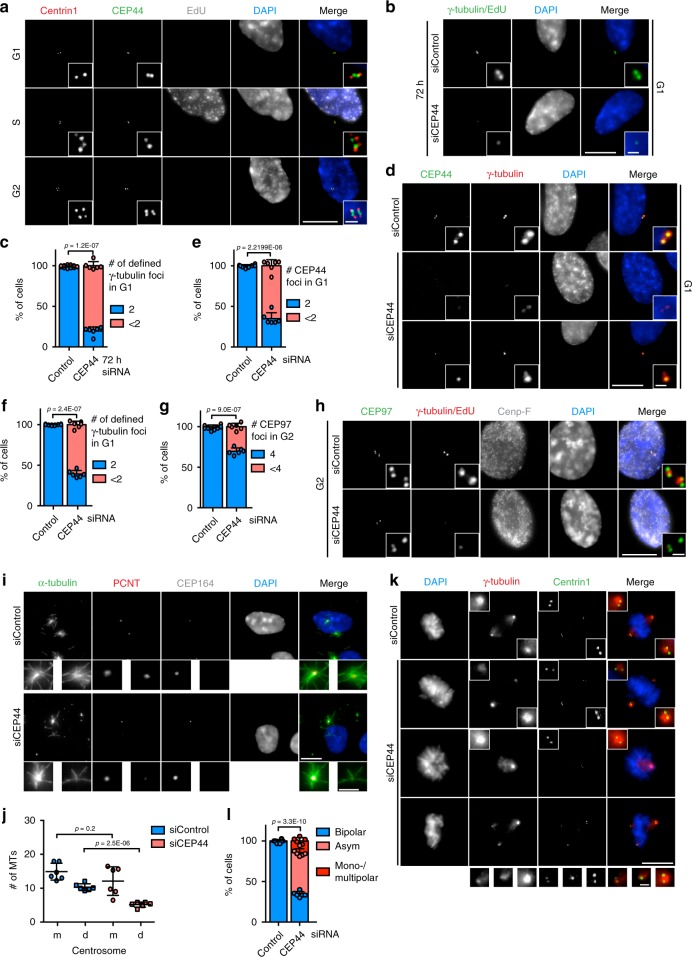
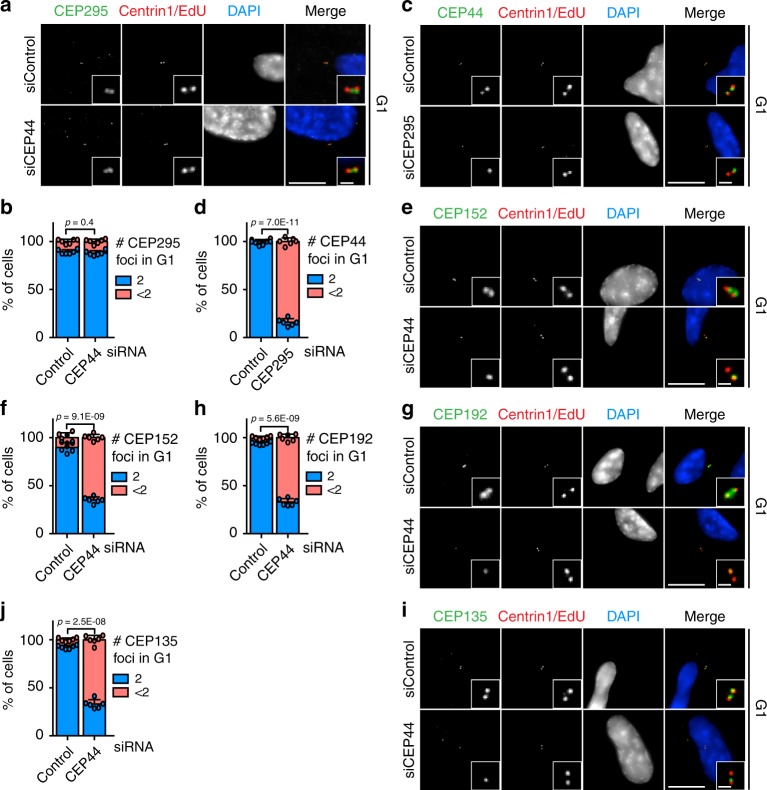
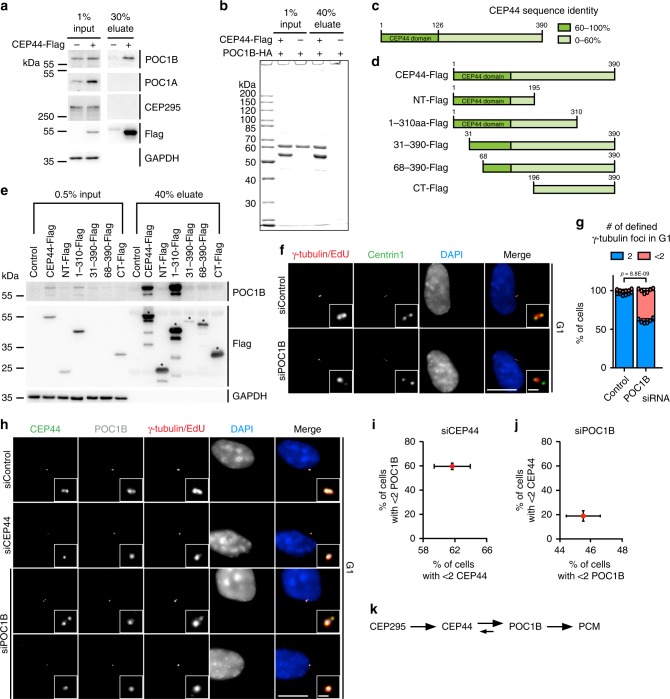
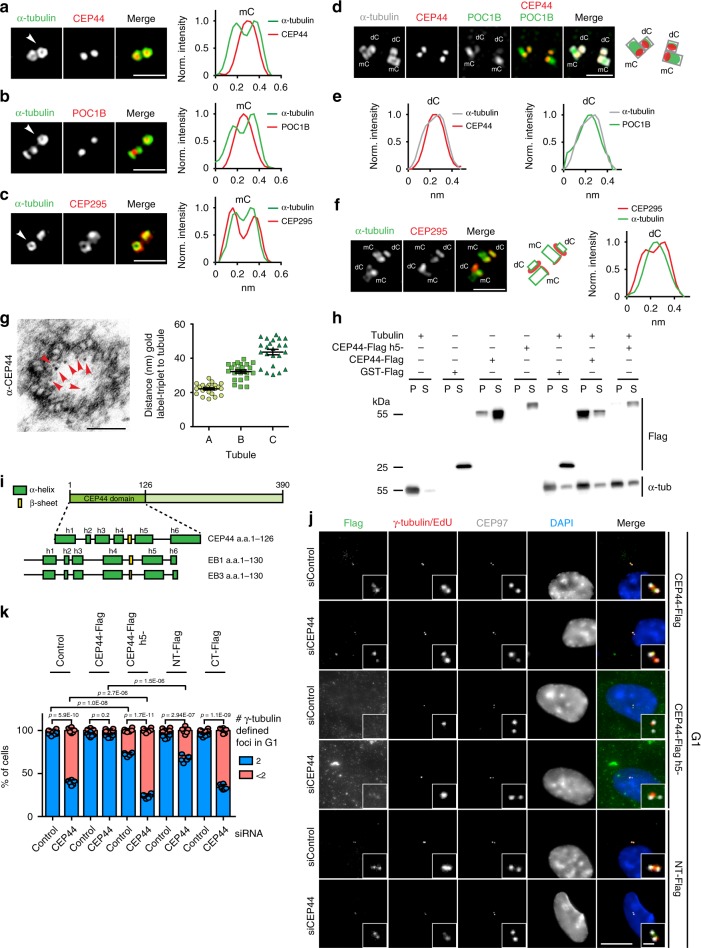
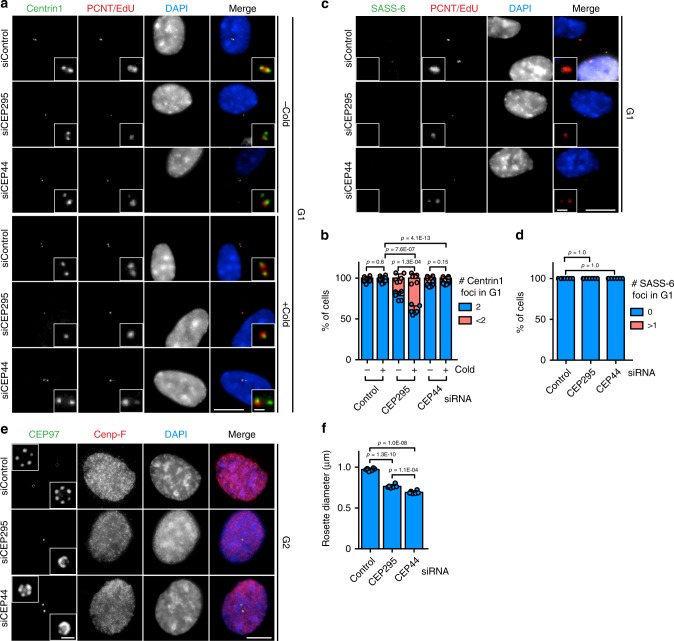
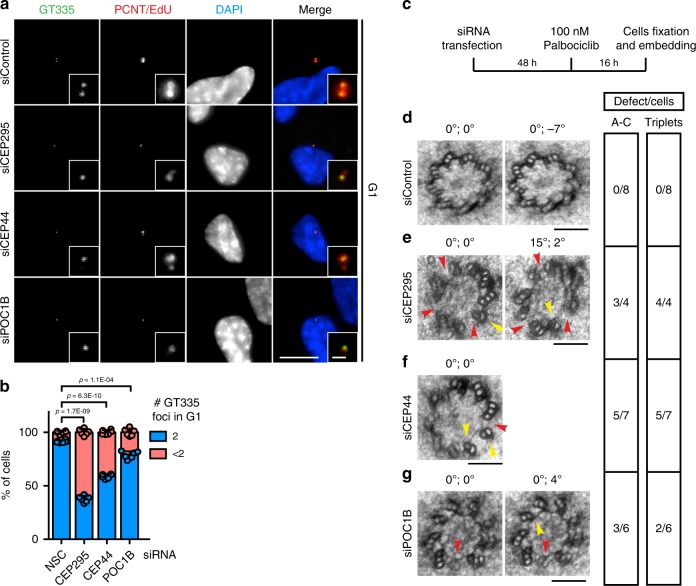
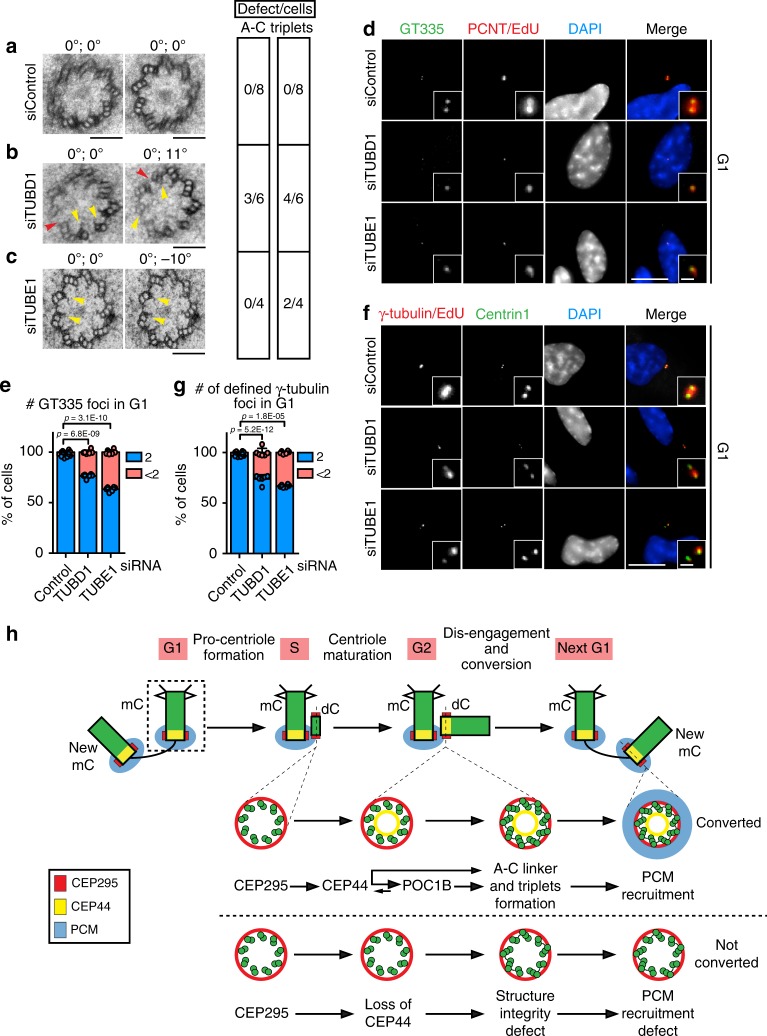
Centrosomes are essential organelles with functions in microtubule organization that duplicate once per cell cycle. The first step of centrosome duplication is the daughter centriole formation followed by the pericentriolar material recruitment to this centriole. This maturation step was termed centriole-to-centrosome conversion. It was proposed that CEP295-dependent recruitment of pericentriolar proteins drives centriole conversion. Here we show, based on the analysis of proteins that promote centriole biogenesis, that the developing centriole structure helps drive centriole conversion. Depletion of the luminal centriole protein CEP44 that binds to the A-microtubules and interacts with POC1B affecting centriole structure and centriole conversion, despite CEP295 binding to centrioles. Impairment of POC1B, TUBE1 or TUBD1, which disturbs integrity of centriole microtubules, also prevents centriole-to-centrosome conversion. We propose that the CEP295, CEP44, POC1B, TUBE1 and TUBD1 centriole biogenesis pathway that functions in the centriole lumen and on the cytoplasmic side is essential for the centriole-to-centrosome conversion.


Conflict of interest statement

The authors declare no competing interests.

Figures

Fig. 1
Fig. 1. CEP44 is a centriolar protein necessary for the CCC mechanism.
a IF of cycling RPE1 cells showing that CEP44 binds to the new dCs during G2. While S phase cells were detected by EdU stain, G1 and G2 cells were discerned by the lack of EdU stain and the number of centrin1 signals (centrioles). b IF of cells after 72 h of depletion. In the siCEP44 sample (lower panel) G1 cells contained less centrosomes as judged by the number of γ-tubulin foci (Cenp-F in Supplementary Fig. 1b). c Quantification of b. 80.4 ± 5.0% of G1 cells contained <2 centrosomes. d IF of 60 h siRNA treated RPE1 cells in G1. While the G1 control cells contained 2 defined PCM foci (γ-tubulin) accompanied by equal number of CEP44 foci, in the siCEP44 sample the loss of CEP44 correlated with inefficient PCM (γ-tubulin) recruitment to only one (bottom panel) or both centrosomes (middle panel) (Cenp-F, Supplementary Fig. 1g). e Quantification of CEP44 loss in d. 65.1 ± 7.3% of G1 cells contained <2 CEP44 foci. f Quantification of γ-tubulin defined foci in d. 60.7 ± 4.2% of G1 cells contained <2 defined γ-tubulin signals. g, h G2 CEP44-depleted cells after 60 h of CEP44 depletion showed a mild centriole duplication defect as judged by the counting of CEP97 foci (<4). g Quantification of h. 30.3 ± 4.1% of CEP44-depleted cells contained <4 centrioles. i MT regrowth assay in RPE1 C-Nap1 KO cells. The non-converted daughter centrosome without CEP164 staining regrew lower numbers of MTs (5.1 ± 2.7 MTs/centrosome) than the siControl daughter centrosomes (10.3 ± 3.0 MTs/centrosome) upon cold treatment and MT regrowth. j Quantification of i. k Loss of CEP44 leads to misalignment of mitotic spindles (>65%) generating either bipolar asymmetric spindles (51.3 ± 4.7%) or mono-/multipolar ones (14.3 ± 4.0). l Quantification of k. (a, b, d, h, i, k, scale bars: 10 μm, magnification scale bars: 1 μm; c, e, f, g, j and l data are presented as mean ± s.d., all statistics were derived from two-tail unpaired t-test analysis of n = 6 biologically independent experiments and source data are provided as a Source Data file).
Fig. 2
Fig. 2. CEP44, downstream of CEP295, influences the conversion mechanism.
a CEP295 did not delocalise from the centrioles in G1 cells (Cenp-F in Supplementary Fig. 3a) upon CEP44 siRNA depletion (10.9 ± 2.3% of cells with <2 CEP295 foci in siControl cells vs. 12.1 ± 2.5% in siCEP44 sample). b Quantification of a. c CEP44 strongly delocalised from the daughter centrosome in the absence of CEP295. G1 cells (Cenp-F negative in Supplementary Fig. 3c) were analysed. d Quantification of c. In siCEP295 84.0 ± 3.7% of the cells had <2 CEP44 foci. e CEP44-less daughter centrosomes lacked CEP152 (f, 64.9 ± 3.2% of G1 cells vs. 10.1 ± 5.1% in control; Cenp-F in Supplementary Fig. 3i, left column), g CEP192 (h, 67.1 ± 3.6% of G1 cells; Cenp-F in Supplementary Fig. 3i, middle column) and i CEP135 (j, 66.9 ± 4.6% of G1 cells; Cenp-F in Supplementary Fig. 3i, right column). (a, c, e, g, i, scale bars: 10 μm, magnification scale bars: 1 μm; b, d, f, h and j data are presented as mean ± s.d., all statistics were derived from two-tail unpaired t-test analysis of n = 6 biologically independent experiments and source data are provided as a Source Data file).
Fig. 3
Fig. 3. The CEP44-POC1B complex is needed to convert centrioles to centrosomes.
a Anti-Flag IP using CEP44-Flag from RPE1 cells was analysed for POC1B, POC1A and CEP295 by immuno-blotting (IB). GAPDH was used as input control. b Coomassie Blue stained gel of in vitro binding between purified, recombinant CEP44-Flag and purified, recombinant POC1B-HA. See Supplementary Fig. 5b for IB and 5c for Coomassie Blue stained gels of purified proteins used in the experiment. c Schematic representation of CEP44 protein sequence identity in vertebrata (referred to Supplementary Fig. 5a). d CEP44-Flag constructs that were designed based on c and used in e. e IB of input and eluted samples from RPE1 IPs using CEP44-Flag constructs as outlined in d. The CEP44-Flag IPs were tested for the presence of POC1B. GAPDH was used as loading control for the input. f, g 39.2 ± 2.8% of G1 cells in which POC1B was depleted show <2 γ-tubulin defined foci (Cenp-F in Supplementary Fig. 5g). hj Loss of either CEP44 or POC1B in response to siRNAs depletion by one of them. h, i CEP44 loss upon CEP44 siRNA has a similar impact on POC1B loss from dCs. i Quantification of h. h, j CEP44 delocalisation was less severe than POC1B loss upon POC1B siRNA. j Quantification of h. Upon siPOC1B depletion, CEP44 delocalised (18.9 ± 4.3% of G1 cells) less sever than POC1B (45.5 ± 2.3%). k Schematic representation of the functional interdependency between the conversion molecules in the CCC mechanism. (f, h, scale bars: 10 μm, magnification scale bars: 1 μm; g, i, j data are presented as mean ± s.d., all statistics were derived from two-tail unpaired t-test analysis of n = 6 biologically independent experiments and source data are provided as a Source Data file).
Fig. 4
Fig. 4. CEP44 localises to the centriole lumen via its MT-binding affinity.
ac 2D-SIM images of G1 centrioles (α-tubulin) and corresponding normalised intensity profiles of centrosomes positioned perpendicularly to the imaging plane (white arrows). a CEP44 localised in the centriole lumen as POC1B (b). c CEP295 decorates the outer centriolar wall. d 2D-SIM of centrosomes with duplicated centriole pairs co-stained with α-tubulin, CEP44 and POC1B. e Intensity profiles of dC cross-section. CEP44 (left) and POC1B (right) reside in the dC lumen. f (left) 2D-SIM of centrosomes with duplicated centriole pairs co-stained with α-tubulin and CEP295. f (right) Intensity profiles of dC cross-section. g CEP44 immuno-gold labelling in purified centrosomes (left). Red arrows indicate 10 nm gold particles. g (right) Distance of the gold particles from A-, B- and C-tubule of the same triplet respectively 21.9 ± 3.1 nm, 32.0 ± 4.7 nm, 43.1 ± 7.5 nm (all cases, n = 23 particles, data present mean ± s.d.). h Binding assay of recombinant CEP44-Flag and h5- mutant purified from E.coli to MTs. GST-Flag was used as control. Proteins were incubated with soluble polymerised tubulin. MTs with bound proteins were sedimented by centrifugation. The supernatant (S) and pellet (P) were analysed by IB for α-tubulin and Flag. Supplementary Fig. 8f shows Coomassie blue stain gel of purified proteins. i Schematic representation of CEP44 domain organisation. (Bottom) Comparison of CEP44 domain predicted secondary structure organisation with the MT-binding domain of EB1 and EB3 proteins. j The h5- and the NT-fragment could not rescue the CCC defect vs. CEP44-Flag. Constructs were mildly expressed by the addition of 2 ng/ml doxycycline. k Quantification of j and Supplementary Fig. 9c. While the CT-Flag was unable to rescue the loss of PCM (63.9 ± 3.2% of cells with <2 γ-tubulin foci) and the NT only partially (32.6 ± 3.8%), the h5- mutant generated a CCC defect even in the siControl (27.6 ± 2.3%) and a stronger CCC phenotype in the siCEP44 (76.1 ± 2.6%). Data presented as mean ± s.d., all statistics derived from two-tail unpaired t-test analysis of n = 6 biologically independent experiments. (a, b, c, d, f, scale bars: 1 μm; g, scale bar: 100 nm; j, scale bar 10 μm, magnification scale bar: 1 μm). (ac, eg, k) Source data are provided as a Source Data file.
Fig. 5
Fig. 5. CEP295 stabilises new dCs.
a IF of siControl, siCEP295 and siCEP44 depletion samples untreated (upper 3 panels) and treated with cold (upper 3 panels). Similarly to control cells, in both cold treated and untreated siCEP44 samples G1 cells contained 2 centrioles (judged by centrin1 signals). In untreated siCEP295 cells, centrioles showed already a degree of instability (<2 centrin1 foci in 21.4 ± 5.0% of the G1 cells (Cenp-F in Supplementary Fig. 10b), which became more pronounced if the cells were exposed to cold treatment (<2 centrin1 foci in 39.3 ± 5.2% of the G1 cells (Cenp-F in Supplementary Fig. 10b). b Quantification of a. c, d SASS-6 is removed successfully in all (d, 100% of cells with no SASS-6 foci) G1 cells (Cenp-F in Supplementary Fig. 10c) in control, CEP44 and CEP295 siRNA samples. Note, the lower cell in the siControl is Cenp-F positive (Supplementary Fig. 10c) and so in G2 and therefore carries a SASS-6 signal. The enlargements in the siControl are from the upper Cenp-F negative cell. e IF of late G2 (Cenp-F positive and separated centrosomes) U2OS cells in which the expression of Myc-PLK4 was induced upon siRNA treatment. In siCEP295 and siCEP44 cells the rosette generated upon Myc-PLK4 overexpression showed a shorter diameter in comparison to control cells rosette. f Quantifications of e. Control rosette diameter 1.0 ± 0.1 μm, CEP295 depletion 0.7 ± 0.1 μm and CEP44 depletion 0.8 ± 0.1 μm. (a, c, e, scale bars: 10 μm, magnification scale bars: 1 μm; b, d and f data are presented as mean ± s.d., all statistics were derived from two-tail unpaired t-test analysis of n = 6 biologically independent experiments and source data are provided as a Source Data file).
Fig. 6
Fig. 6. Conversion molecules provide structural integrity of centrioles.
a IF samples of cells treated with siControl, siCEP295, siCEP44 or siPOC1B. Depletions of siCEP295, siCEP44 or siPOC1B generated G1 cells (Cenp-F in Supplementary Fig. 11b) with <2 centriole glutamylation foci (GT335 signals) different from siControl. b Quantifications of a. 62.4 ± 3.0% of G1 siCEP295 cells showed <2 GT335 foci; 41.2 ± 2.2% in siCEP44 cells; 21.3 ± 3.5% in siPOC1B cells. Data are presented as mean ± s.d., statistics were derived from two-tail unpaired t-test analysis of n = 6 biologically independent experiments and source data are provided as a Source Data file. c Scheme of the experimental procedure of the EM analysis of dCs. dg EM images of turned and tilted sections of proximal region of daughter centrosomes in G1. The two values on the top of the image give the sample turning and tilting degrees, respectively. Red arrowheads indicate open structural defects (A-C linker absent), while yellow ones highlight defects of triplets. The side table (right) shows quantification of the number of cells showing these defects. While in d G1 siControl cells there was no structural defect, in e siCEP295, f siCEP44 and g siPOC1B G1 cells dCs showed defects in the triplets and A-C linker formation. (a scale bar: 10 μm, magnification scale bar: 1 μm; dg, scale bars: 100 nm).
Fig. 7
Fig. 7. Structural integrity of the centrioles ensures their conversion to centrosomes.
ac EM images of turned and tilted sections of proximal region of daughter centrosomes in G1. The two values on the top of the image give the turning and tilting degree of the sample, respectively. Red arrowheads indicate open structural defects (A–C linker absent), while yellow ones highlight defects of triplets. The side table (right) shows quantification of the number of cells showing these defects. While in a G1 siControl cells had no structural defects, in b siTUBD1 and c siTUBE1 G1 dCs showed defects in triplet formation (yellow arrow). b siTUBD1 G1 cell with defect in the A–C linker formation on top of the triplet formation of dCs and lack of triplet MTs (red arrow). d Depletion of TUBD1 and TUBE1 proteins also generated reduced glutamylation of the centrioles as judged by GT335 staining (36.7 ± 2.2% of G1 cells, Cenp-F in Supplementary Fig. 12a) with <2 GT335 foci in siTUBE1 sample; 23.5 ± 2.0% for siTUBD1). e Quantification of d. f In absence TUBE1 or TUBD1 many centrioles in G1 cells (Cenp-F in Supplementary Fig. 12b) did not efficiently acquire PCM (<2 γ-tubulin defined foci) to convert to centrosomes. g Quantification of f. 33.1 ± 1.3% of cells with <2 γ-tubulin foci in G1 for siTUBE1; 26.2 ± 4.1% for siTUBD1. (ac, scale bars: 100 nm; d, f scale bars: 10 μm, magnification scale bars: 1 μm; e, g data are presented as mean ± s.d., all statistics were derived from two-tail unpaired t-test analysis of n = 6 biologically independent experiments and source data are provided as a Source Data file). h Model of the dependency of CCC mechanism on the correct centriolar wall maturation. See Discussion for description.

References

    1. Bornens M. The Centrosome in Cells and Organisms. Science. 2012;335(6067):422–426. doi: 10.1126/science.1209037. - DOI - PubMed
    1. Conduit PT, Wainman A, Raff JW. Centrosome function and assembly in animal cells. Nat. Rev. Mol. Cell Biol. 2015;16:611–624. doi: 10.1038/nrm4062. - DOI - PubMed
    1. Azimzadeh J, Marshall WF. Building the centriole. Curr. Biol. 2010;20:R816–R825. doi: 10.1016/j.cub.2010.08.010. - DOI - PMC - PubMed
    1. Fu J, Glover DM. Structured illumination of the interface between centriole and peri-centriolar material. Open Biol. 2012;2:120104. doi: 10.1098/rsob.120104. - DOI - PMC - PubMed
    1. Lawo S, Hasegan M, Gupta GD, Pelletier L. Subdiffraction imaging of centrosomes reveals higher-order organizational features of pericentriolar material. Nat. Cell Biol. 2012;14:1148–1158. doi: 10.1038/ncb2591. - DOI - PubMed

Publication types