

Globe thermometer free convection error potentials
- PMID: 32060327
- PMCID: PMC7021705
- DOI: 10.1038/s41598-020-59441-1
Globe thermometer free convection error potentials
Abstract
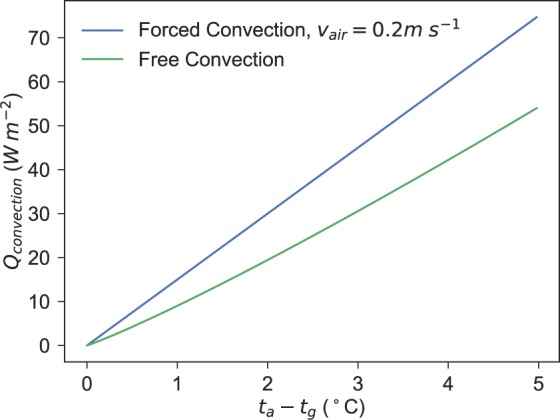
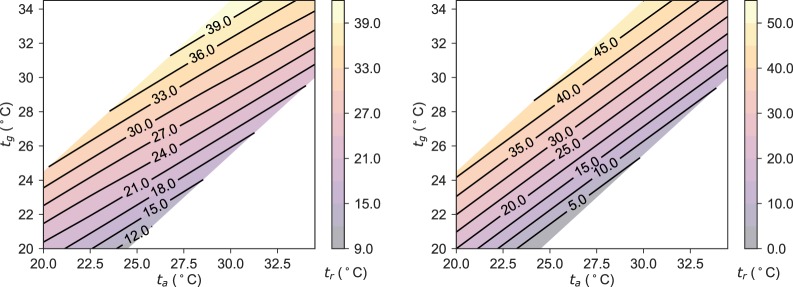
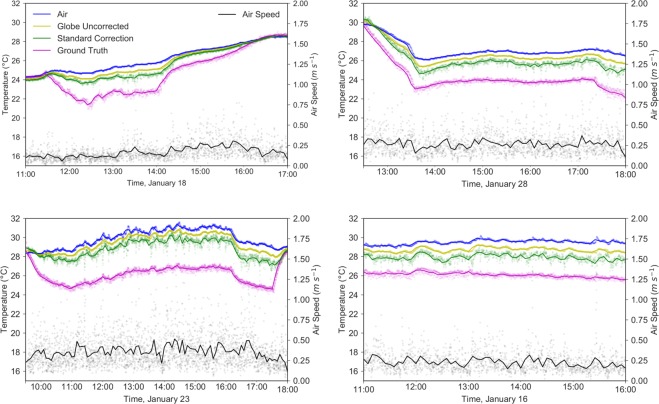
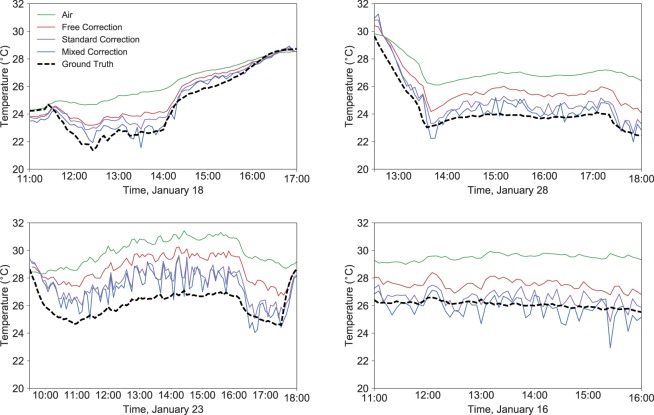
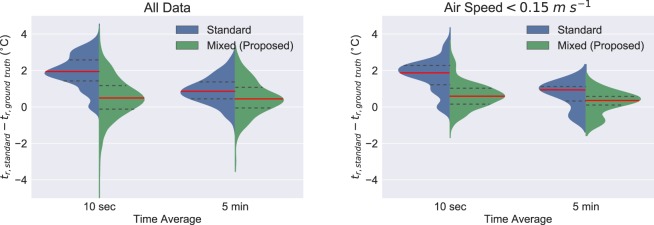
For thermal comfort research, globe thermometers have become the de facto tool for mean radiant temperature, tr, measurement. They provide a quick means to survey the radiant environment in a space with nearly a century of trials to reassure researchers. However, as more complexity is introduced to built environments, we must reassess the accuracy of globe measurements. In particular, corrections for globe readings taking wind into account rely on a forced convection heat transfer coefficient. In this study, we investigate potential errors introduced by buoyancy driven flow, or free convection, induced by radiant forcing of a black globe's surface to a temperature different from the air. We discovered this error in an experimental radiant cooling system with high separation of air to radiant temperature. Empirical simulations and the data collected in a radiant cooling setup together demonstrate the influence of free convection on the instrument's readings. Initial simulation and data show that tr measurements neglecting free convection when calculating tr from air temperatures of 2 K above tr could introduce a mechanism for globe readings to incorrectly track air temperatures. The experimental data constructed to test this hypothesis showed the standard correction readings are 1.94 ± 0.90 °C higher than the ground truth readings for all measurements taken in the experiment. The proposed mixed convection correction is 0.51 ± 1.07 °C higher than the ground truth, and is most accurate at low air speeds, within 0.25 ± 0.60 °C. This implies a potential systematic error in millions of measurements over the past 30 years of thermal comfort research. Future work will be carried out to experimentally validate this framework in a controlled climate chamber environment, examining the tradeoffs between accuracy and precision with globe thermometer measurements.
Conflict of interest statement
Authors E.T. and F.M. (formerly) and N.H. (currently) were on the board of directors of a startup company attempting to commercialize competing technology.
Figures


References
-
- Carrier WH. Rational psychometric formulae. Trans. Am. Soc. Mech. Eng. 1911;33:1005.
-
- Fanger, P. O. Thermal comfort. Analysis and applications in environmental engineering. (Copenhagen: Danish Technical Press., 1970).
-
- Yagoglou C. Report of committee to consider the report of the new york state commission on ventilation. Am. Soc. Heat.Vent. Eng. 1924;30:254–256.
-
- McIntyre, D. A. & Griffiths, I.Radiant temperature and thermal comfort. vol. CIB Commission W45 (1972).
-
- Singapore, S. Singapore standard ss 554: 2009: Code of practice for indoor air quality for air-conditioned buildings. Building and Construction Standards Committe (2009).
Grants and funding
LinkOut - more resources
Full Text Sources
Miscellaneous
