. 2020 Feb 14;11(1):889.
doi: 10.1038/s41467-020-14734-x.

Exercise enhances skeletal muscle regeneration by promoting senescence in fibro-adipogenic progenitors

Affiliations

Exercise enhances skeletal muscle regeneration by promoting senescence in fibro-adipogenic progenitors

Yuki Saito et al. Nat Commun. .

Abstract

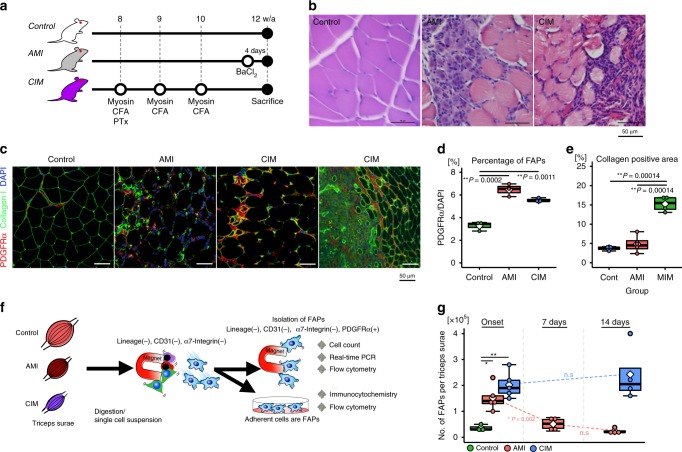
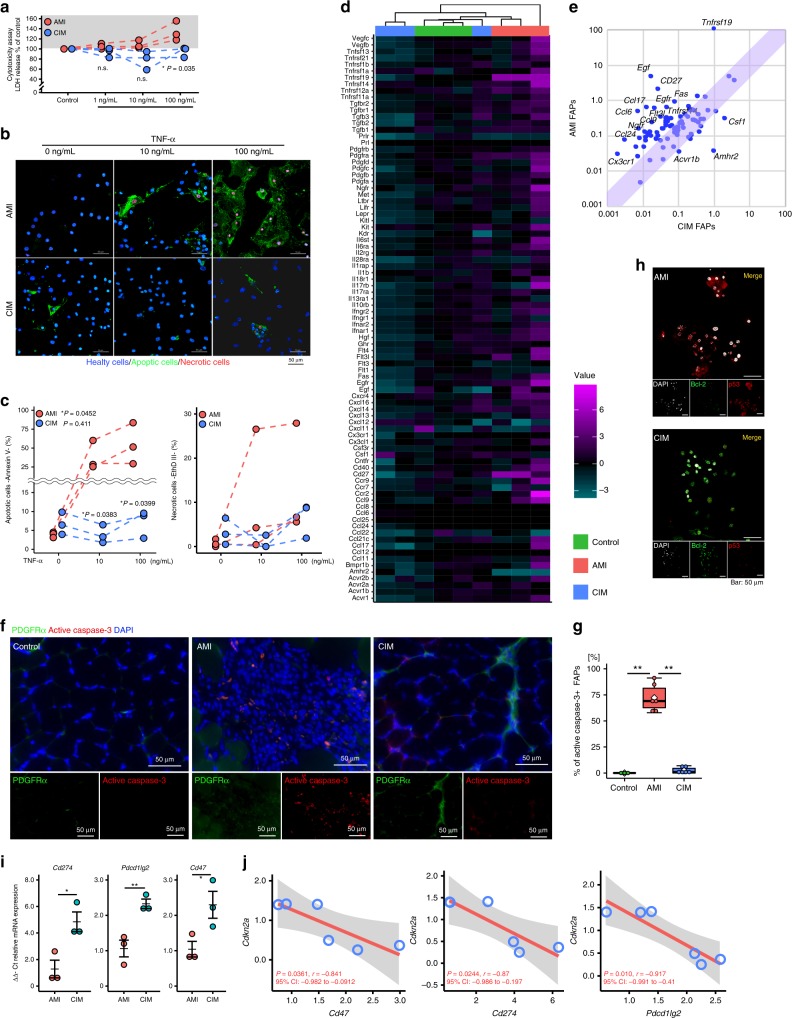
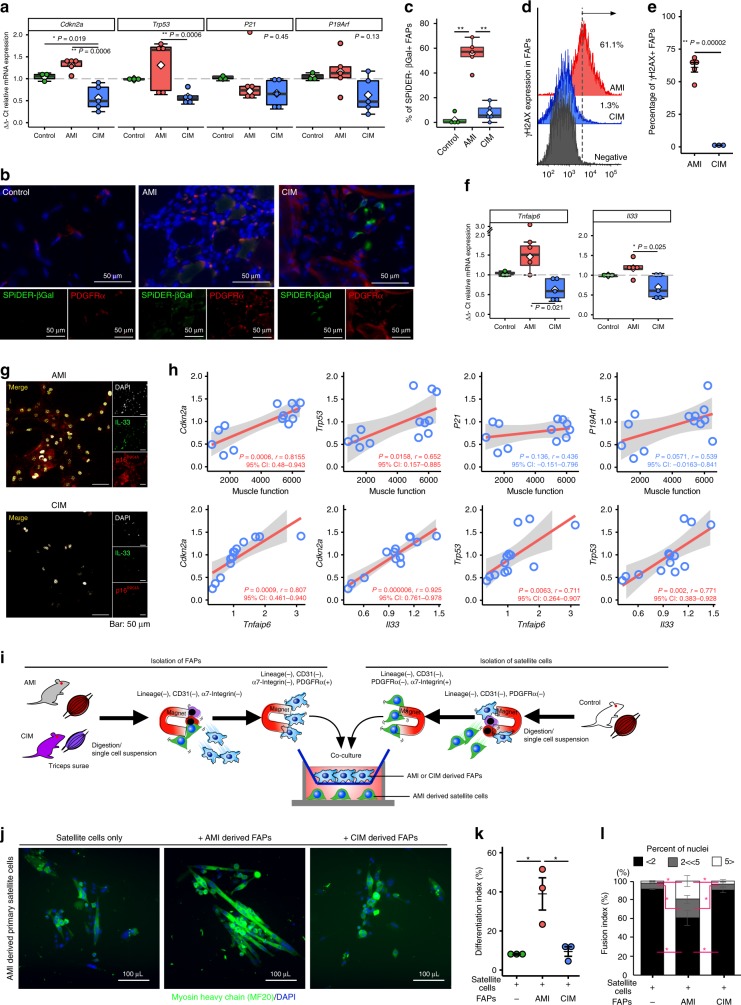
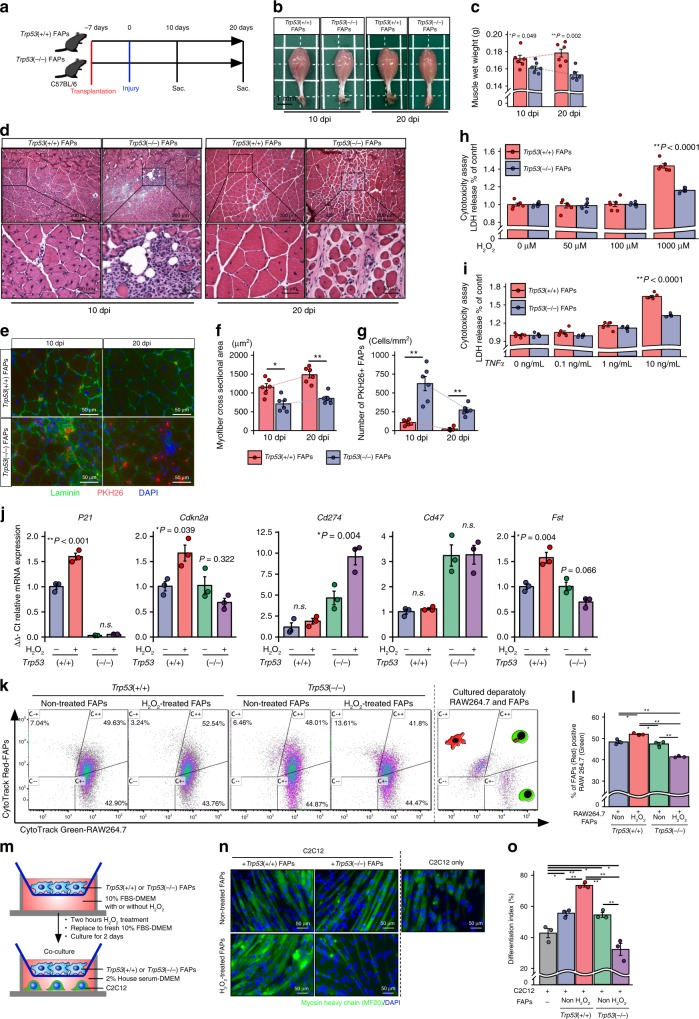
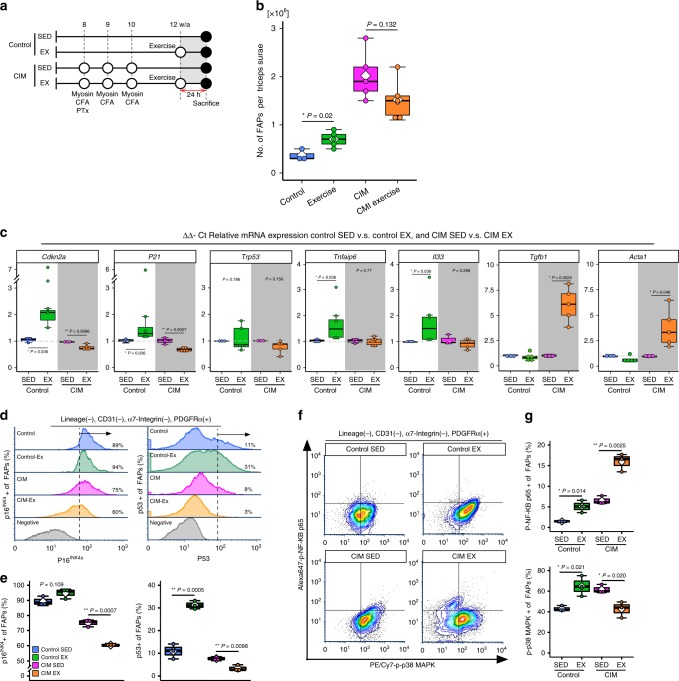
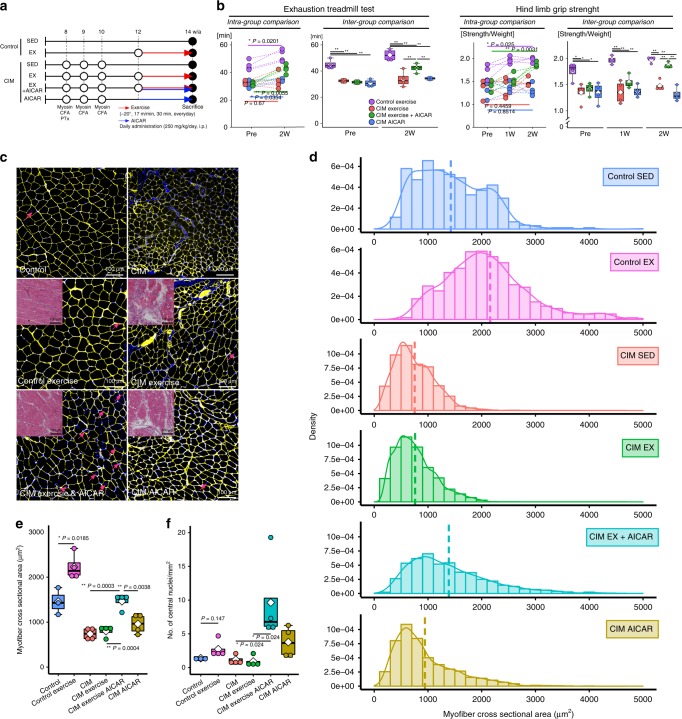
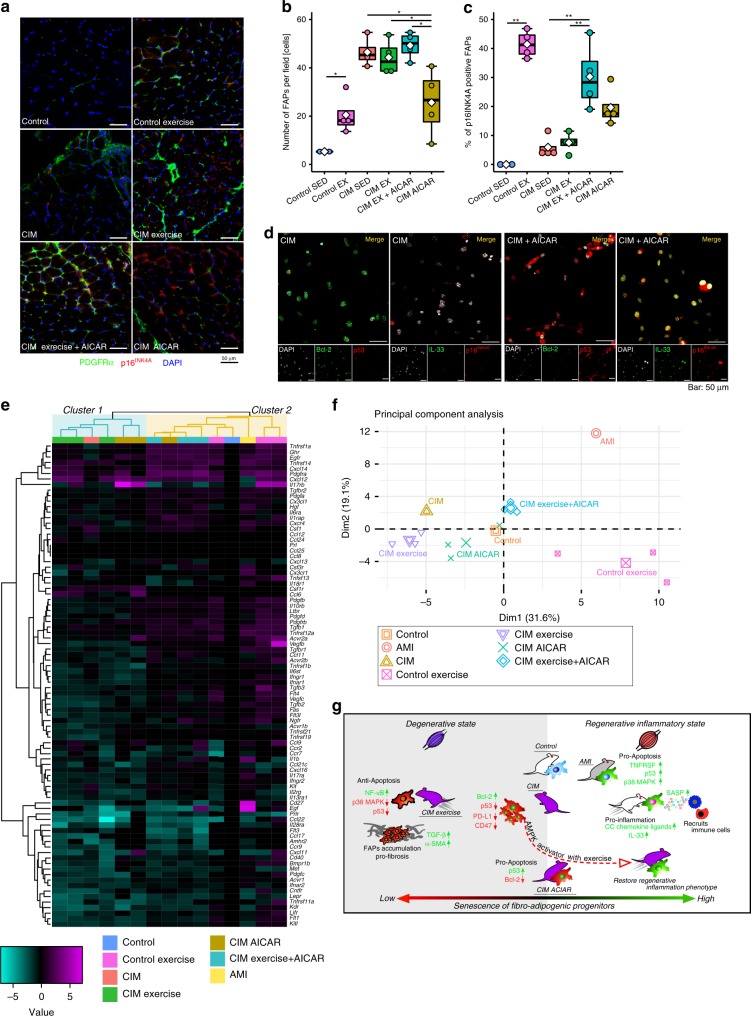
Idiopathic inflammatory myopathies cause progressive muscle weakness and degeneration. Since high-dose glucocorticoids might not lead to full recovery of muscle function, physical exercise is also an important intervention, but some exercises exacerbate chronic inflammation and muscle fibrosis. It is unknown how physical exercise can have both beneficial and detrimental effects in chronic myopathy. Here we show that senescence of fibro-adipogenic progenitors (FAPs) in response to exercise-induced muscle damage is needed to establish a state of regenerative inflammation that induces muscle regeneration. In chronic inflammatory myopathy model mice, exercise does not promote FAP senescence or resistance against tumor necrosis factor-mediated apoptosis. Pro-senescent intervention combining exercise and pharmacological AMPK activation reverses FAP apoptosis resistance and improves muscle function and regeneration. Our results demonstrate that the absence of FAP senescence after exercise leads to muscle degeneration with FAP accumulation. FAP-targeted pro-senescent interventions with exercise and pharmacological AMPK activation may constitute a therapeutic strategy for chronic inflammatory myopathy.


Conflict of interest statement

The authors declare no competing interests.

Figures

Fig. 1
Fig. 1. Fibro-adipogenic progenitor (FAP) accumulation is observed in chronic inflammatory myopathy model mice.
a Schematic diagram of the procedures used to establish the models of acute muscle injury (AMI) and chronic inflammatory myopathy (CIM). b Representative images of hematoxylin and eosin (H&E) staining of muscle from control, AMI, and CIM mice. Regenerating myofibers with central nuclei are observed in AMI muscle, while interstitial fibrosis and inflammatory cell infiltration are observed in CIM muscle. c, d Representative images of PDGFRα- and type I collagen-immunostained triceps surae (c), and quantification of the percentage of PDGFRα+ FAPs and fibrotic areas with collagen deposition in randomly chosen fields of view (n = 3 per group) (d, e). f Schematic diagram of the FAP isolation procedure. g The number of magnetic bead-sorted FAPs marked as lineage-negative (Lin−), CD31−, α7-integrin−, and PDGFRα+ in control, AMI, and CIM mice (n = 3 for control, n = 5 for AMI and CIM). Quantitative data are shown as means as well as medians with IQRs and 1.5 times the IQR, and are displayed by dot plot and box and whisker plot. P values were determined by one-way ANOVA adjusted by the Holm method (*P < 0.05, **P < 0.001). NS, not significant.
Fig. 2
Fig. 2. FAPs derived from chronic inflammatory myopathy model mice acquired features of apoptosis resistance.
a Cytotoxicity assay shows the LDH release level after stimulation with different concentrations of TNF-α in FAPs isolated from AMI and CIM (n = 3 per group). b, c Representative image of FITC-Annexin V (green) and ethidium homodimer III (red) after stimulation with 1, 10, and 100 ng/mL of TNF-α, and the quantified data. The number of Annexin V+, apoptotic FAPs increased in a dose-dependent fashion with the addition of TNF-α in AMI, but not in CIM mice (n = 3 per group). d, e Hierarchical clustering of differentially expressed cytokine–cytokine receptor gene expression was profiled by PrimerArray® analysis in control, AMI, and CIM mice (n = 3 per group) (d). Genes with higher expression are depicted in magenta, genes with lower expression are depicted in cyan, and genes with no difference are depicted in black (d). Scatterplots of gene expression changes in AMI-FAPs (n = 3) compared with CIM-FAPs (n = 3) (e). f, g Representative images of PDGFRα- and active caspase-3-immunostained triceps surae in control, AMI, and CIM mice (f), and quantification of the percentage of active caspase-3-positive FAPs in randomly chosen fields of view (g). h Representative confocal images of Bcl-2- and p53-immunostained FAPs isolated from AMI and CIM. i mRNA expression of Cd274, Pdcd1lg2, and Cd47 in FAPs isolated from AMI and CIM mice (n = 3 per group). j Correlation of Cd274, Pdcd1lg2, and Cd47 mRNA expression with Cdkn2a mRNA expression in FAPs isolated from AMI and CIM mice. Quantitative data for each specimen are shown in a dot plot. P values were determined by one-way ANOVA adjusted by the Holm method (*P < 0.05, **P < 0.001). NS, not significant.
Fig. 3
Fig. 3. FAPs acquire senescent features after acute muscle injury.
a Relative mRNA expression of senescence-related genes (Cdkn2a, Trp53, P21, and P19Arf) in FAPs from control (n = 3), AMI (n = 5), and CIM (n = 5) mice. b, c Representative images of SPiDER-β-gal- and PDGFRα-immunostained triceps surae (b), and quantification of the percentage of SPiDER-β-gal-positive FAPs in randomly chosen fields of view in control (n = 3), AMI (n = 5), and CIM (n = 5) (c) mice. d, e Representative γH2AX histograms from n = 3 replicates (d), and quantification of percentages of γH2AX+ FAPs (e). f Relative mRNA expression of Tnfaip6 and Il33 in FAPs from control (n = 3), AMI (n = 5), and CIM (n = 5) mice. g Representative confocal images of IL-33- and p16INK4A-immunostained FAPs isolated from AMI and CIM. h Correlation of Cdkn2a, Trp53, P21, and P19Arf mRNA expression with muscle function, and Tnfaip6 and Il33 mRNA expression in FAPs isolated from normal, AMI, and CIM mice. i Schematic diagram of satellite cells co-cultured in transwells with FAPs from AMI and CIM mice. jl Representative images of MyHC (green) and DAPI (blue) after a 7-day transwell co-culture with or without FAPs (j), and quantification of myogenic differentiation of satellite cells assessed by the differentiation index and fusion index (k, l) (n = 3 per group). Quantitative data are shown as means as well as medians with IQRs and 1.5 times the IQR, and are displayed by dot plots and box and whisker plots, or shown as means ± SEM (dot plot). P values were determined by two-tailed Student’s t test or one-way ANOVA adjusted by the Holm method (*P < 0.05, **P < 0.001).
Fig. 4
Fig. 4. Trp53(−/−) FAP transplantation impairs muscle regeneration after acute muscle injury.
a Schematic diagram of the procedures for Trp53(+/+) or Trp53(−/−) FAP transplantation and BaCl2-induced muscle injury. b, c Representative macro images of triceps surae at 10 and 20 days post injury (dpi) (b), and quantitative data of muscle wet weight (c) (n = 6 per group). d Representative images of H&E staining of muscle transplanted with Trp53(+/+) or Trp53(−/−) FAPs. eg Representative images of PKH26-labeled FAPs and laminin-immunostained triceps surae (e), and quantitative data of the muscle cross-section area and the number of PKH26+-transplanted FAPs (f, g) (n = 3 per group). h, i The LDH release level after stimulation with different concentrations of H2O2 or TNF-α in Trp53(+/+) or Trp53(−/−) FAPs. j Relative mRNA expression of P21, Cdkn2a, Cd274, Cd47, and follistatin in Trp53(+/+) or Trp53(−/−) FAPs with or without H2O2 stimulation (n = 3 per group). k, l Representative CytoTrack Green-labeled RAW264.7 and CytoTrack Red-labeled FAPs plots after co-culture with RAW264.7 and FAPs (k), and quantification of the percentages of double-positive cells (l) (n = 3 per group). m Schematic diagram of the procedure for the C2C12 and FAPs co-culture experiment. n, o Representative images of MyHC and DAPI staining of C2C12 (n), and the quantification of myogenic differentiation of C2C12 assessed by the differentiation index (o) (n = 3 per group). Quantitative data are shown as mean ± SE with dot plots. P values were determined by the paired t test or one-way ANOVA adjusted by the Holm method (*P < 0.05, **P < 0.001). NS, not significant.
Fig. 5
Fig. 5. Exercise-induced senescence is observed in normal mice.
a Protocols for the CIM model and exercise intervention. b The number of FAPs in sedentary (n = 3) vs. exercise control mice (n = 5), and sedentary (n = 5) vs. exercise CIM mice (n = 5). c Relative mRNA expression of senescence-related genes (Cdkn2a, Trp53, and P21), pro-regenerative genes (Tnfaip6 and Il33), and pro-fibrotic genes (Tgfb1 and Acta1) in FAPs from sedentary control (n = 3), exercise control (n = 5), sedentary CIM (n = 3), and exercise CIM (n = 5) mice. d, g Flow cytometric analysis of p16INK4A, p53, phospho-p38 MAPK, and phospho-p65 NF-κB in FAPs from sedentary control, exercise control, sedentary CIM, and exercise CIM mice (n = 3 in each group). d Representative p16INK4A and p53 histograms from n = 3 replicates, and e quantification of the percentage of p16INK4A+or p53+ FAPs. f Representative phospho-p38 MAPK and phospho-p65 NF-κB contour plot from n = 3 replicates, and g quantification of the percentages of phospho-p38 MAPK+ and phospho-p65 NF-κB+ FAPs. Quantitative data are shown as means as well as medians with IQRs and 1.5 times the IQR, and are displayed by dot plots and box and whisker plots. P values were determined by the two-tailed Student’s t test (*P < 0.05, **P < 0.001).
Fig. 6
Fig. 6. Muscle strength restored in CIM mice by combined exercise and AICAR treatment.
a Protocol for 2-week therapeutic intervention with exercise and AICAR treatment in control and CIM mice. b Results of the exhaustion treadmill test and hind limb grip strength test are shown as intra- (left panel) and inter-group (right panel) comparisons (n = 3 per group). cf Changes in muscle cross-sectional area and number of regenerating muscle fibers in normal and CIM mice following exercise and/or AICAR treatment. c Representative images of H&E- and laminin-immunostained triceps surae (yellow) and nuclei (blue). Arrows indicate the central nuclei of regenerating muscle fibers. d The distribution of cross-sectional triceps surae fiber areas, with the mean area indicated by the dotted line. e, f Quantitative data of muscle cross-section area and the number of regenerating muscle fibers (n = 3 for control, n = 4 for exercise and CIM). Data are shown as a dot plot for each specimen, and as means as well as medians with IQRs and 1.5 times the IQR by dot plots and box and whisker plots. P values were determined by the paired t test or one-way ANOVA adjusted by the Holm method (*P < 0.05, **P < 0.001).
Fig. 7
Fig. 7. Exercise with AICAR treatment resulted in a pro-inflammatory and pro-apoptotic FAP phenotype that promotes muscle regeneration.
ac Representative images of PDGFRα- and p16INK4A-immunostained triceps surae (green and red, respectively) (a), and quantitative data of the number of FAPs (b) and the percentage of p16INK4A+ FAPs (c) in randomly chosen fields of view (n = 3 for control, n = 4 for exercise and CIM). d Representative confocal images of Bcl-2-, p53-, IL-33-, and p16INK4A-immunostained FAPs isolated from CIM with or without AICAR treatment in vitro. e Hierarchical clustering of differentially expressed cytokine–cytokine receptor gene expression was profiled by PrimerArray® analysis in control, AMI, and CIM mice (the average value is that shown in Fig. 2d; n = 3 per group), and control exercise, CIM exercise, CIM AICAR, and CIM exercise with AICAR (n = 3 per group). Genes with higher expression are depicted in magenta, genes with lower expression are depicted in cyan, and genes with no difference are depicted in black. f Principal component analysis (PCA) of FAPs isolated from control, control exercise, CIM, CIM exercise, CIM AICAR, and CIM exercise with AICAR. g Proposed mechanism whereby exercise-induced FAP senescence promotes muscle regeneration. Data are shown as a dot plot for each specimen, and as means as well as medians with IQRs and 1.5 times the IQR by dot plots and box and whisker plots. P values were determined by the one-way ANOVA adjusted by the Holm method (*P < 0.05, **P < 0.001).

References

    1. Longo DL, Dalakas MC. Inflammatory muscle diseases. N. Engl. J. Med. 2015;372:1734–1747. doi: 10.1056/NEJMe1502888. - DOI - PubMed
    1. Alexanderson H. Physical exercise as a treatment for adult and juvenile myositis. J. Intern. Med. 2016;280:75–96. doi: 10.1111/joim.12481. - DOI - PubMed
    1. Kim J, et al. Exercise-induced rhabdomyolysis mechanisms and prevention: a literature review. J. Sport Health Sci. 2015;5:324–333. doi: 10.1016/j.jshs.2015.01.012. - DOI - PMC - PubMed
    1. Camerino GM, et al. Gene expression in mdx mouse muscle in relation to age and exercise: aberrant mechanical-metabolic coupling and implications for pre-clinical studies in Duchenne muscular dystrophy. Hum. Mol. Genet. 2014;23:5720–5732. doi: 10.1093/hmg/ddu287. - DOI - PubMed
    1. Pessina P, et al. Novel and optimized strategies for inducing fibrosis in vivo: focus on Duchenne muscular dystrophy. Skelet. Muscle. 2014;4:7. doi: 10.1186/2044-5040-4-7. - DOI - PMC - PubMed

Publication types