. 2020 Jun;100(6):849-862.
doi: 10.1038/s41374-020-0408-5. Epub 2020 Feb 14.

Wolfram syndrome 1 gene regulates pathways maintaining beta-cell health and survival

Affiliations

Wolfram syndrome 1 gene regulates pathways maintaining beta-cell health and survival

Damien Abreu et al. Lab Invest. 2020 Jun.

Abstract

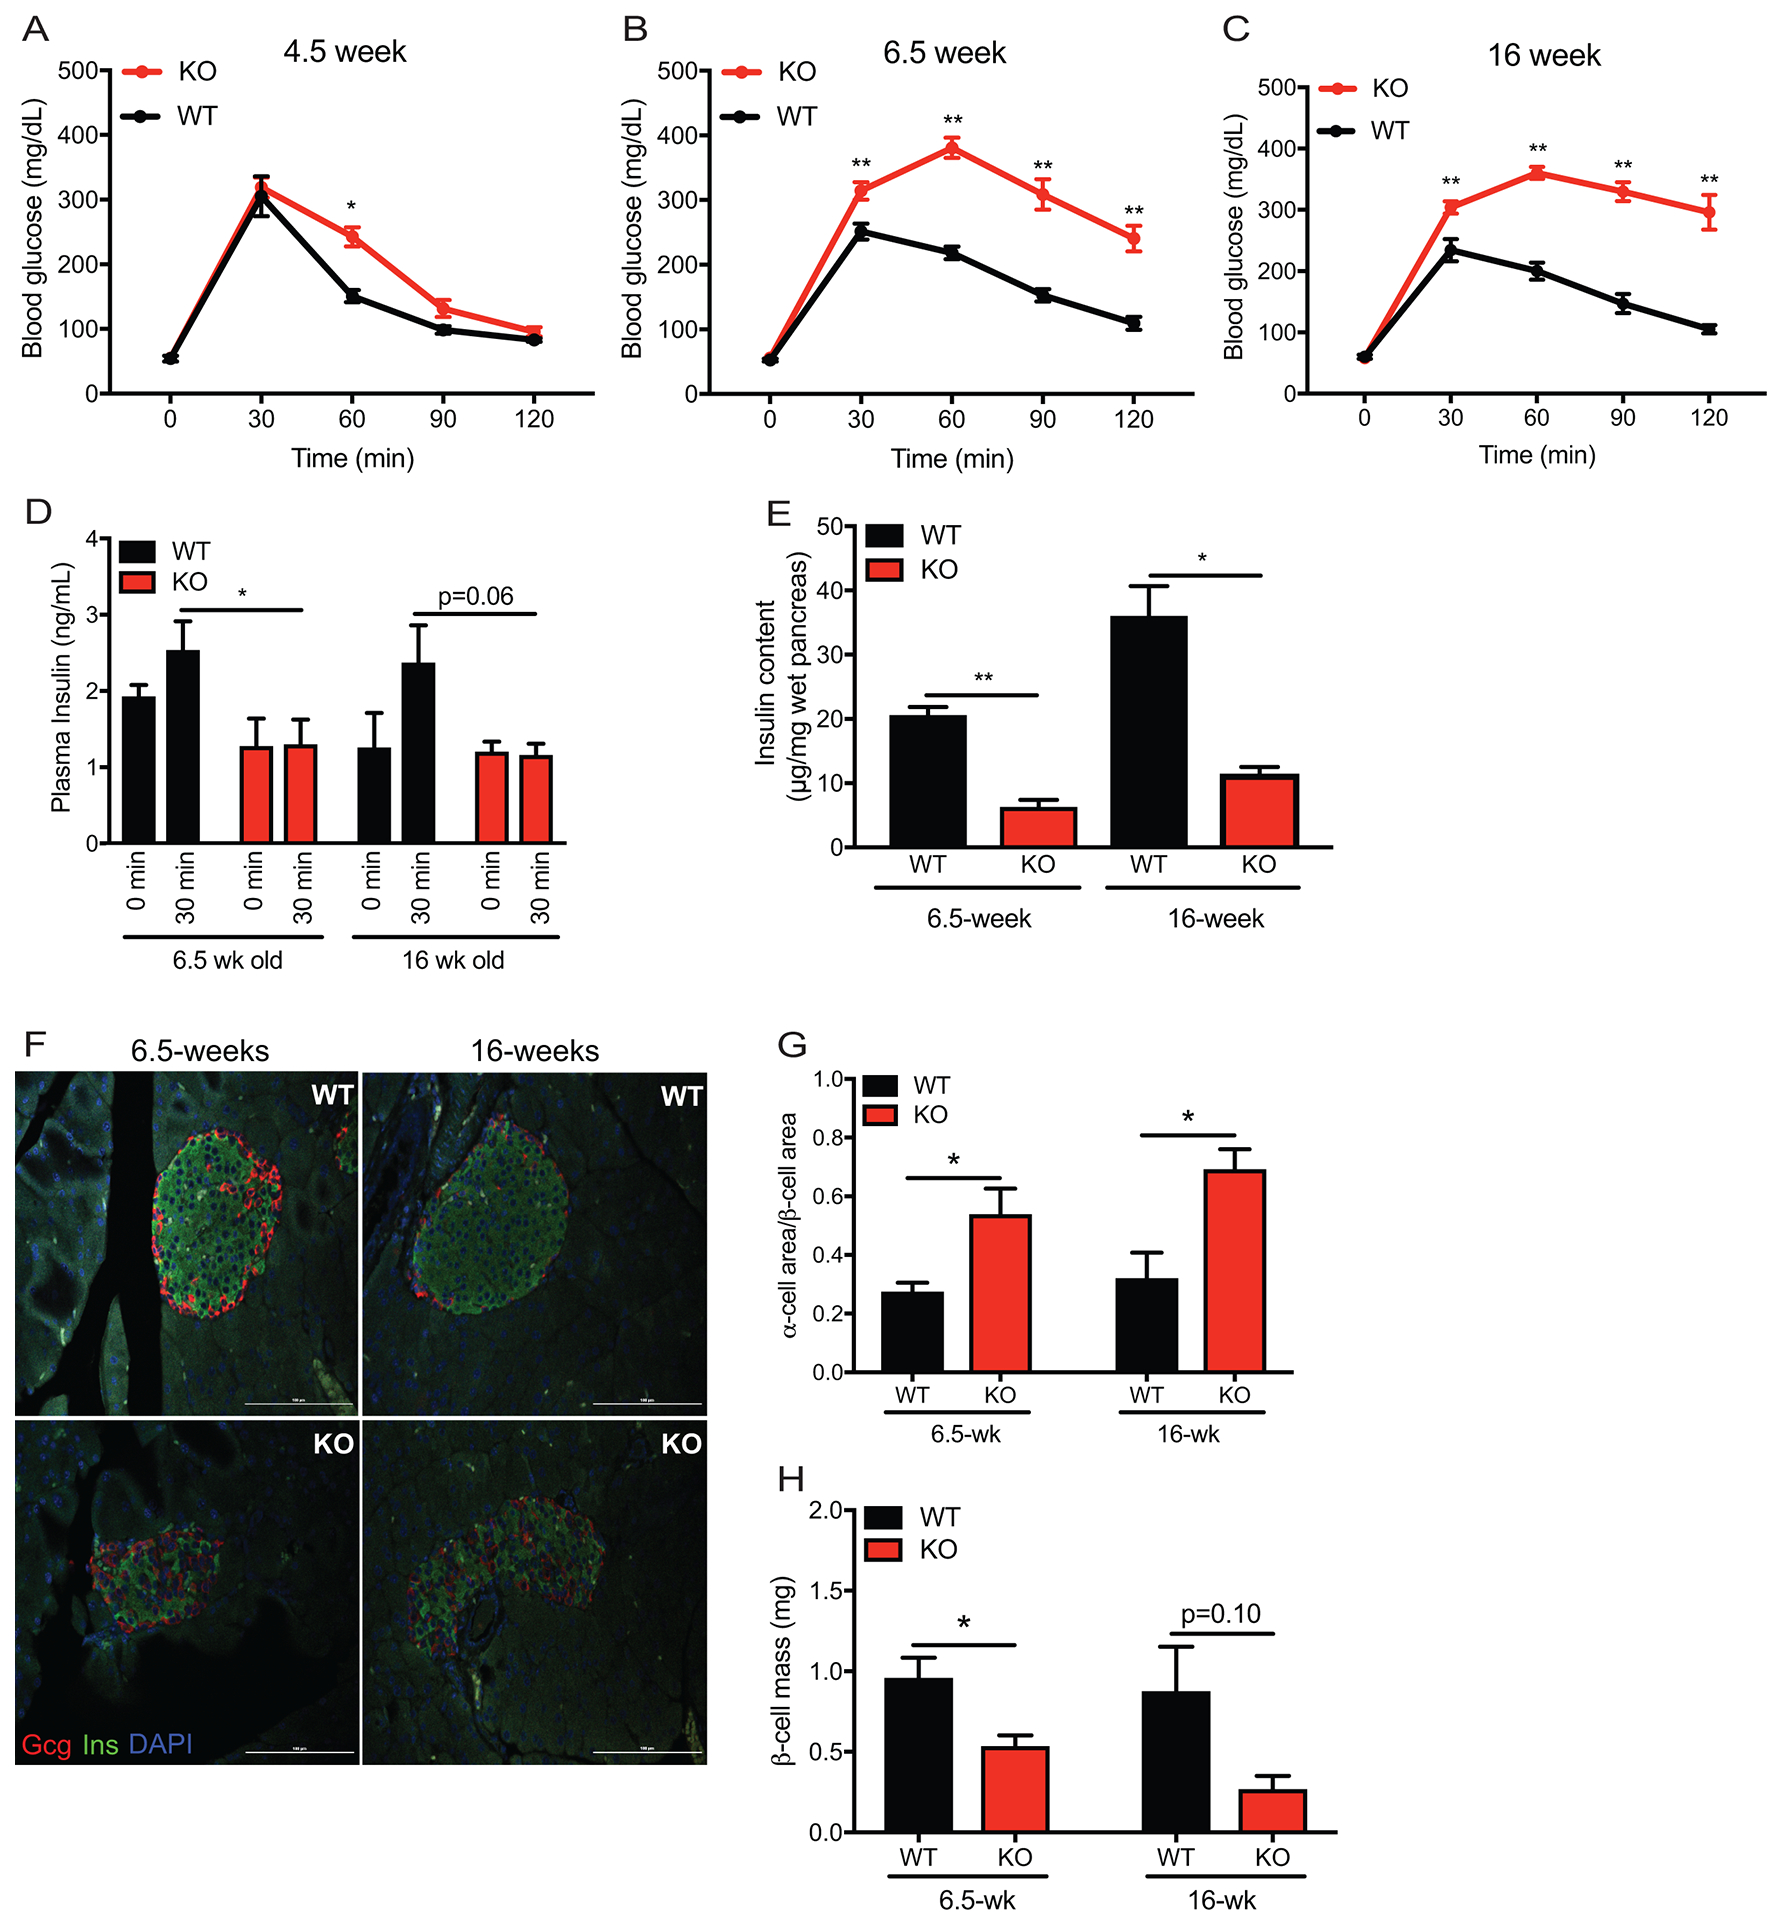
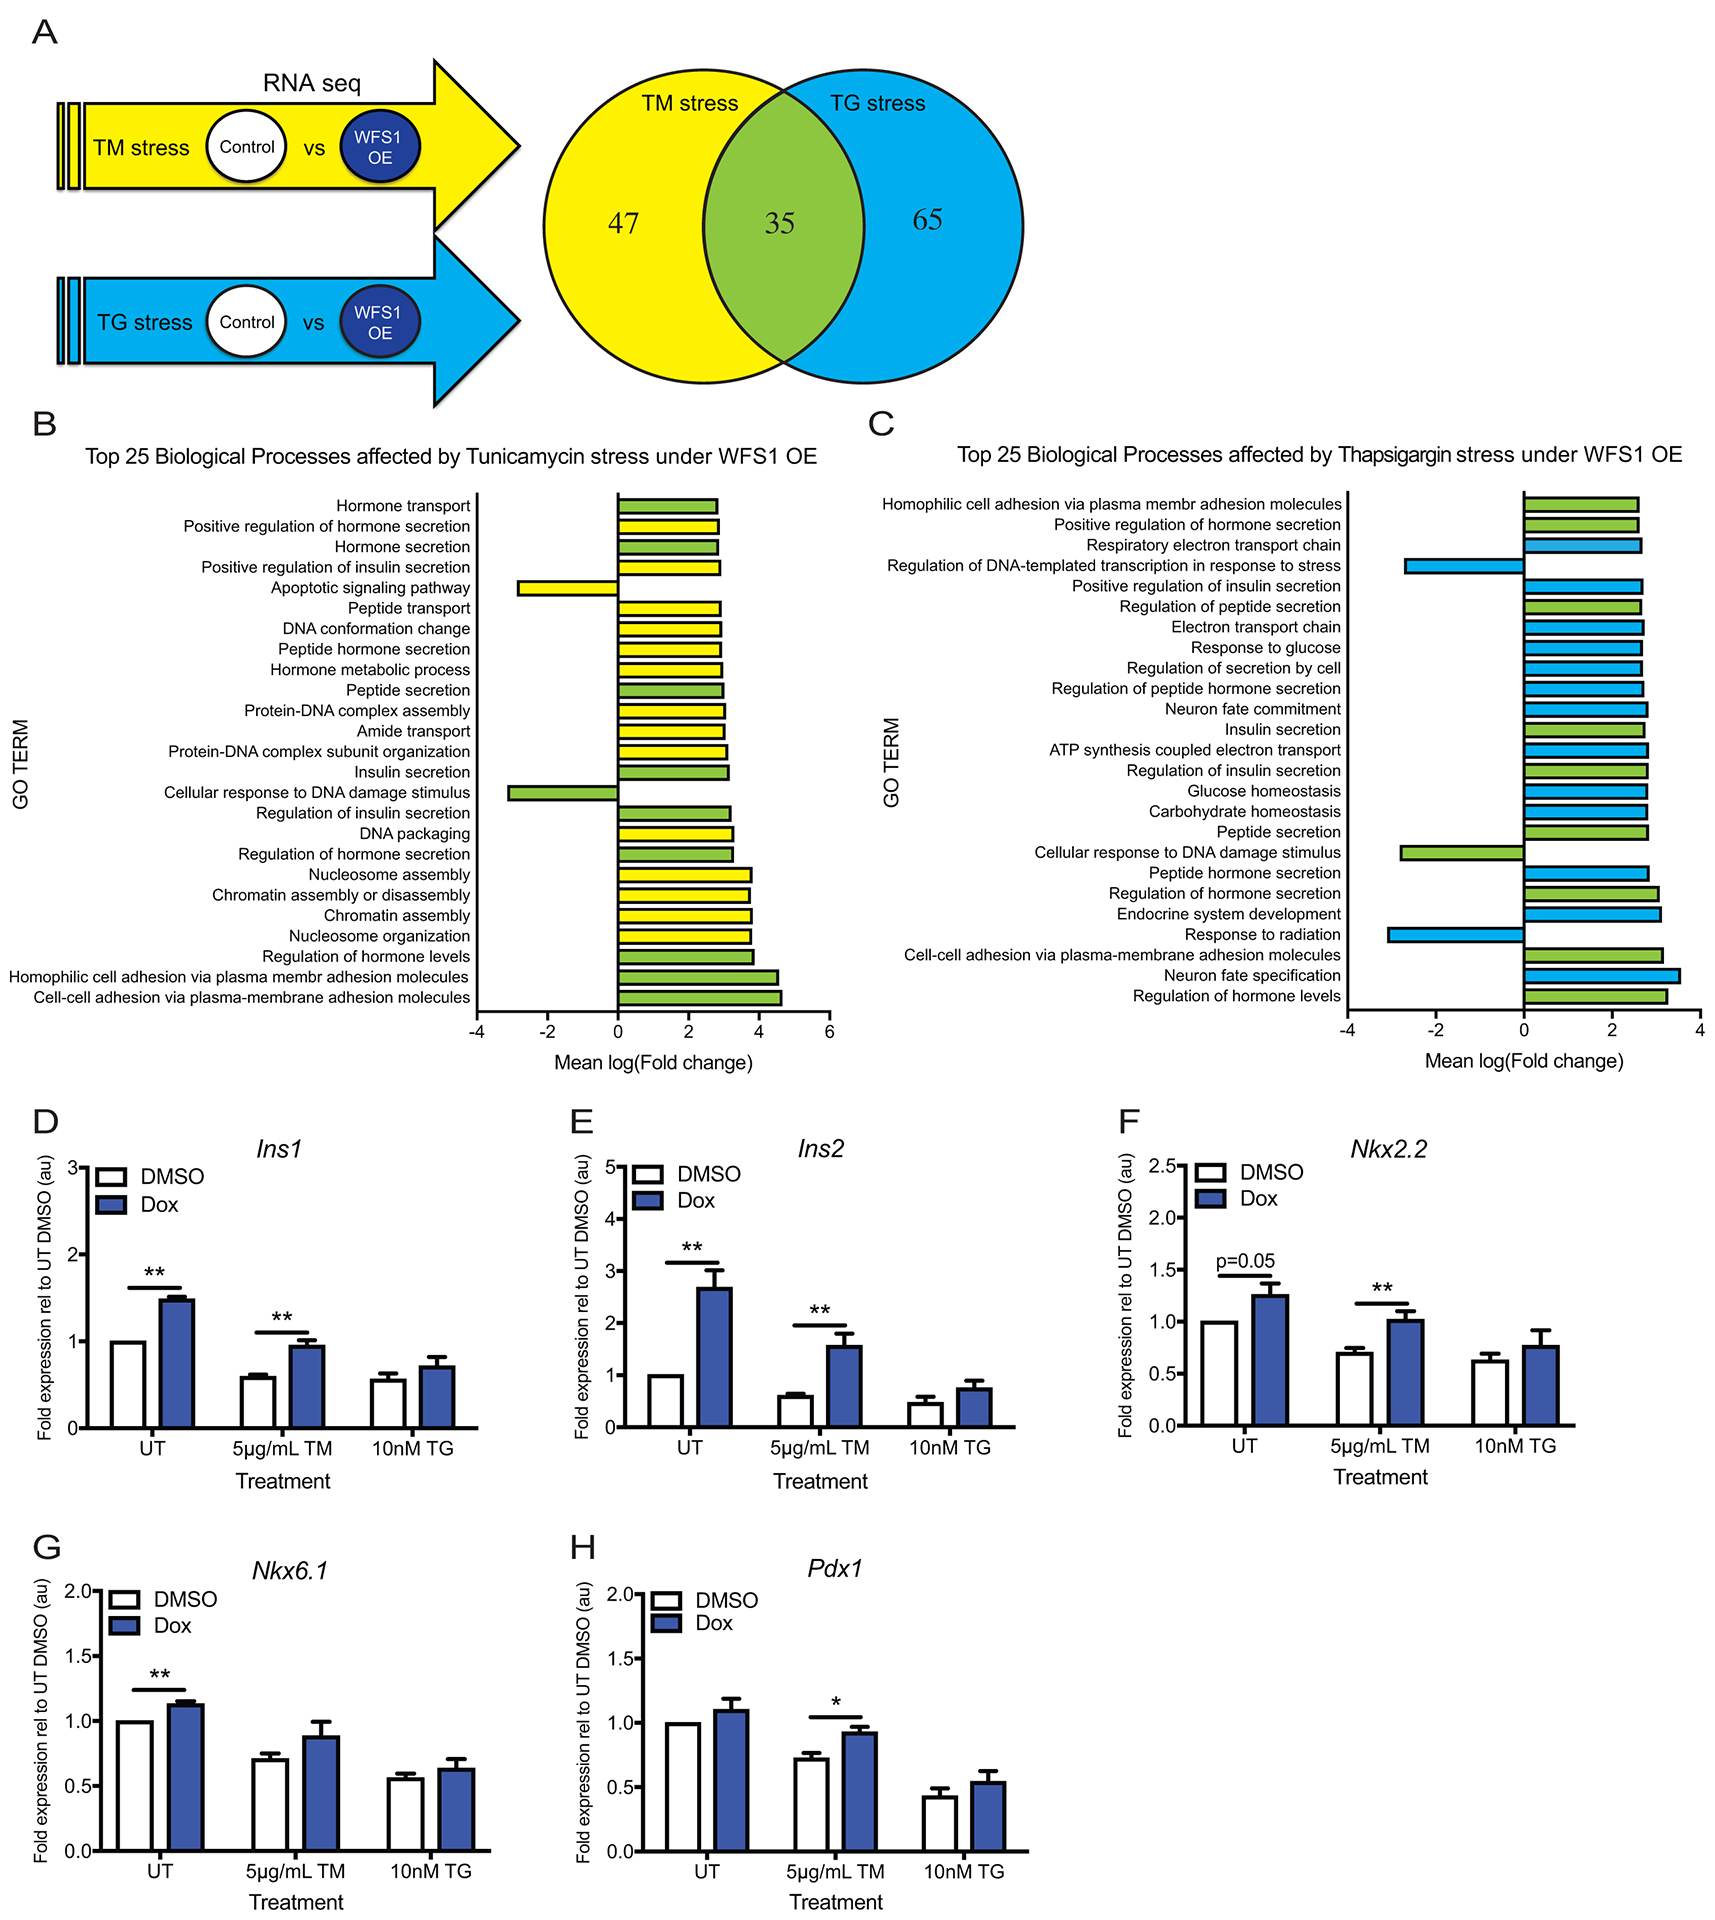
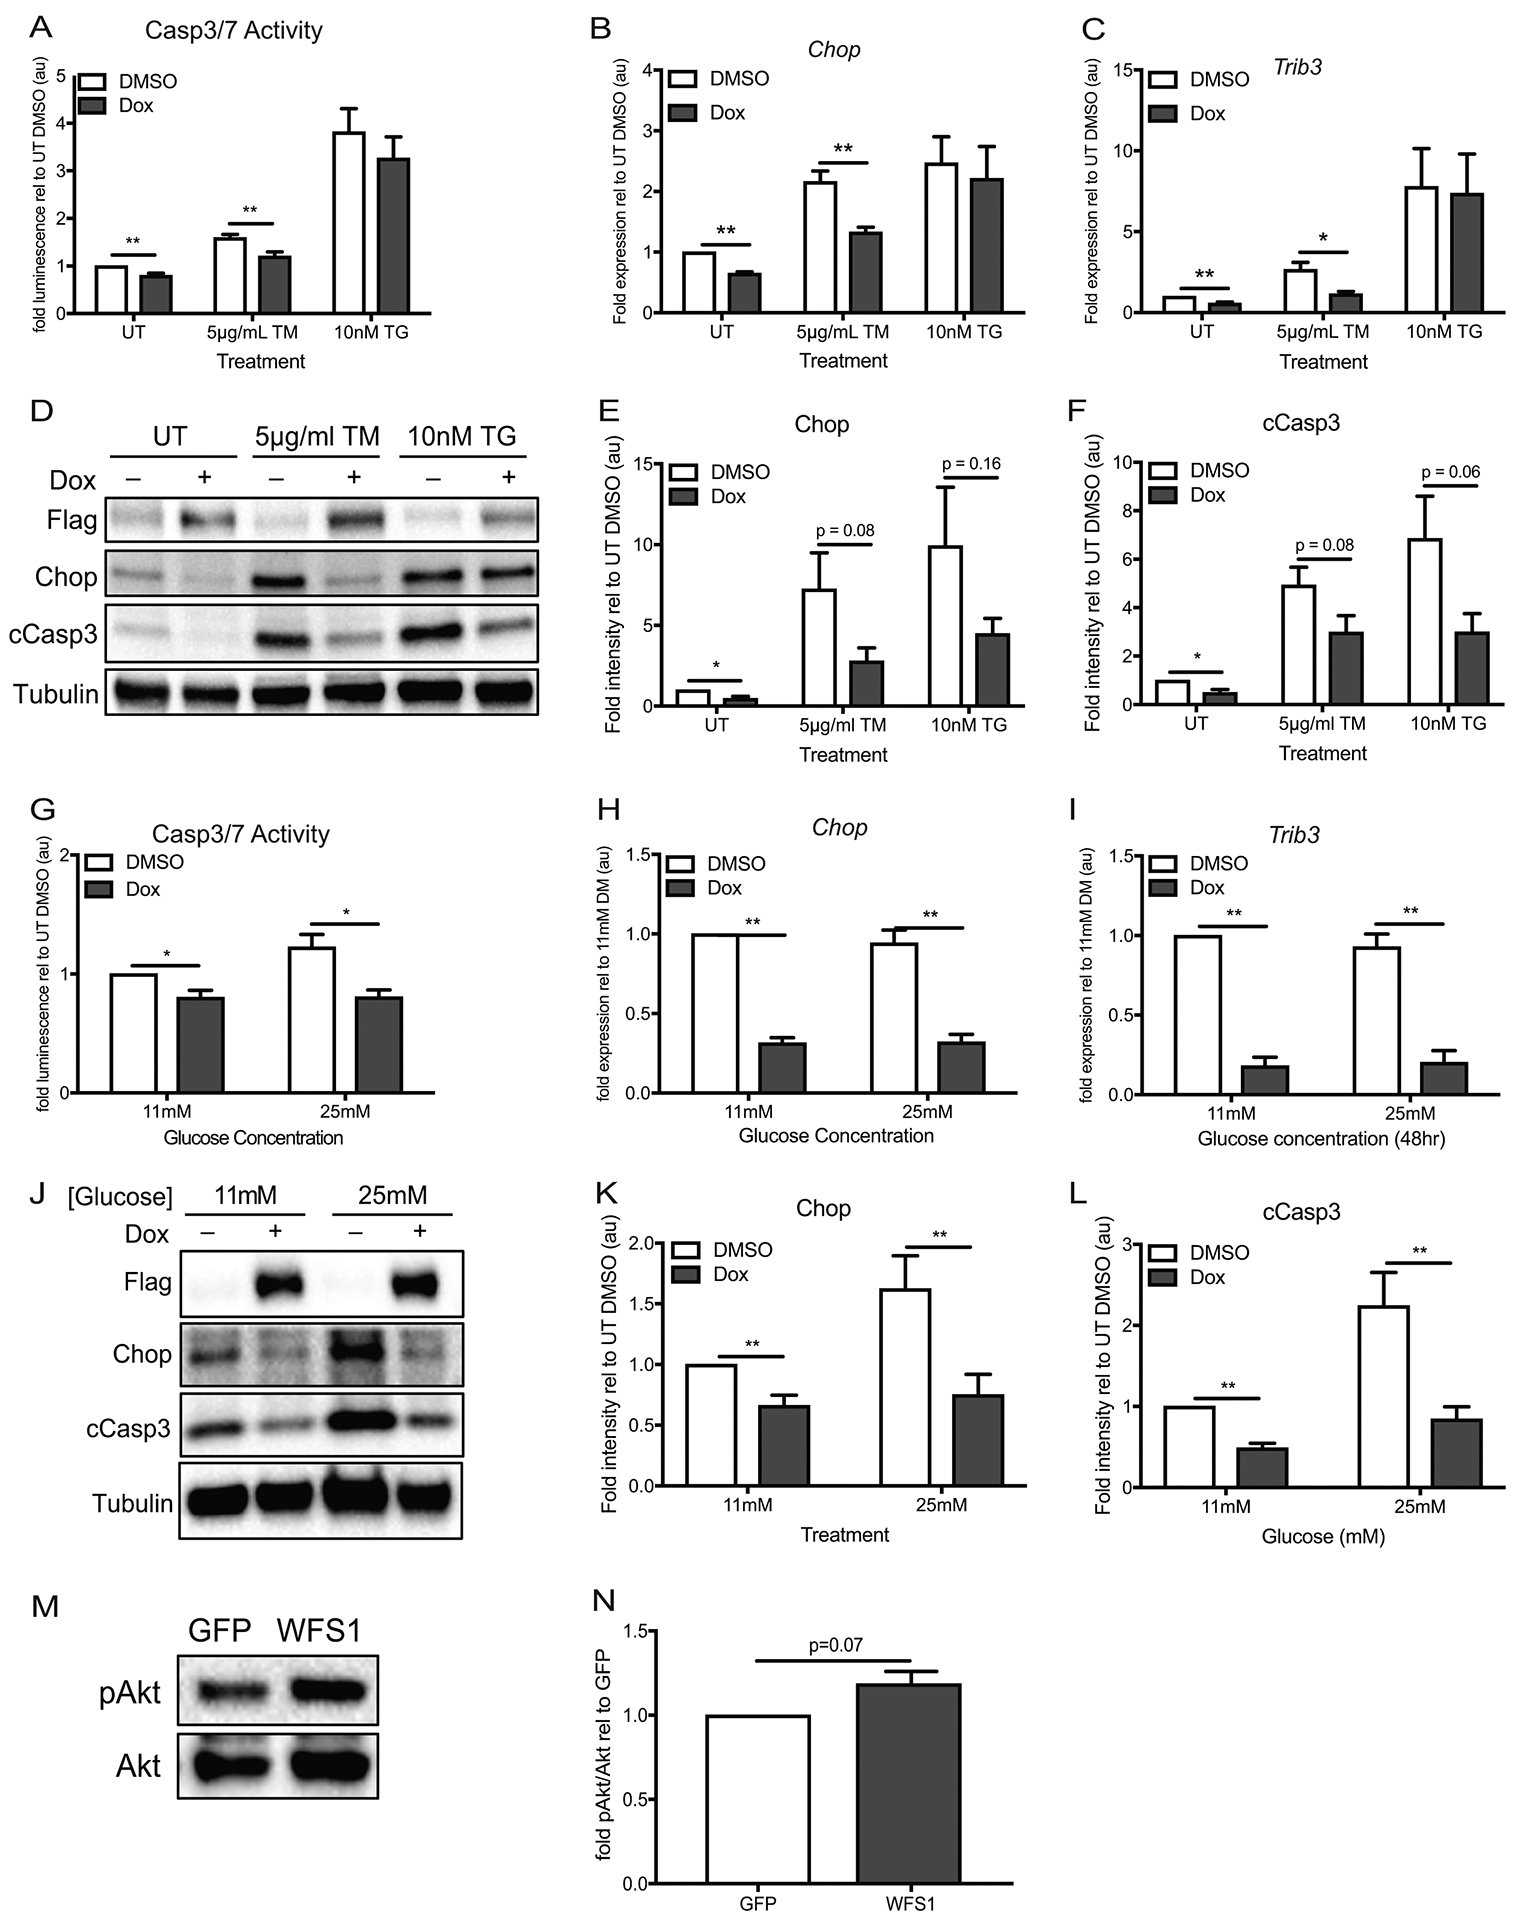
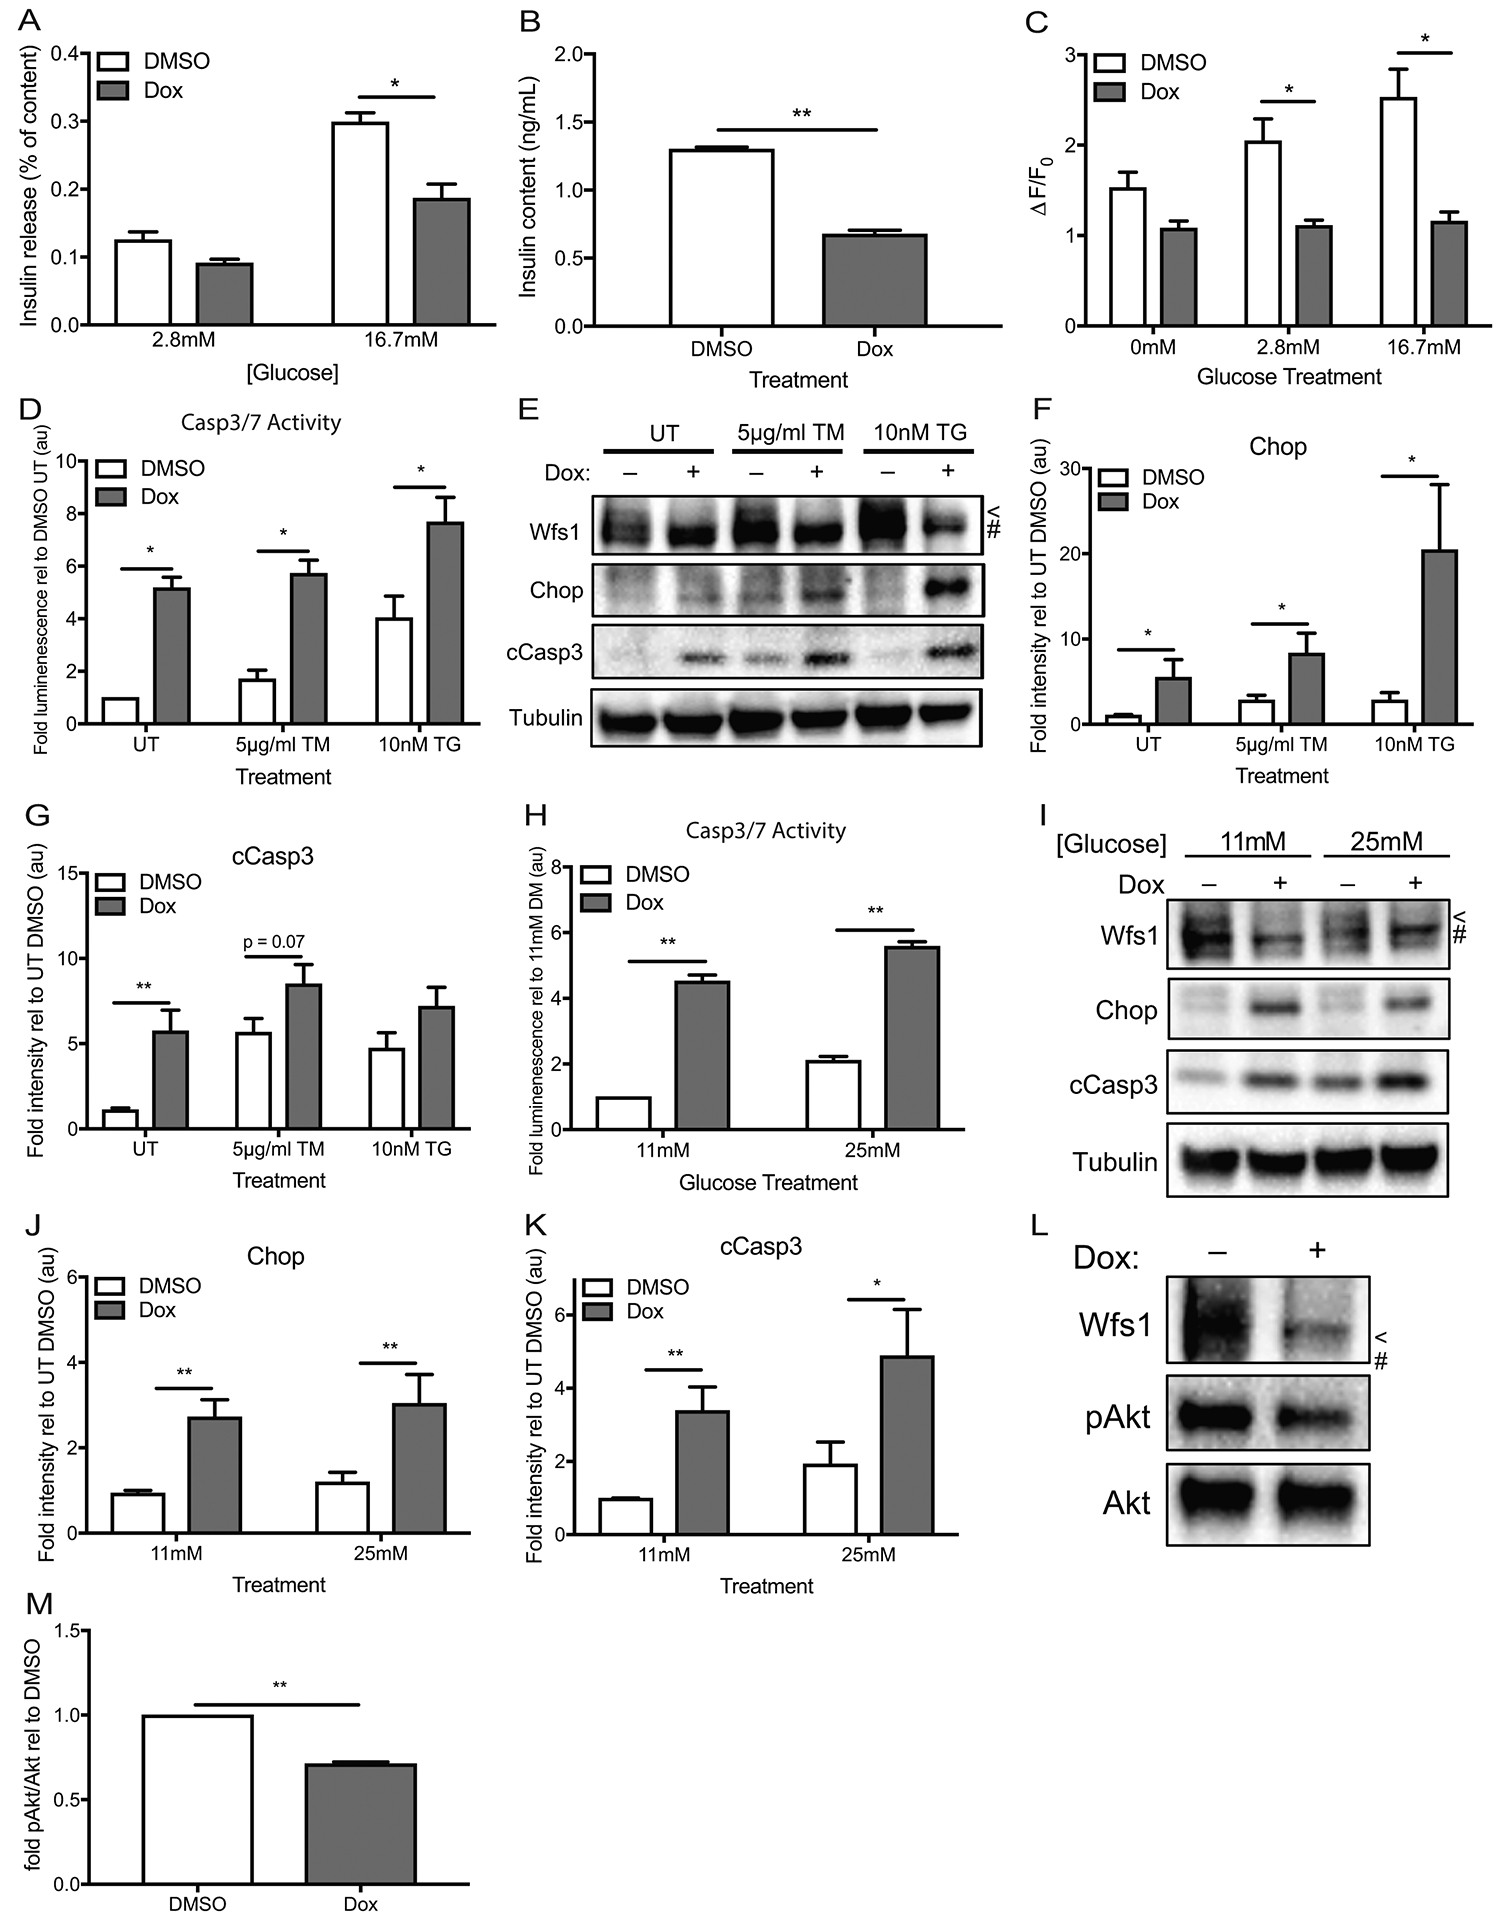
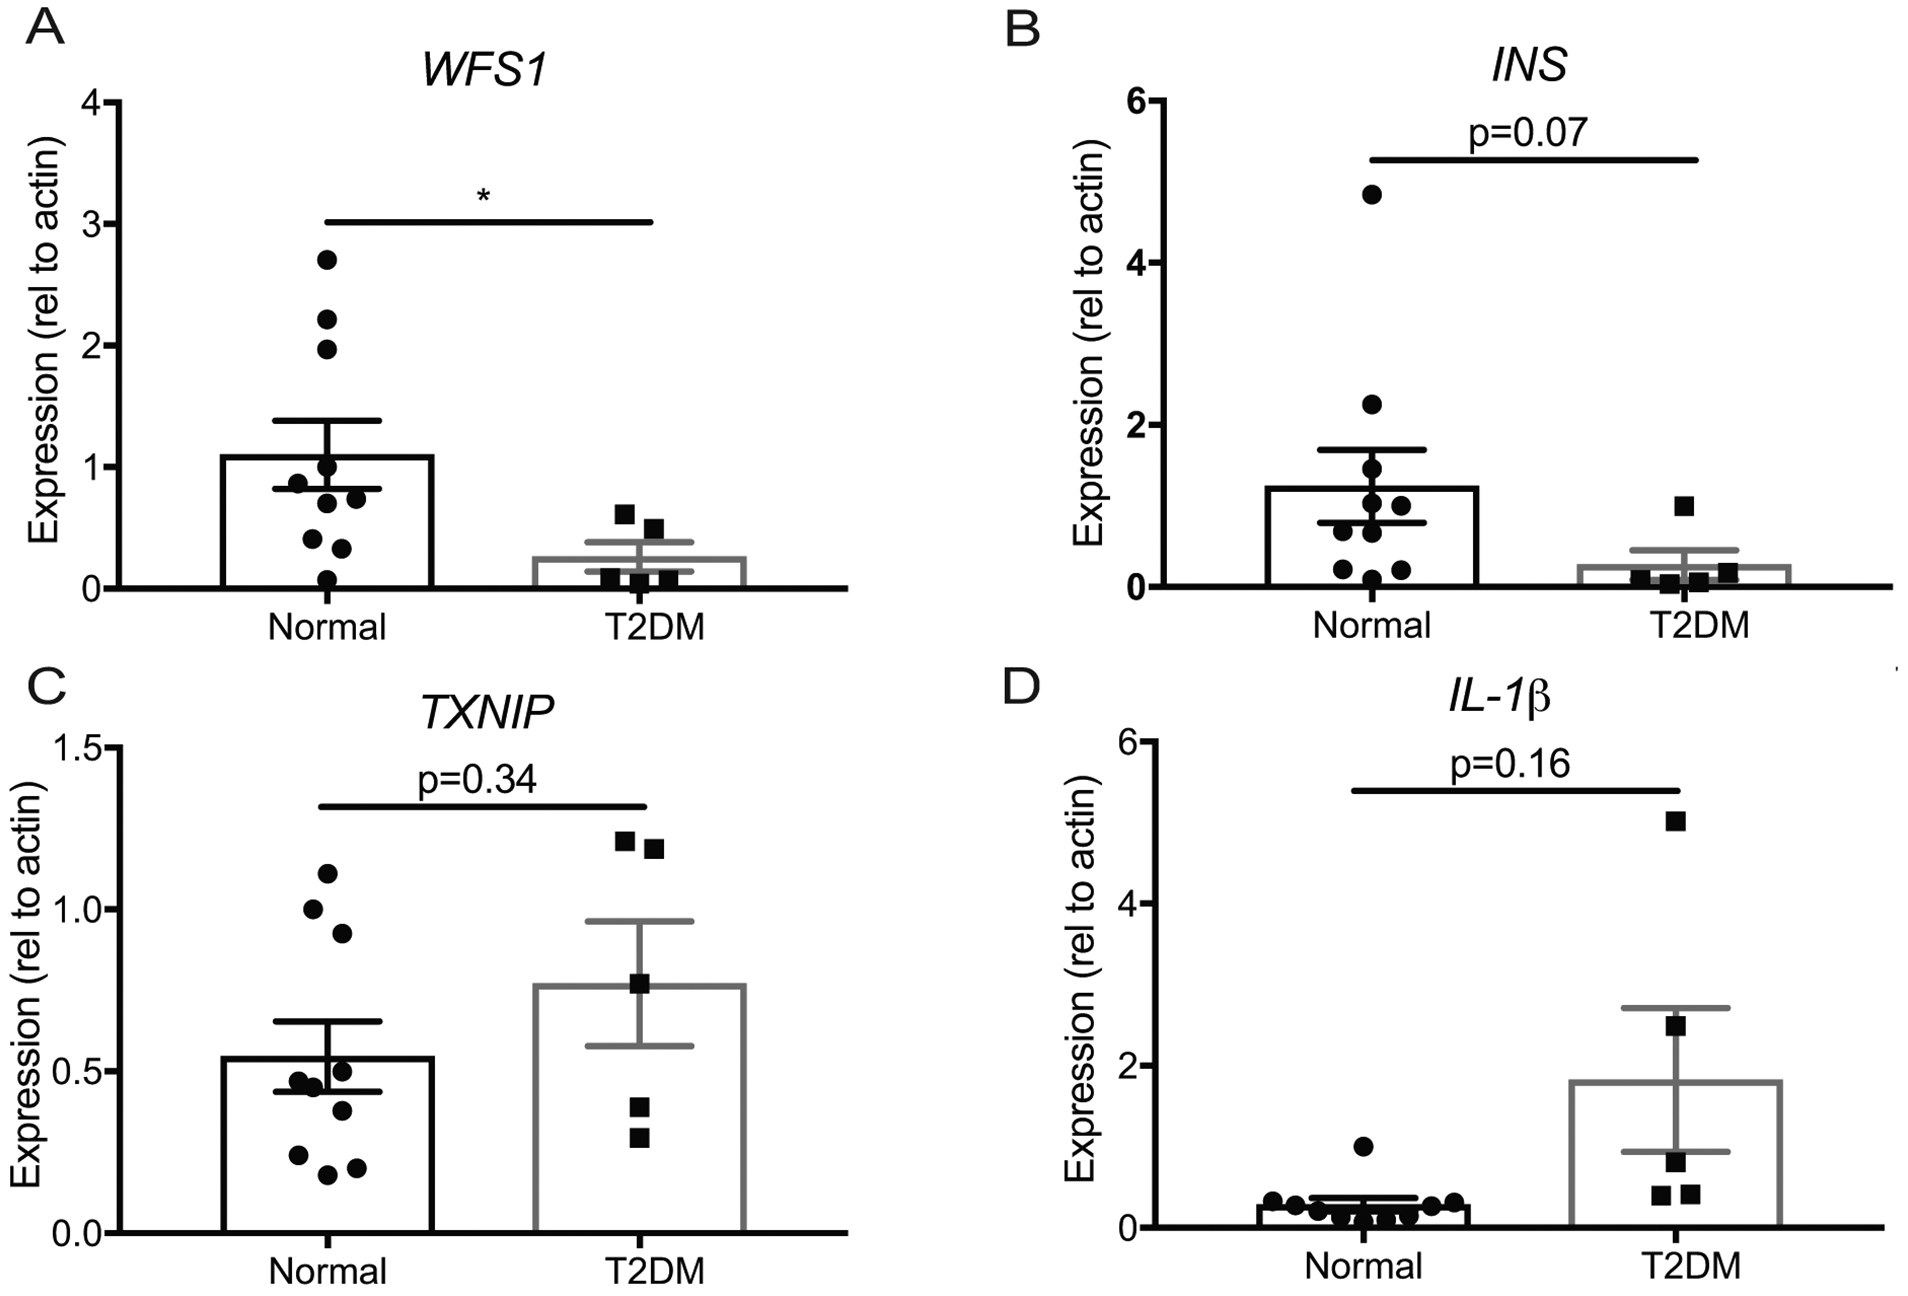
Wolfram Syndrome 1 (WFS1) protein is an endoplasmic reticulum (ER) factor whose deficiency results in juvenile-onset diabetes secondary to cellular dysfunction and apoptosis. The mechanisms guiding β-cell outcomes secondary to WFS1 function, however, remain unclear. Here, we show that WFS1 preserves normal β-cell physiology by promoting insulin biosynthesis and negatively regulating ER stress. Depletion of Wfs1 in vivo and in vitro causes functional defects in glucose-stimulated insulin secretion and insulin content, triggering Chop-mediated apoptotic pathways. Genetic proof of concept studies coupled with RNA-seq reveal that increasing WFS1 confers a functional and a survival advantage to β-cells under ER stress by increasing insulin gene expression and downregulating the Chop-Trib3 axis, thereby activating Akt pathways. Remarkably, WFS1 and INS levels are reduced in type-2 diabetic (T2DM) islets, suggesting that WFS1 may contribute to T2DM β-cell pathology. Taken together, this work reveals essential pathways regulated by WFS1 to control β-cell survival and function primarily through preservation of ER homeostasis.


Conflict of interest statement

Disclosure/Conflict of Interest

The authors declare no competing interests relevant to this article.

Figures

Figure 1.
Figure 1.. Glucose tolerance and β-cell morphometry in whole body WFS1–/– 129S6 mice.
Intraperitoneal glucose tolerance test of: (A) WFS1 KO (n=12) and WT control (n=6) mice at 4.5 weeks old, (B) WFS1 KO (n=21) and WT control (n = 19) mice at 6.5-weeks old and (C) WFS1 KO (n=7) and WT control (n=7) mice at 16-weeks old (*p<0.05, **p< 0.01). (D) Insulin levels 30 min after injection of glucose (2g/kg) in 6.5-week old and 16-week old mice (n=4 WFS1 KO mice at each age and n = 4 WT mice at each age, *p<0.05). (E) Total pancreatic insulin content in 6.5-week-old and 16-week-old mice (n = 4 WFS1 KO mice at each age and n = 4 WT mice at each age, *p<0.05, **p< 0.01) (F) Immunofluorescence of islets from control and WFS1 KO mice at 6.5 and 16-weeks of age. (G) Beta cell mass in WT and WFS1 KO mice at 6.5 and 16-weeks of age mice (n = 3 WFS1 KO mice at each age and n = 3 WT mice at each age). Black bars represent data from WT mice and red bars indicate data from Wfs1 KO mice. (H) Quantification of alpha cell area to beta cell area in WT and WFS1 KO mice at 6.5 and 16-weeks of age mice (n=3 Wfs1 KO mice and n = 3 WT mice at each age, *p<0.05). Data are represented as mean ± SEM from at least three mice per experiment. Statistical significance was determined by unpaired t-test.
Figure 2.
Figure 2.. WFS1 positively regulates insulin biosynthesis and β-cell maturity markers.
(A) Experimental strategy for identifying gene networks affected by WFS1 overexpression in INS1 cells via RNA sequencing. INS-1 832/13 with inducible pTetR Tet On (TO) WFS1 overexpression were treated with DMSO or doxycycline for 48 hours, followed by 16 hours of 5μg/ml tunicamycin or 10nM thapsigargin. Venn diagram represents number of genes with q-value ≤ 0.05 in each stress condition. (B) Top 25 biological processes affected by WFS1 overexpression under tunicamycin-mediated ER stress. Yellow bars indicate biological processes affected only by tunicamycin-mediated stress. Green bars indicate biological processes affected by both tunicamycin- and thapsigargin-mediated stress. (C) Top 25 biological processes affected by WFS1 overexpression under thapsigargin-mediated ER stress. Blue bars indicate biological processes affected only by thapsigargin-mediated stress. Green bars indicate biological processes affected by both tunicamycin- and thapsigargin-mediated stress. (D-E) Relative expression of Ins1 and Ins2 by quantitative PCR in cells treated as indicated in (A) (n=4 for all conditions, **p< 0.01). (F-H) Relative expression of Nkx2.2, Nkx6.1 and Pdx1 by quantitative PCR in cells treated as indicated in (A) (n=4 for all conditions, *p<0.05, **p< 0.01). Data are represented as mean ± SEM from at least four independent experiments or three independent mice. Statistical significance was determined by unpaired t-test.
Figure 3.
Figure 3.. WFS1 overexpression suppresses ER stress-mediated cell death.
(A) INS-1 832/13 with inducible pTetR Tet On (TO) Flag-tagged WFS1 overexpression were treated with DMSO or doxycycline for 48 hours, followed by 16 hours of no treatment (UT) or chemical ER stress by specified doses of tunicamycin (TM) or thapsigargin (TG) before measurement of caspase 3/7 activity (n=8 for all conditions, **p< 0.01). (B-C) Relative expression of Chop and Trib3 by quantitative PCR in cells treated as (a) (n=4 for all conditions, *p<0.05, **p< 0.01). (D) Immunoblot analysis of Chop and cleaved caspase 3 expression in cells treated as (A). (E-F) Quantification of Chop and cCasp3 protein expression relative to untreated control cells—UT DMSO (n=8 for all conditions, *p<0.05). (G) INS-1 832/13 with inducible pTetR TO Flag-tagged WFS1 overexpression were treated with DMSO or doxycycline for 48 hours in 11mM glucose or 25mM glucose media prior to measurement of caspase 3/7 activity (n=4 for all conditions, *p< 0.05). (H-I) Relative expression of Chop and Trib3 by quantitative PCR in cells treated as (G) (n=4 for all conditions, **p< 0.01). (J) Immunoblot analysis of Chop and cleaved caspase 3 expression in cells treated as (G). (K-L) Quantification of Chop and cCasp3 protein expression relative to untreated control cells—11mM glucose DMSO (n=8 for Chop quantification, n=9 for cCasp3 quantification, **p< 0.01). (M) Immunoblot analysis of Wfs1, p(473)-Akt and total Akt expression in WT INS1 832/13 cells transduced with GFP or WFS1 lentivirus (n=3). (N) Quantification of p(473)-Akt/Akt in WFS1 overexpression (WFS1) cells relative to WT control (GFP) cells (n=3). White bars represent data from control cells and blue bars indicate data from WFS1 overexpression cells. Data are represented as mean ± SEM from at least four independent experiments. Statistical significance was determined by unpaired t-test.
Figure 4.
Figure 4.. WFS1 knockdown promotes β-cell dysfunction, ER stress and β-cell death.
(A) INS-1 832/13 with inducible pTetR Tet-On (TO) shWfs1 were treated with DMSO or doxycycline for 48 hours, then subjected to glucose stimulated insulin secretion by sequential exposure to 2.8mM glucose then 16.7mM glucose (n=4, *p< 0.05). (B) Insulin content was measured from the cells used in (a) (n=4, **p< 0.01). (C) INS-1 832/13 with inducible pTetR TO shWfs1 were treated with DMSO or doxycycline for 48 hours, then loaded with Fluo-4 AM and imaged over 2 minutes in 0mM glucose KRBH, 2.8mM glucose KRBH and 16.7mM glucose KRBH. The change in fluorescence intensity at each glucose condition was averaged over 2 minutes of image acquisition and is expressed relative to baseline fluorescence to account for uneven concentration of dye loading in each cell. ΔF/F0 was averaged over 20 cells per glucose concentration (n=3, *p<0.05). (D) INS-1 832/13 with inducible pTetR TO shWfs1 were treated with DMSO or doxycycline for 48 hours, followed by 16 hours of no treatment (UT) or chemical ER stress by specified doses of tunicamycin (TM) or thapsigargin (TG) before measurement of caspase 3/7 activity (n=8 for all conditions, **p< 0.01). (E) Immunoblot analysis of Wfs1, Chop and cleaved caspase 3 expression in cells treated as (d). (F-G) Quantification of Chop and cCasp3 protein expression relative to untreated control cells—UT DMSO (n=9 for all conditions, *p<0.05, **p<0.01). (H) INS-1 832/13 with inducible pTetR TO shWfs1 were treated with DMSO or doxycycline for 48 hours in 11mM glucose or 25mM glucose media prior to measurement of caspase 3/7 activity (n=5 for all conditions, *p< 0.05). (I) Immunoblot analysis of Wfs1, Chop and cleaved caspase 3 expression in cells treated as (h). (J-K) Quantification of Chop and cCasp3 protein expression relative to untreated control cells—UT DMSO (n=11 for all conditions, *p<0.05, **p<0.01). (L) Immunoblot analysis of Wfs1, Ser743 Akt phosphorylation (pAkt) and total Akt expression in INS-1 832/13 with inducible pTetR Tet On (TO) shWfs1 treated for 48 hours with DMSO or doxycycline. (M) Quantification of pAkt/Akt in Wfs1 knockdown (Dox) cells relative to control (DMSO) cells (n=7, **p<0.01). White bars represent data from control cells and red bars indicate data from Wfs1 knockdown cells. For immunoblots, < indicates WFS1 band, # indicates a background band. Data are represented as mean ± SEM from at least four independent experiments. Statistical significance was determined by unpaired t-tests.
Figure 5.
Figure 5.. WFS1 expression is decreased in type-2 diabetic human donor islets.
Relative expression of (A) WFS1, (B) INS, (C) TXNIP and (D) IL-1β by quantitative PCR in normal (n=10) and type-2 diabetic (T2DM) (n=5) donor islets (*p<0.05). (e) Proposed model of Wfs1 role in β-cell viability and function. Data are represented as mean ± SEM from at least five individual donors. Statistical significance was determined by unpaired t-test.

References

    1. Cnop M, Welsh N, Jonas JC, Jorns A, Lenzen S, Eizirik DL. Mechanisms of pancreatic beta-cell death in type 1 and type 2 diabetes: many differences, few similarities. Diabetes 2005;54 Suppl 2:S97–107. - PubMed
    1. Donath MY, Ehses JA, Maedler K, Schumann DM, Ellingsgaard H, Eppler E, et al. Mechanisms of beta-cell death in type 2 diabetes. Diabetes 2005;54 Suppl 2:S108–113. - PubMed
    1. Back SH, Kaufman RJ. Endoplasmic reticulum stress and type 2 diabetes. Annu Rev Biochem 2012;81:767–793. - PMC - PubMed
    1. Harding HP, Ron D. Endoplasmic reticulum stress and the development of diabetes: a review. Diabetes 2002;51 Suppl 3:S455–461. - PubMed
    1. Inoue H, Tanizawa Y, Wasson J, Behn P, Kalidas K, Bernal-Mizrachi E, et al. A gene encoding a transmembrane protein is mutated in patients with diabetes mellitus and optic atrophy (Wolfram syndrome). Nat Genet 1998;20(2):143–148. - PubMed

Publication types