

High-contrast, synchronous volumetric imaging with selective volume illumination microscopy
- PMID: 32060411
- PMCID: PMC7021898
- DOI: 10.1038/s42003-020-0787-6
High-contrast, synchronous volumetric imaging with selective volume illumination microscopy
Erratum in
-
Author Correction: High-contrast, synchronous volumetric imaging with selective volume illumination microscopy.Commun Biol. 2022 Apr 11;5(1):363. doi: 10.1038/s42003-022-03327-7. Commun Biol. 2022. PMID: 35411008 Free PMC article. No abstract available.
-
Publisher Correction: Author Correction: High-contrast, synchronous volumetric imaging with selective volume illumination microscopy.Commun Biol. 2022 May 27;5(1):533. doi: 10.1038/s42003-022-03474-x. Commun Biol. 2022. PMID: 35624197 Free PMC article. No abstract available.
Abstract
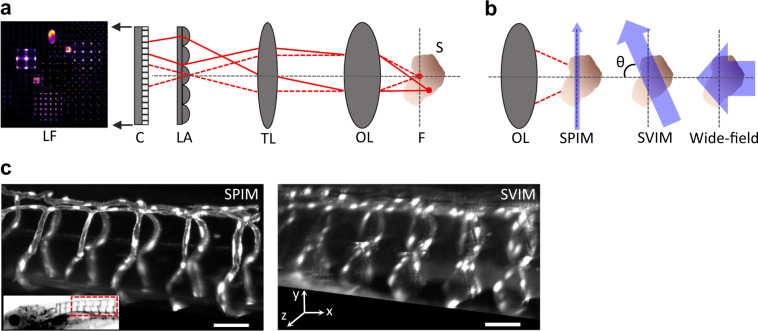
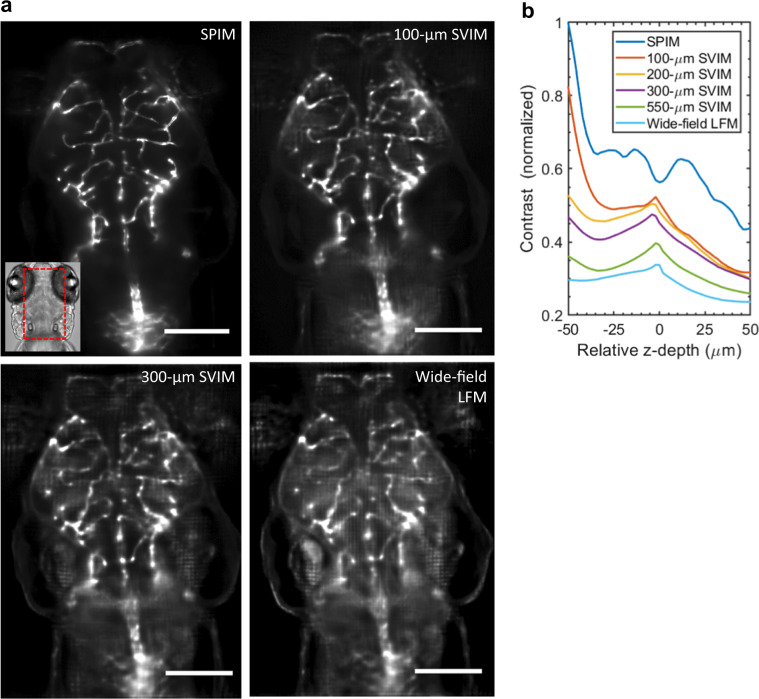
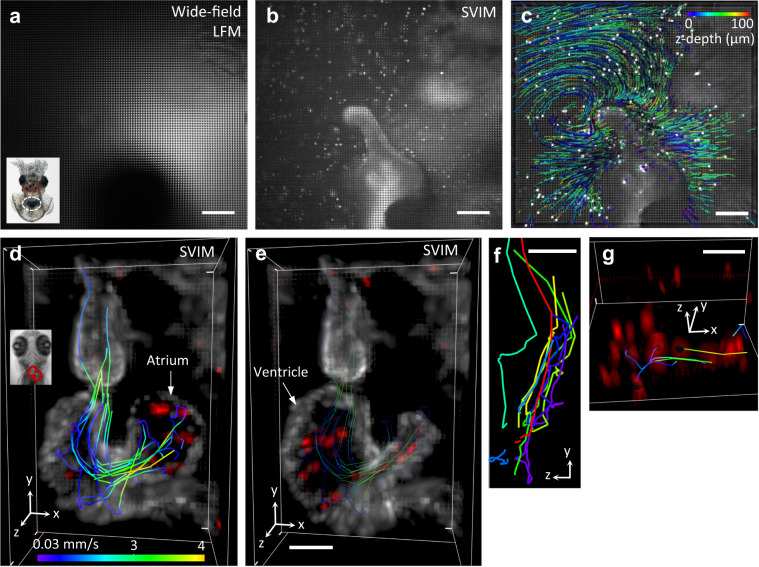
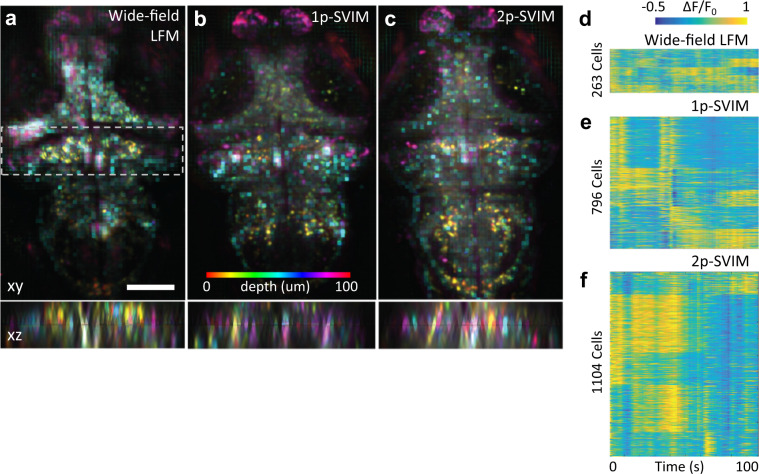
Light-field fluorescence microscopy uniquely provides fast, synchronous volumetric imaging by capturing an extended volume in one snapshot, but often suffers from low contrast due to the background signal generated by its wide-field illumination strategy. We implemented light-field-based selective volume illumination microscopy (SVIM), where illumination is confined to only the volume of interest, removing the background generated from the extraneous sample volume, and dramatically enhancing the image contrast. We demonstrate the capabilities of SVIM by capturing cellular-resolution 3D movies of flowing bacteria in seawater as they colonize their squid symbiotic partner, as well as of the beating heart and brain-wide neural activity in larval zebrafish. These applications demonstrate the breadth of imaging applications that we envision SVIM will enable, in capturing tissue-scale 3D dynamic biological systems at single-cell resolution, fast volumetric rates, and high contrast to reveal the underlying biology.
Conflict of interest statement
A patent application has been filed by the University of Southern California, with inventors T.V.T., S.M., D.B.H., snd S.E.F., for the methodology of SVIM. Application number: PCT/US2017/019512; pending. All other authors declare no competing interests.
Figures
Similar articles
-
Video-rate volumetric neuronal imaging using 3D targeted illumination.Sci Rep. 2018 May 21;8(1):7921. doi: 10.1038/s41598-018-26240-8. Sci Rep. 2018. PMID: 29784920 Free PMC article.
-
Fast objective coupled planar illumination microscopy.Nat Commun. 2019 Oct 2;10(1):4483. doi: 10.1038/s41467-019-12340-0. Nat Commun. 2019. PMID: 31578369 Free PMC article.
-
Instantaneous isotropic volumetric imaging of fast biological processes.Nat Methods. 2019 Jun;16(6):497-500. doi: 10.1038/s41592-019-0393-z. Epub 2019 Apr 29. Nat Methods. 2019. PMID: 31036959
-
Adaptive optical fluorescence microscopy.Nat Methods. 2017 Mar 31;14(4):374-380. doi: 10.1038/nmeth.4218. Nat Methods. 2017. PMID: 28362438 Review.
-
Multiscale light-sheet for rapid imaging of cardiopulmonary system.JCI Insight. 2018 Aug 23;3(16):e121396. doi: 10.1172/jci.insight.121396. eCollection 2018 Aug 23. JCI Insight. 2018. PMID: 30135307 Free PMC article. Review.
Cited by
-
Extended depth-of-field light-sheet microscopy improves imaging of large volumes at high numerical aperture.Appl Phys Lett. 2022 Oct 17;121(16):163701. doi: 10.1063/5.0101426. Epub 2022 Oct 20. Appl Phys Lett. 2022. PMID: 36276589 Free PMC article.
-
Zebrafish fluorescence imaging platform based on Bessel light sheet illumination.Biomed Opt Express. 2025 Mar 27;16(4):1678-1691. doi: 10.1364/BOE.542599. eCollection 2025 Apr 1. Biomed Opt Express. 2025. PMID: 40321999 Free PMC article.
-
Volumetric Imaging of Neural Activity by Light Field Microscopy.Neurosci Bull. 2022 Dec;38(12):1559-1568. doi: 10.1007/s12264-022-00923-9. Epub 2022 Aug 8. Neurosci Bull. 2022. PMID: 35939199 Free PMC article. Review.
-
High-contrast multifocus microscopy with a single camera and z-splitter prism.Optica. 2020 Nov 20;7(11):1477-1486. doi: 10.1364/optica.404678. Epub 2020 Oct 22. Optica. 2020. PMID: 34532564 Free PMC article.
-
Methods to Evaluate Bacterial Motility and Its Role in Bacterial-Host Interactions.Microorganisms. 2022 Mar 4;10(3):563. doi: 10.3390/microorganisms10030563. Microorganisms. 2022. PMID: 35336138 Free PMC article. Review.
References
-
- Pawley JB. Handbook Of Biological Confocal Microscopy. US: Springer-Verlag; 2006.
-
- Levoy M, Ng R, Adams A, Footer M, Horowitz M. Light field microscopy. ACM Trans. Graph. TOG. 2006;25:924–934. doi: 10.1145/1141911.1141976. - DOI
Publication types
MeSH terms
Grants and funding
LinkOut - more resources
Full Text Sources
Other Literature Sources
Molecular Biology Databases
