Review
. 2020 Jun;21(6):339-354.
doi: 10.1038/s41576-020-0212-5. Epub 2020 Feb 14.

A systems approach to infectious disease

Affiliations
Review

A systems approach to infectious disease

Manon Eckhardt et al. Nat Rev Genet. 2020 Jun.

Abstract

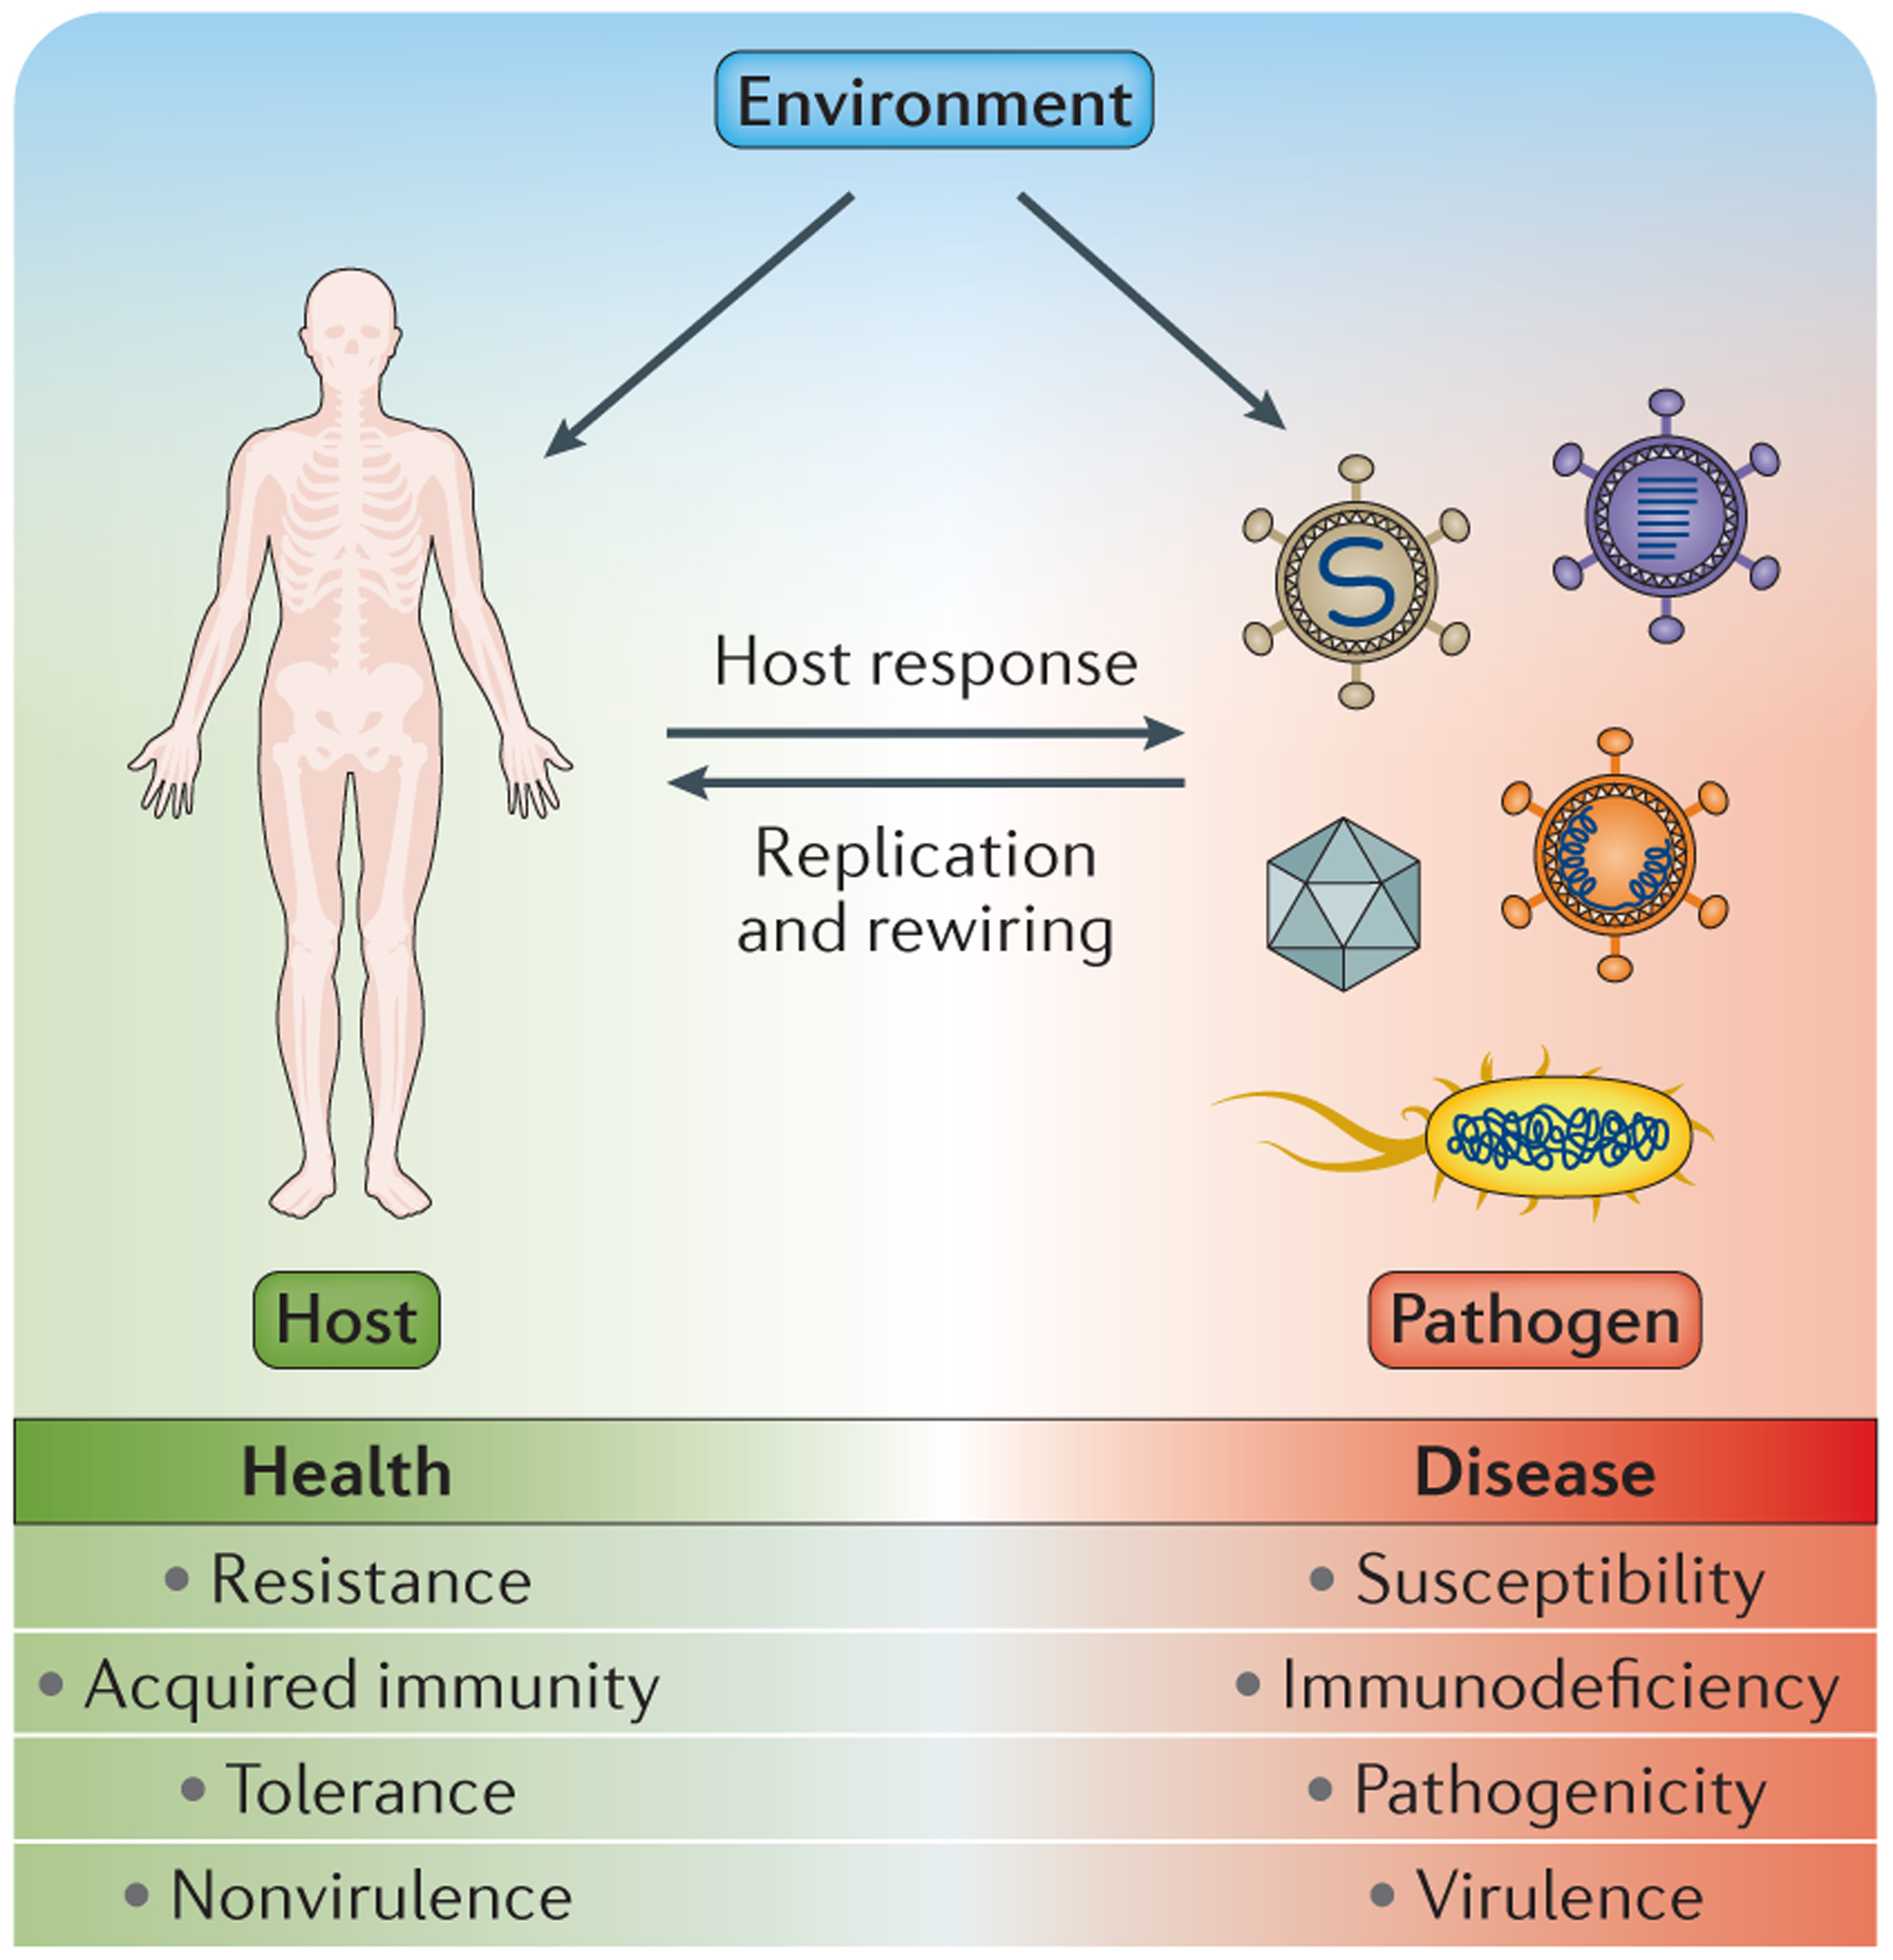
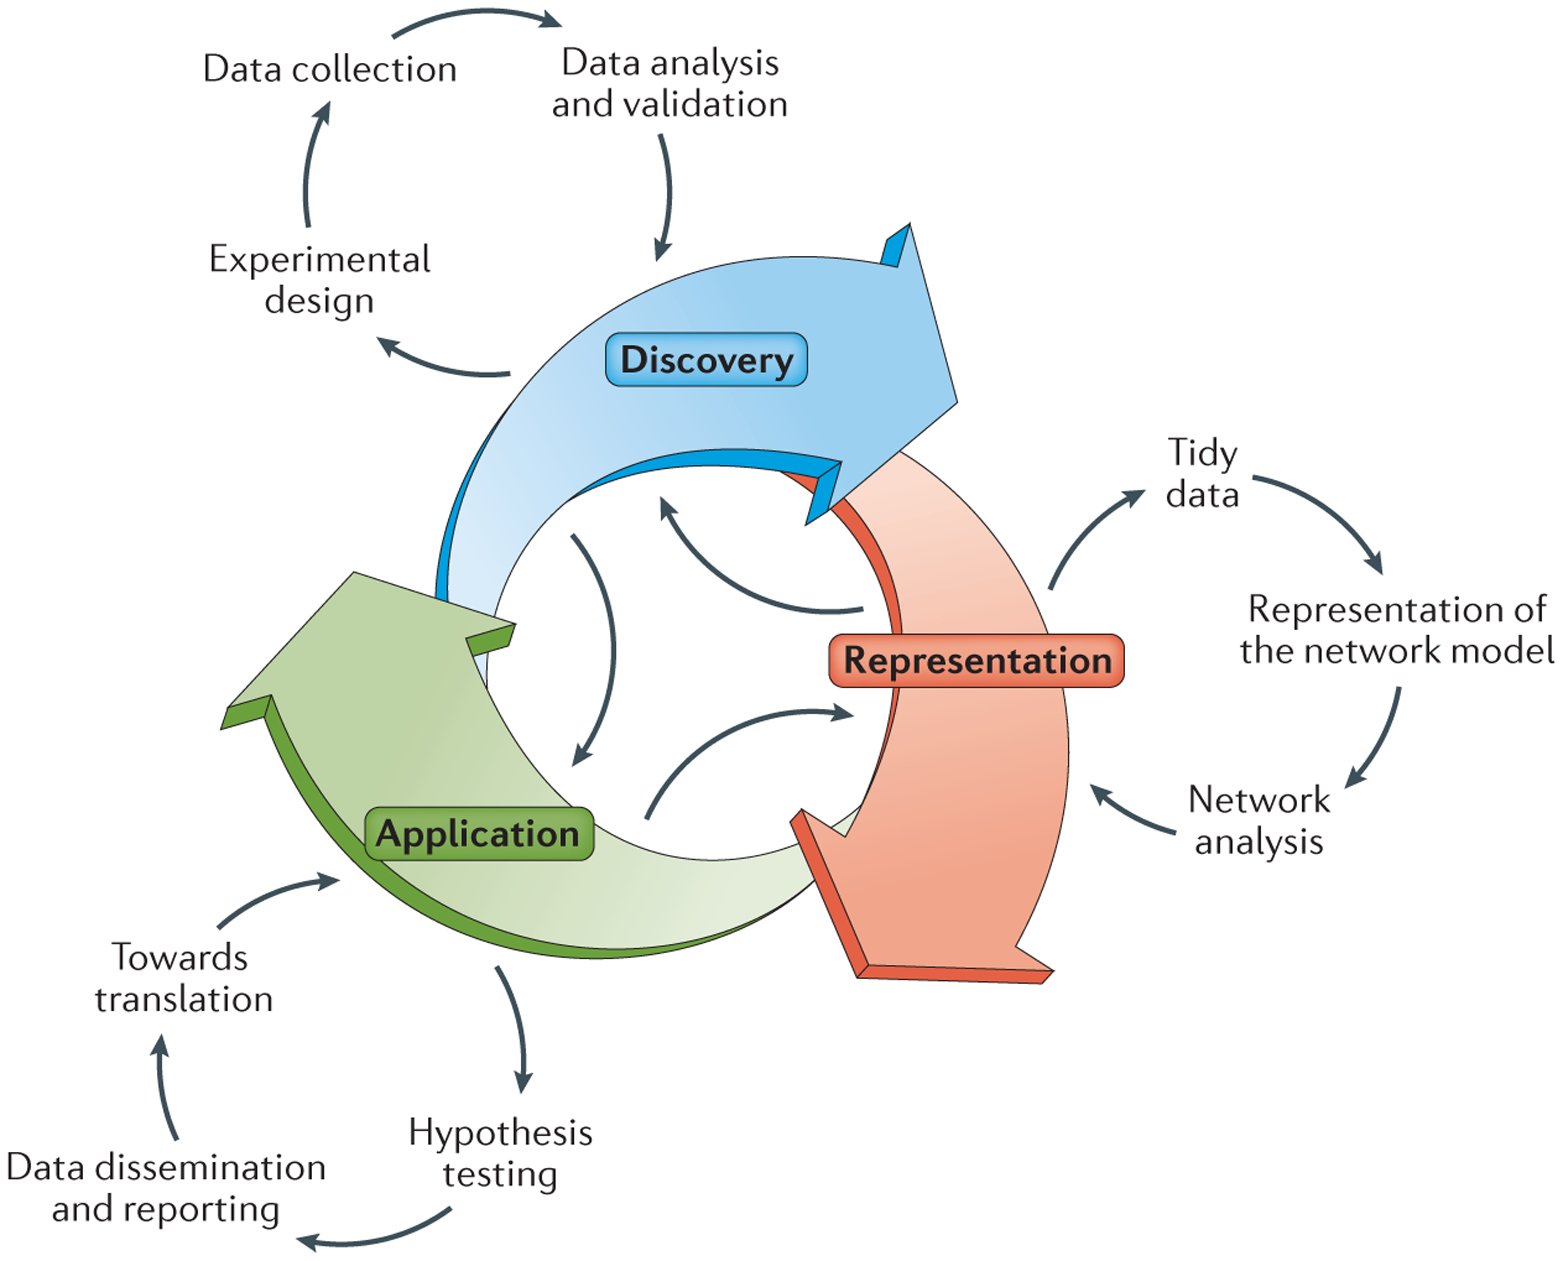
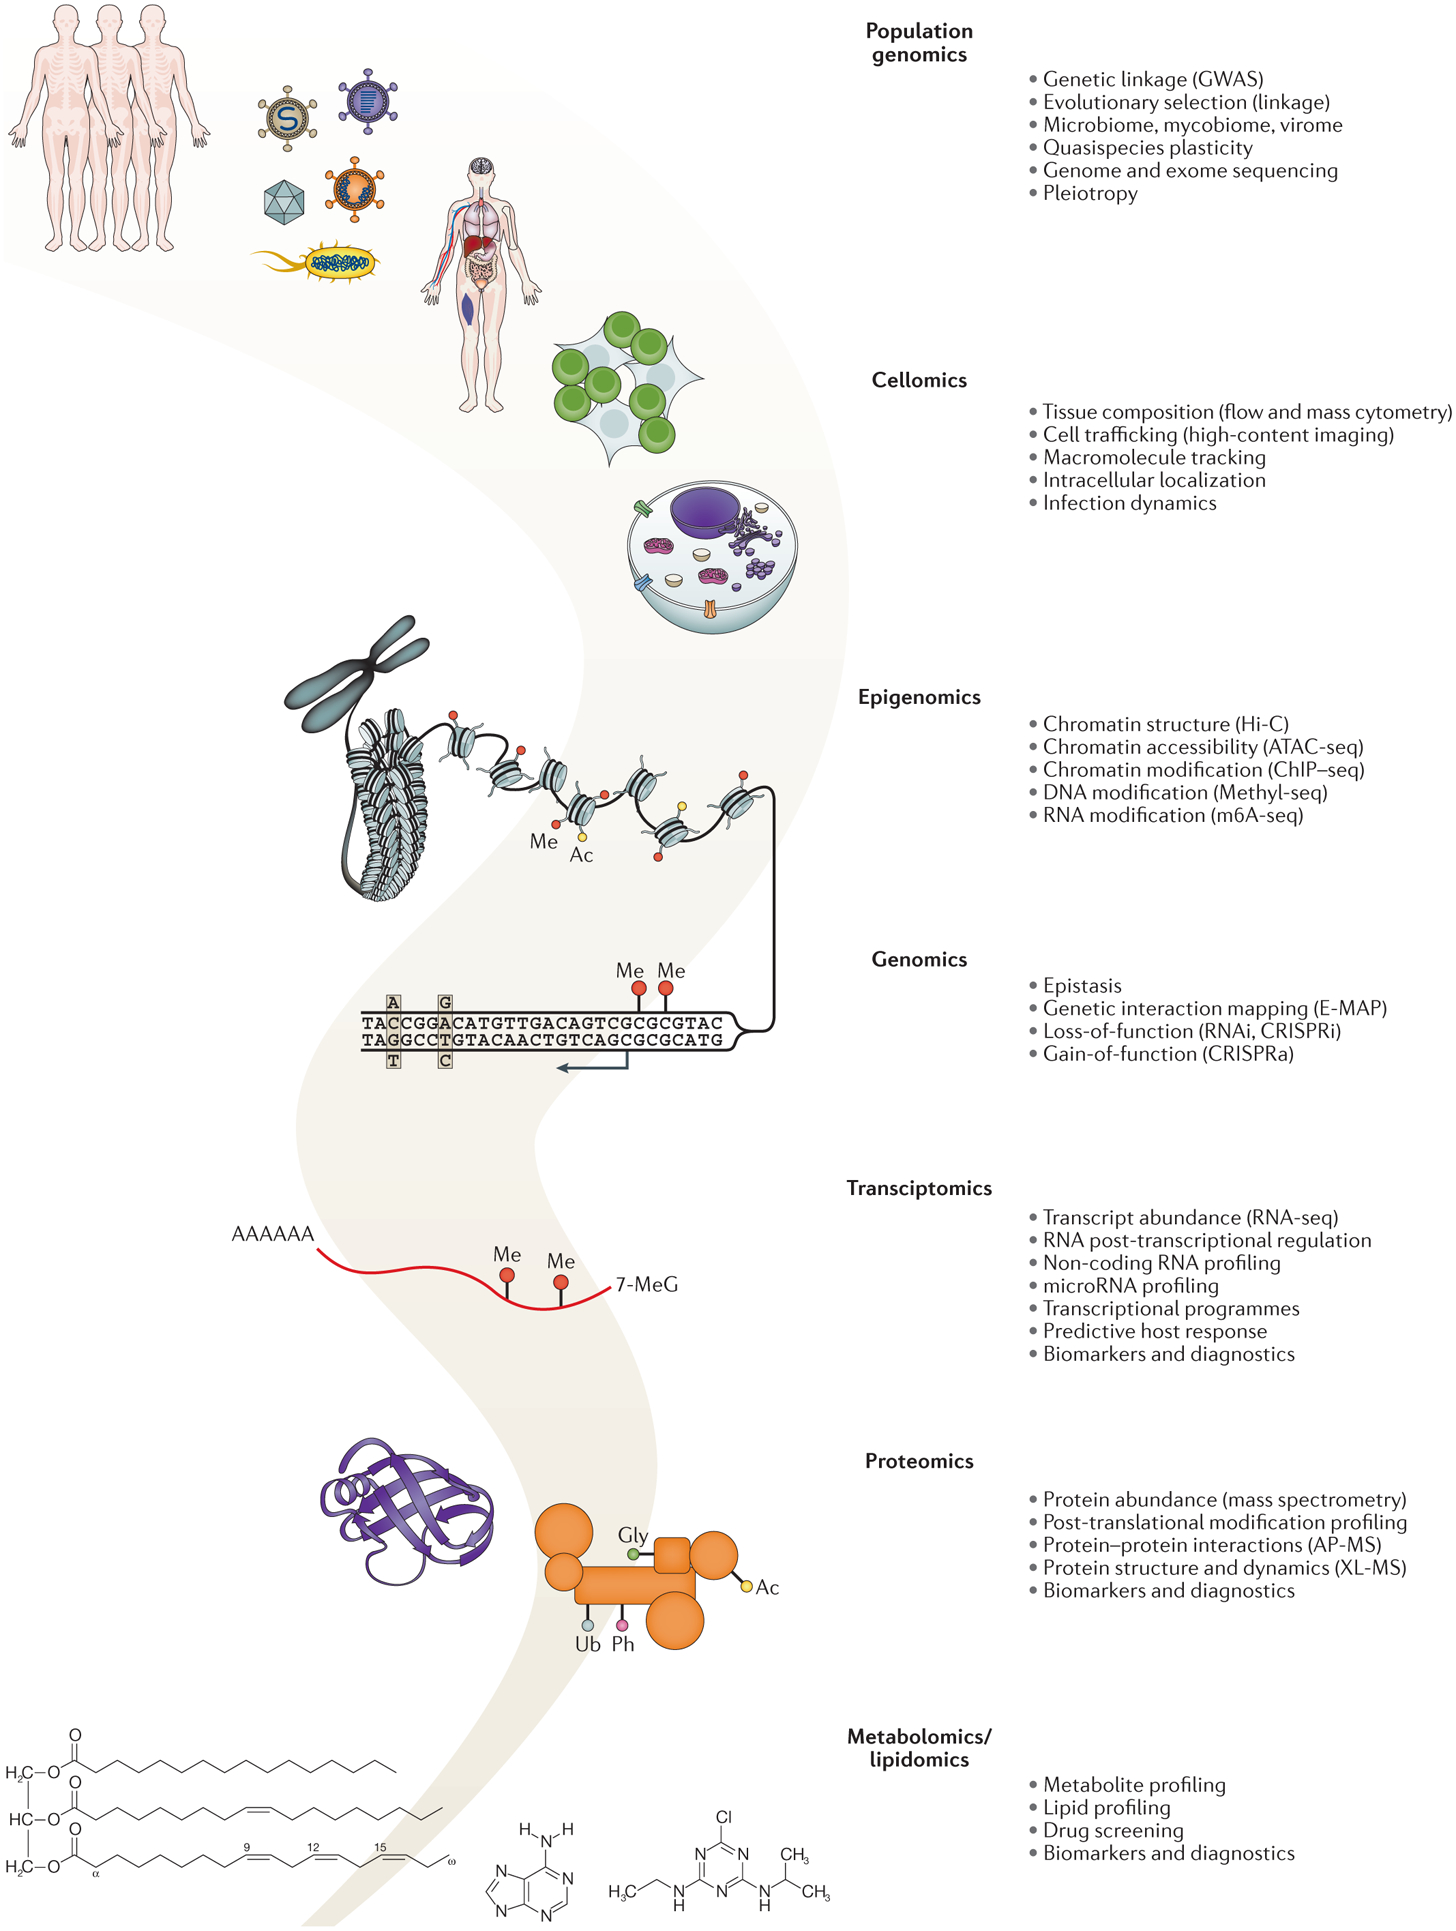
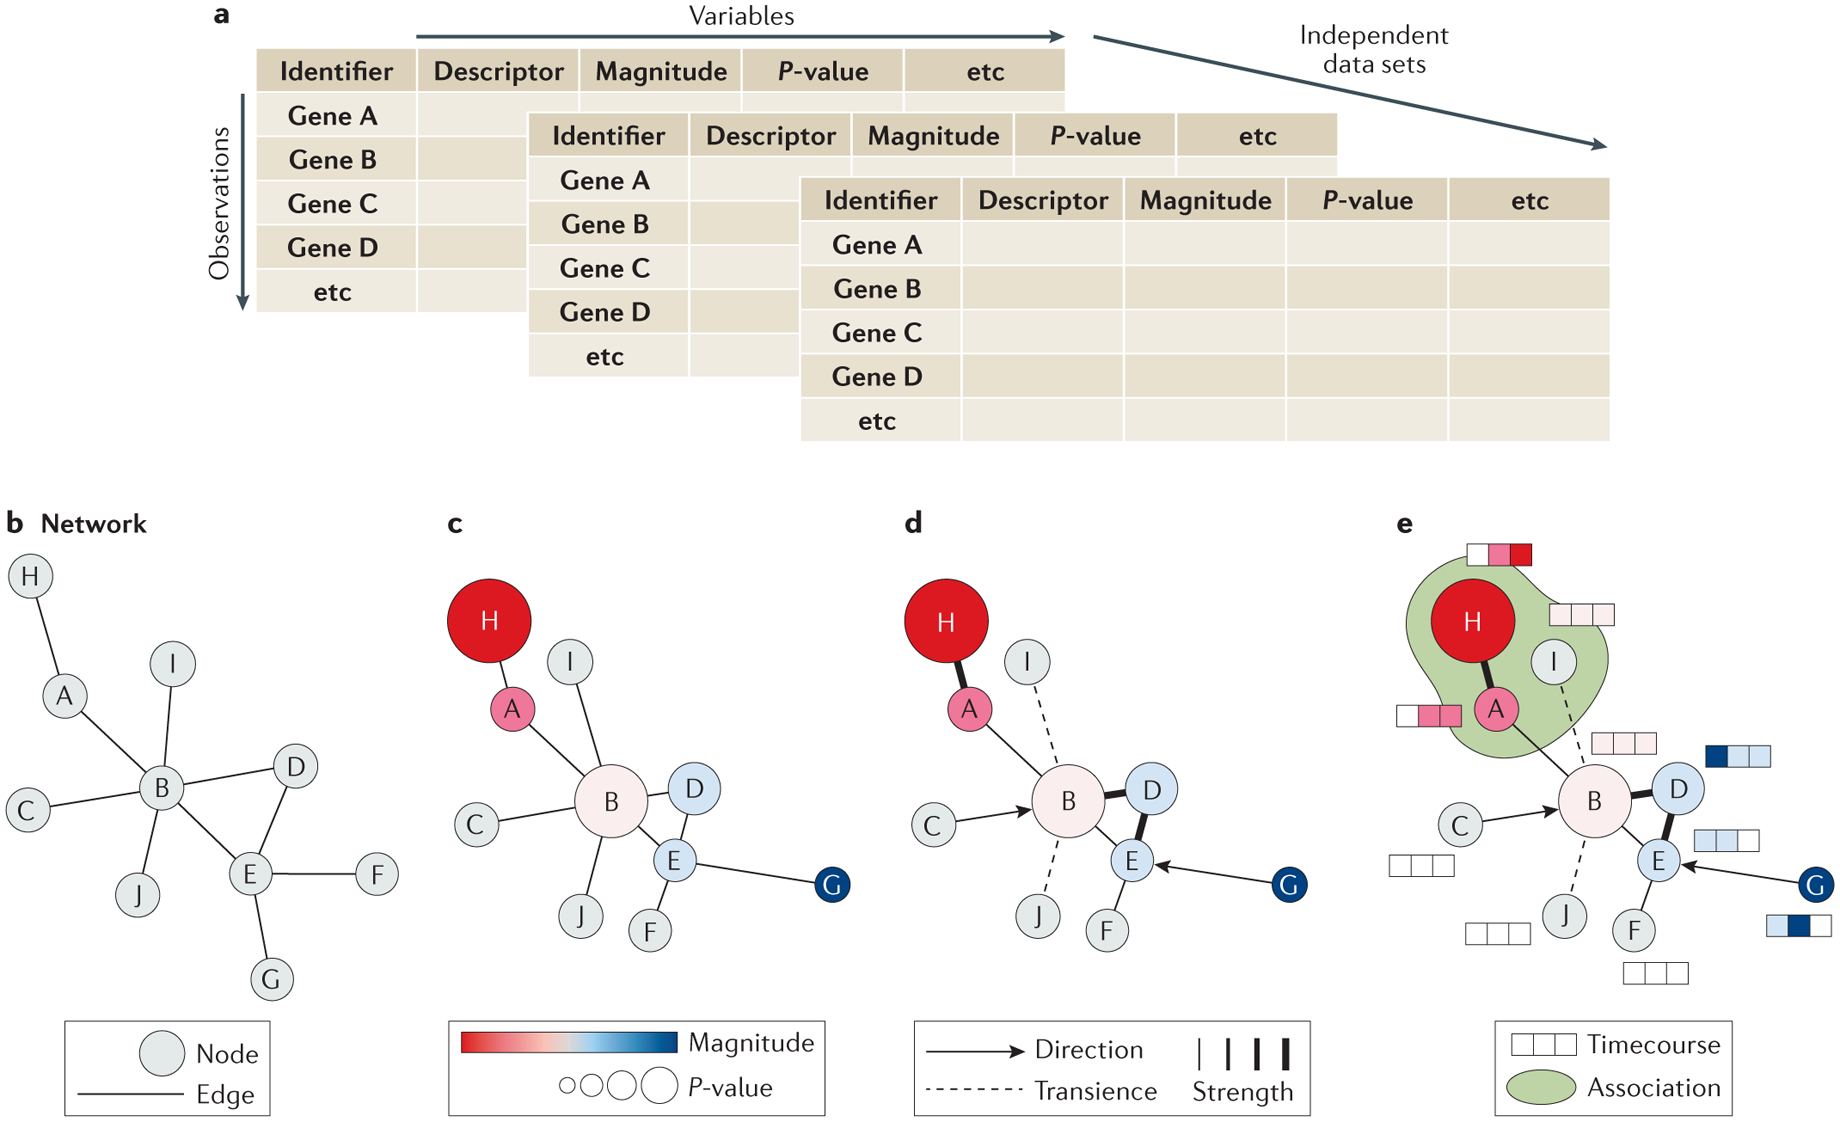
Ongoing social, political and ecological changes in the 21st century have placed more people at risk of life-threatening acute and chronic infections than ever before. The development of new diagnostic, prophylactic, therapeutic and curative strategies is critical to address this burden but is predicated on a detailed understanding of the immensely complex relationship between pathogens and their hosts. Traditional, reductionist approaches to investigate this dynamic often lack the scale and/or scope to faithfully model the dual and co-dependent nature of this relationship, limiting the success of translational efforts. With recent advances in large-scale, quantitative omics methods as well as in integrative analytical strategies, systems biology approaches for the study of infectious disease are quickly forming a new paradigm for how we understand and model host-pathogen relationships for translational applications. Here, we delineate a framework for a systems biology approach to infectious disease in three parts: discovery - the design, collection and analysis of omics data; representation - the iterative modelling, integration and visualization of complex data sets; and application - the interpretation and hypothesis-based inquiry towards translational outcomes.


Conflict of interest statement

Competing interests

The authors declare no competing interests.

Figures

Figure 1 |
Figure 1 |. Interdependence of host and pathogen.
A representation of the intricate relationship between host and pathogen that ultimately dictates the outcome of infection on the spectrum between health and disease. Pathogens effect direct changes on the host, which in turn elicits a response to infection, both of which are influenced by the underlying environment. These influences dictate susceptibility versus resistance, tolerance versus pathogenicity, immune response versus immunodeficiency, virulence versus nonvirulence, and ultimately health versus disease. Systems biology approaches are especially valuable in infectious disease research as a way to capture a comprehensive picture of this intricate relationship.
Figure 2 |
Figure 2 |. A systems biology framework.
A visual representation of the steps we outline in this review as part of a systems biology approach to infectious disease from discovery to representation to application. Arrows highlight the iterative and interconnected nature of systems biology as a process. CRISPRa, CRISPR activation; CRISPRi, CRISPR inhibition; E-MAP; epistatic mini-array profile; GWAS, genome-wide association studies; RNAi, RNA interference; seq, sequencing.
Figure 3 |
Figure 3 |. Systems biology technologies for infectious disease research.
A summary of relevant omics technologies used in infectious disease research alongside the molecular signatures they are designed to capture.
Figure 4 |
Figure 4 |. Assembly and representation of a network model.
After the organization of the collected data into a tidy format (a), a simple network of nodes and edges can be assembled (b) with each node representing a component of the system and each edge representing their relationships. Varying the size, color, and organization of the nodes can be used to add dimension to the dataset by visualizing magnitude, p-value, or a common descriptor (c). Additional information can be depicted by varying edge characters such as width to indicate associative strength, gaps to indicate transience, or arrows to indicate directionality (d). Different types of data may benefit from different methods of depiction to complement the base network, including heatmaps to illustrate timecourse data or shading to illustrate pathway or complex membership (E).

References

    1. (WHO, W. H. O.) Global Health Estimates 2016: Disease burden by Cause, Age, Sex, by Country and by Region, 2000–2016. (2018).
    1. Aderem A et al. A systems biology approach to infectious disease research: innovating the pathogen-host research paradigm. MBio 2, e00325–00310, doi:10.1128/mBio.00325-10 (2011). - DOI - PMC - PubMed
    1. Hillmer RA Systems biology for biologists. PLoS Pathog 11, e1004786, doi:10.1371/journal.ppat.1004786 (2015). - DOI - PMC - PubMed
    2. An approachable introduction to systems biology for experimentalists.

    1. Kitano H Systems biology: a brief overview. Science 295, 1662–1664, doi:10.1126/science.1069492 (2002). - DOI - PubMed
    2. A foundational introduction to the principles of systems biology.

    1. Ideker T, Galitski T & Hood L A new approach to decoding life: systems biology. Annu Rev Genomics Hum Genet 2, 343–372, doi:10.1146/annurev.genom.2.1.343 (2001). - DOI - PubMed

Publication types