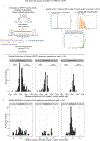
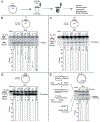
. 2020 Feb;52(2):146-159.
doi: 10.1038/s41588-019-0575-8. Epub 2020 Feb 14.

A slipped-CAG DNA-binding small molecule induces trinucleotide-repeat contractions in vivo

Affiliations

A slipped-CAG DNA-binding small molecule induces trinucleotide-repeat contractions in vivo

Masayuki Nakamori et al. Nat Genet. 2020 Feb.

Abstract

In many repeat diseases, such as Huntington's disease (HD), ongoing repeat expansions in affected tissues contribute to disease onset, progression and severity. Inducing contractions of expanded repeats by exogenous agents is not yet possible. Traditional approaches would target proteins driving repeat mutations. Here we report a compound, naphthyridine-azaquinolone (NA), that specifically binds slipped-CAG DNA intermediates of expansion mutations, a previously unsuspected target. NA efficiently induces repeat contractions in HD patient cells as well as en masse contractions in medium spiny neurons of HD mouse striatum. Contractions are specific for the expanded allele, independently of DNA replication, require transcription across the coding CTG strand and arise by blocking repair of CAG slip-outs. NA-induced contractions depend on active expansions driven by MutSβ. NA injections in HD mouse striatum reduce mutant HTT protein aggregates, a biomarker of HD pathogenesis and severity. Repeat-structure-specific DNA ligands are a novel avenue to contract expanded repeats.


Conflict of interest statement

COMPETING INTERESTS STATEMENT

The authors declare no competing financial interests.

Figures
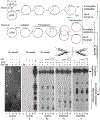
Extended Data Fig. 1
Extended Data Fig. 1. NA does not affect replication efficiency or replication fork progression
Three circular plasmids containing the SV40 origin of replication, and an expanded (CAG)79•(CTG)79 repeat tract (pDM79EF and pDM79HF) or no repeats (pKN16), were replicated in vitro by human (HeLa) cell extracts without or with NA (7.5 μM or 15 μM) treatment. The location of SV40-ori determines the replication direction and which strand will be used as the leading or the lagging strand template. pDM79HF uses the CAG strand as the lagging strand template, while pDM79EF uses the CTG strand as the lagging strand template (schematic on the top of the gel panel). Replication products were purified and linearized with BamHI. An equal portion of the reaction material was also digested with BamHI and DpnI as DpnI digests un-replicated and partially-replicated material, as shown in the schematic (top figure). The digestion products were electrophoresed on a 1% agarose gel to resolve completely replicated and un-replicated material (bottom figure). Equal amount of unreplicated plasmid DNA was digested with DpnI and stained with Ethidium Bromide to show the complete digestion of unreplicated plasmid DNA (Bottom panel). Panel I, ethidium bromide stained, Panel II, autorad: marker (lane 1); DpnI undigested plasmid DNA (lane 2); DpnI digested unreplicated plasmid DNA (lane 3–4); replicated plasmid DNA, DpnI resistant (lane 5). No difference in DpnI resistant material is observed between replication in the presence or absence of NA, in all the three templates tested (panel III, IV, V). Blots have been cropped and the corresponding full blots are available in the Source Data files.
Extended Data Fig. 2
Extended Data Fig. 2. NA does not affect non-mutant genetically stable repeats
a,b, Representative data showing small-pool PCR for the non-expanded CAG/CTG repeat length of CASK and Mdf15 in HD primary fibroblast cells (a) and small-pool PCR for the non-expanded CAG/CTG repeat length of CASK, Mdf15, ATXN8 and the non-expanded HTT allele genes in HT1080–(CAG)850 cells (b). Even under the sensitive mutation detection capacity of spPCR, length variation was not observed in either NA treated- and untreated-cells. Notably, some reactions did not show any product as is typical of the low genomic DNA template dilutions used in small-pool PCR. c, Repeat-tract lengths of the CASK, ATXN8, and Mfd15 loci in HT1080–(CAG)850 cells (initial clone and cells after 30 days incubation with or without NA). Length variation was not observed at any of these repeats of normal length loci in HT1080-(CAG)850 cells (after 30 days incubation with or without NA). Three independent experiments were performed. d, Small-pool PCR for the non-expanded CAG tracts in TBP alleles in HD patient fibroblasts treated with or without NA for 40 days. e, Small-pool PCR for the non-expanded CAG tracts in TBP alleles in HD R6/2 mouse striatum with four injections of NA or saline. f, Microsatellite instability assay. Assay scores >1.3 indicate increased MSI relative to a control sample set from peripheral blood leukocytes. Both NA positive and NA negative HD cells with (CAG)43 or (CAG)180 scored <1.3, indicating no effect of treatment on MSI. 8 known CMMRD-negative controls and 3 known CMMRD-positive controls were included in the assay.
Extended Data Fig. 3
Extended Data Fig. 3. NA is not a general mutagen
Towards assessing whether NA-treatment acted as a general mutagen to sequences other than CAG slip-outs, we harnessed the high read accuracy and depth of single molecule, real time, circular consensus sequencing (SMRT-CCS). Single-molecule sequencing was done on the HPRT1 gene – widely used as a surrogate indicator of the global effect of induced genetic variation. For each replicate, we calculated the relative mutation rate between NA- and saline-treated cells as the mutation rate for NA-treated cells minus the rate for saline-treated cells and identified excess mutation rates based on an absolute relative rate >0.5%. a, Schematic of HPRT1 sequencing for mutation detection. Briefly, cells were grown under identical conditions differing only by the addition of NA (50 μM) or saline, DNAs were isolated, HPRT1 exons 2 and 3 PCR amplified and sequenced. b, Quality control for our analysis. c,d, Comparison of sequence variations between NA-treated and saline treated is presented. We chose to compare the single-molecule sequence reads of individual X chromosome-linked HPRT1 alleles (exons 2 and 3) from our male HD patient-derived cells (c), and our male R6/2 mice (d), thsat had been NA- or saline-treated. Each read represents a single cell (Supplementary Note). Graphs show the distribution of sequence variants by relative mutation rate between three experimental replicates of NA-treated and saline-treated cells sequenced with PacBio single-molecule long reads.
Extended Data Fig. 4
Extended Data Fig. 4. NA does not affect HTT transcription or translation
a, NA does not affect transcription across expanded repeats in HTT in HD patient cells, determined by quantitative real-time reverse transcriptase (qRT)-PCR and normalized to U6 RNA. Data are indicated as the mean ± s.d. of independent triplicates. b, Western blot showing that NA does not affect HTT translation in HD patient cells with (CAG)43. Western blots were repeated 4 times with similar results. Blots have been cropped and the corresponding full blots are available in the Source Data files.
Extended Data Fig. 5|
Extended Data Fig. 5|. NA induces contractions during R-loops processing.
a, Schematic of R-loop formation, processing, and analysis. Pre-formed double-R-loops were processed by terminally differentiated (retinoic acid) human neuron-like cell extracts (SH-SY5Y) in the absence or presence of NA (50 μM), as described and DNA repeat lengths scored as expansions, contractions, or stable, by the STRIP assay (Methods). b, Representative example of STRIP analysis. Transcription products were isolated, processed and transformed in E. coli cells, previously shown to stably maintain the (CAG)79•(CTG)79 lengths (Methods). Plasmids isolated from individual bacterial colonies were digested with restriction enzymes to release the repeat containing fragment, resolved on 4% polyacrylamide gels and scored for instability. c, Graphical analysis of STRIP results. Two-sided χ2 test was performed to compare 191 untreated colonies vs. 100 NA-treated colonies.
Extended Data Fig. 6
Extended Data Fig. 6. Dosing regimen
A single drug administration involved six separate stereotactic injections (three injections of drug in saline or saline into three different striatal regions of either the left or right striatum, respectively). At the onset mice were 6-weeks old.
Extended Data Fig. 7
Extended Data Fig. 7. Instability Index calculation
Instability index determination was as described,, using a relative peak height threshold, with modifications. To quantify the levels of instability from GeneMapper traces peak height was used to determine a relative threshold of 20% based upon the main peak in the shorter mode of the control striatum (see points 1 & 2 in the figure). We used a conservative threshold factor (20%) as this detects peaks with good signal intensity and is more resistant to amplification variation than lower thresholds. Lower thresholds (10%, 5%) can provide more sensitive quantification. Peaks falling below his threshold were excluded from analysis. Peak heights were scored (see point 3) and normalized to the total of all peak heights in a given scan (see point 4). Since we are comparing the effect of NA versus saline upon instability in the striatum, the CAG length distribution in tail is not a factor in this comparison, but is for determining absolute instability, as in previous studies,. So as to facilitate comparison between NA and saline-treated striatum, these were normalized by multiplying the values by the change in CAG length of each peak relative to the highest peak in saline-treated striatum (see point 5), as opposed to the highest peak in the tail, as previously done,. These normalized values (see point 6) were summed to generate the instability index (see point 7). Striatum analysis for mouse vi is shown as an example R6/2, 6-weeks treated with four injections spanning 4 weeks of saline (red) or NA (blue). Peaks of the main allele in the saline-treated striatum, NA-treated striatum and tail of the same mouse, are indicated by triangle-brackets at the top (see point 1).
Extended Data Fig. 8
Extended Data Fig. 8. A total of ten HD mice revealed consistent NA-induced contractions of expanded CAG repeats
Instability Indices in striatum of ten mice (iv-xiii) treated four times with saline in the right striatum and NA in the left striatum. Indices in NA-treated striatum were significantly different from the control saline-treated striatum (Mann-Whitney, P = 0.00035). Instability Indices for mouse v and xi are positive for both NA and saline as there are less data points to the left of the highest peak compared to the points to the right. Still, after NA treatment there is a reduction in the index.
Extended Data Fig. 9
Extended Data Fig. 9. NA does not induce cell death in the CNS and cell proliferation, and does not affect transcription across the Htt locus
a, Histological study, mouse striatum with saline, NA in saline, or no injection, followed by H&E staining. Three independent experiments were performed. b, NeuN staining showing that NA does not induce cell death. Quantification of NeuN positive cells below. Data are indicated as mean ± s.d. of triplicates. c, Doublecortin staining showing that NA does not induce cell proliferation. Three independent experiments were performed. d, The effect of NA on TUNEL signal as assessed via fluorescent microscopy and immunohistochemistry. Representative 40x magnification confocal images of striatal medium spiny neurons (MSNs) of R6/2 mice treated with sale (left striata) and 50 μM NA (right striata) stained for TUNEL (red, staining apoptotic cells), and DARPP32 (green, staining MSNs). Panel locations (i-vi) correspond to the locations outlined in Figure 7 (middle panels). e, NA does not affect transcription across expanded repeats in HTT in HD patient cells and mouse striatum, determined by quantitative real-time reverse transcriptase (qRT)-PCR and normalized to U6 RNA, expressed as the ratio of NA-treated vs. PBS-treated R6/2 striatum. Data are indicated as mean ± s.d. of independent triplicates.
Figure 1 |
Figure 1 |. NA binds to long CAG slip-outs.
a, Structure of NA comprising two heterocycles, naphthyridine (red) and 8-azaquinolone moiety (blue). b, Schematic of NA–(CAG)•(CAG) triad complex revealed by NMR spectroscopy. The (CAG)n DNA sequence (left) can fold into hairpins involving mismatched A-A pairs flanked by C-G and G-C pairs (middle). NA molecules intercalate into the DNA helix, with the 2-amino-1,8-naphthyridine moiety hydrogen bonding to guanine (in red) and 8-azaquinolone moiety hydrogen bonding to adenine (in blue), forcing the flipped-out cytosine bases. c, Binding of NA to gel-purified DNA fragments with (CAG)•(CAG) repeats in both strands flanked by 59 bp and 54 bp of non-repetitive DNA labeled with 32P-labeled on both strands (green star). d, Quantification of NA binding. Relative migration was measured as the ratio of migration distance of each NA-DNA complex to the migration distance of free DNA. Densitometric analysis was performed for the (CNG)1–3 DNA substrate. Graphs indicate the mean of three independent experiments +/− standard deviation (s.d.). e, Footprinting on (CAG)50•(CTG)30 uniquely 32P-labeled on the (CAG)50 strand, cleaved throughout the repeat using mung bean nuclease (MBN). In the presence of NA, all scissile sites (red arrows) with the exception of the hairpin tip, are protected, revealing binding specificity for the slip-out stem. Two independent experiments were performed with similar results. f, Gel-purified DNAs with a long (CAG)20 slip-out from (CAG)50•(CTG)30, 32P-labeled on both strands, were treated as indicated and resolved on 4% polyacrylamide. NA-DNA complexes formed with both the (CAG)50 strand (both panels) and the heteroduplexed (CAG)50•(CTG)30 (right panel) are shown by brackets; free DNA is indicated by arrowheads. NA did not bind (CTG)30 hairpin fragment in either experiment (white arrowheads), and did not inhibit re-hybridization of complementary strands. Two independent experiments were performed with similar results. Blots have been cropped and the corresponding full blots are available in the Source Data files.
Figure 2 |
Figure 2 |. NA specifically inhibits repair of long CAG slip-outs by human (HeLa) cell extracts.
a, Schematic of the in vitro repair assay. b-e, Starting DNAs and repair products (schematics) have the repeat-containing fragment released, resolved on PAGE and assessed on a molar level by Southern blotting and densitometry. Repair of DNA substrates containing a long (CAG)20 slip-out (b), a long (CTG)20 slip-out (c), a single CAG slip-out (d), or a G-T base-base mismatch (e), in the absence or presence of NA. Slipped-DNAs were hybrids of (CAG)50•(CTG)30, (CAG)30•(CTG)50 or (CAG)50•(CTG)49 (Methods),. Repair of the G-T mismatch reconstitutes a HindIII restriction site. Graphs show percentage repair efficiencies to repaired product relative to all repeat-containing fragments in the lane; values are normalized to the NA-free efficiency. Values represent the mean of three independent experiments ± s.d. Blots have been cropped and the corresponding full blots are available in the Source Data files.
Figure 3 |
Figure 3 |. NA cellular distribution, non-toxicity, and effects on repeat instability in HD patient cells.
a, NBD-labeled NA (green) was distributed throughout nuclei and cytoplasm of human HD primary fibroblasts with (CAG)43 (GM02191). Nuclei and cell membranes were stained with DAPI (blue) and Cell Light Plasma Membrane-RFP (red), respectively. Scale bar: 20 μM. Three independent experiments were performed. b, Cell toxicity of (CAG)43 cells treated with NA for 72 h. Viability estimated by WST-1 assays. Values represent means of three independent measures ± s.d.. c, Population doubling levels and percentage of cell viability of (CAG)43 cells treated with or without 50 μM NA. Error bars indicate the s.d. of three independent experiments. Unpaired two-tailed t-test was used to calculate P-values. d,e, Repeat instability was analyzed by small-pool-PCR across the HD repeat tract (Methods, see Supplementary Table 1). Histograms show repeat-length distributions in human HD primary fibroblasts with (CAG)180 (GM09197) or with (CAG)43 (GM02191), after 40 days growth +/− NA. Frequency distribution of repeat alleles is indicated as gray bars. Dashed line indicates peak CAG size. Allele lengths are grouped in bins spanning 10 repeats; >230 alleles were sized per group. Percentage of repeat population was calculated by dividing the number of alleles grouped in bins spanning 10 repeats by the number of total alleles. Shown is a summary of 3 independent experiments. P-values were calculated by χ2-test comparing the frequencies of expanded, unchanged, and contracted alleles in each set of experiments (Supplementary Table 1). f,g, Average (mean) repeat size in HD fibroblasts after 40 days incubation with or without NA. *P < 0.001, two-sided Student’s t test. Error bars: 99% confidence limits. h, Repeat lengths of the HTT (normal allele), CASK, and Mfd15 loci in HD fibroblast cells (after 40 days incubation +/− NA). Three independent experiments were performed. i, Rate of single base substitutions (SBS), insertions/deletions (INDELs), and double substitutions (DBS) in NA-treated HD cells with (CAG)43 or (CAG)180 compared to mock-treated cells. SBS/INDELs/DBS/rearrangements detected in the NA-treated (CAG)43 or (CAG)180 cells were 172/29/7/0 and 187/42/5/0, respectively. Dashed lines indicate the 0.8 mutations/Mb, which is the lowest burden observed in a typically “quiet” adult cancer (bone marrow myelodysplastic syndrome), and the 5–10 and 100–1,000 mutations/Mb in biallelic mismatch repair deficient cancers, with and without polExpo activity. Blots have been cropped and the corresponding full blots are available in the Source Data files.
Figure 4 |
Figure 4 |. NA induces CAG contractions, independent of proliferation, dependent on rCAG transcription.
a, Schematic transcription bubble, and representative data showing spPCR repeat length analysis of HT1080–(CAG)850 cells (initial cell clone and cells after 30 days incubation +/− NA) (Methods),. Scale at left shows molecular weight markers (M) converted into repeat number for CAG-repeat fragments of equivalent size. b, Histograms showing repeat length distributions, after 30 days incubation +/− NA, in proliferating HT1080-(CAG)850 cells, in which transcription was permissible. Mean repeat size change is shown below. Frequency distribution of unstable and stable alleles is shown by gray bars and black bars, respectively. Dashed lines indicates the unchanged CAG size. Allele lengths are grouped in bins spanning 50 repeats. Percentage of repeat population was calculated by dividing the number of alleles grouped in bins by the number of total alleles; >50 alleles were sized for each group (Supplementary Table 1). P-values were calculated by χ2-test. Error bars: 99% confidence limits. Shown is a summary of 3 independent experiments. c, RT–PCR analysis of the CAG repeat in HT1080-non-transcribing cells, showing that the transgene is integrated as a single copy. Three independent experiments were performed. d, BrdU-positive cells after 24 h incubation with BrdU in Palbociclib-treated HT1080-(CAG)850 cells. P-value was calculated by t-test. Data are the mean ± s.d. of triplicates. e, Histograms showing repeat length distributions after 30 days incubation with or without NA, in non-proliferating (Palbociclib-arrested) HT1080-(CAG)850 cells. Mean repeat size change is shown below. P-values were calculated by χ2-test (Supplementary Table 1). Error bars: 99% confidence limits. Shown is a summary of 3 independent experiments. f, Histograms showing repeat length distributions after 30 days incubation with or without NA, in non-transcribing HT1080-(CAG)850 cells. Mean repeat size change is shown below. P-values were calculated by χ2-test (Supplementary Table 1). Error bars: 99% confidence limits. Shown is a summary of 3 independent experiments. g, RNA transcript levels of transgene (transcript in the CAG-direction) in HT1080–(CAG)850 cells treated with or without NA (50 μM). Data are the mean ± s.d. of triplicates; t-test (two-sided) was used for independent biological triplicate experiments. Blots have been cropped and the corresponding full blots are available in the Source Data files.
Figure 5 |
Figure 5 |. NA affects interaction of DNA repair proteins on long CAG slip-outs.
a, MutSβ binding to radiolabelled slipped-DNA (CAG)50•(CTG)30 containing a single (CAG)20 slip-out at room temperature for 30 min. Addition of ATP (+/− Mg2+) disrupts binding of MutSβ to the DNA, as described. Addition of NA has no effect on binding or dissociation of MutSβ with this substrate. b, Histograms showing repeat length distributions in HT1080-(CAG)850 cells treated with control siRNA (left) and siRNA against MSH3 (right), +/− NA. Frequency distribution of unstable and stable alleles is shown by gray and black bars, respectively. Dashed lines indicate unchanged CAG size. Percentage of repeat population was calculated by dividing the number of alleles grouped in bins spanning 50 repeats by the number of total alleles; >50 alleles were sized for each group (Supplementary Table 1). P-values were calculated by χ2-test. Error bars: 99% confidence limits. Shown is a summary of 3 independent experiments. c, RPA (250 nM) binding to slipped-DNA (CAG)50•(CTG)30 containing a single (CAG)20 slip-out (lane 2), 32P-labeled on both strands (schematic on top). DNA was incubated with NA (50-microM) for 10 min at room temperature, prior to addition of RPA. Percentage of RPA-bound DNA quantified by densitometry. Histograms indicate mean of three independent experiments +/− s.d. d, Polymerase extension assay performed as described. (CAG)10 template oligo was annealed with a 32P-labeled primer and incubated +/−NA (50 μM) for 30 min at room temperature. 250 nM RPA and/or 20 nM Polδ was added and incubated for 15 min at 37 °C. Products were separated on a 6% sequencing gel together with Maxam-Gilbert sequencing reactions (lane 1). Primer only is in lane 2. Three independent experiments were performed. Blots have been cropped and the corresponding full blots are available in the Source Data files.
Fig. 6|
Fig. 6|. NA induces CAG contractions in R6/2 mouse striatum.
a, GeneMapper traces showing the distribution of CAG-repeat lengths in striatum from six representative 10-week-old R6/2 mice that received one (mouse 1), two (mice 2 and 3) or four (mice 4–6) injections of NA, over a 4-week period. NA, dissolved in saline, was injected into the left striatum (blue) and saline alone was injected into the right striatum (red). All mice treated four times are shown in Supplementary Figs. 3–6. b, The effect of one, two or four NA injections reflected by contraction and expansion instability indices (Methods),. c, The effect of one, two or four NA injections reflected by the relative composition of contractions and expansions (Methods),. d, The CAG length distributions by GeneMapper traces in the striatum, frontal cortex, cerebellum and tail from one representative R6/2 mouse (mouse 6) following four injections of NA into the left striatum, over a 4-week period. DNAs were isolated from the left (NA, blue) and right (saline, red) sides of the striatum, frontal cortex and cerebellum, and from the tail before (red) and after (green) NA treatment. The repeat size change is in brackets, with the first number representing the NA-induced contractions of the major peak relative to the somatic expansions without NA, and the second number representing the contractions relative to the inherited (tail) allele. The brackets do not account for the size changes in the second mode of the bimodal distribution in the striatum. e, Instability indices in various tissues shown in d, where the red and blue diamonds represent values of the saline-treated/right and NA-treated/left sides of the striatum, respectively. f, The repeat tract lengths of the Mapkap1 and Fgd4loci in both sides of the striatum from an R6/2 mouse with four injections. Three independent experiments were performed. Uncropped gels are available as source data.
Fig. 7|
Fig. 7|. NA induces a reduction in mHTT aggregates in R6/2 mice.
The effect of NA on mHTT aggregates in striatal MSNs of R6/2 mice treated with saline (right striata) and 50 μM NA (left striata), the slide indicates saline- and NA-treated halves with red and blue arrowheads, respectively. a, Top middle panel: a representative ×20 magnification epifluorescent image of a whole-brain slice stained for DARPP-32 (green, staining MSNs), mHTT aggregates (red) and counterstained with DAPI (blue). The numerals and associated dotted white squares mark the location of the corresponding representative ×40 magnification confocal images for saline-treated (i, ii, iii) and NA-treated (iv, v, vi) striata. The dotted lines demarcate borders of striatum (DARPP-32-positive cells) with the white dotted lines demarcating borders of striatal cell bodies (used for quantification) and the yellow dotted lines demarcating axons that form striatonigral bundles (not used for quantification). Bottom middle panel: the mHTT (red) channel alone. Scale bars, 19 μm (magnifications) and 500 μm (middle panels). b, Quantification by box plots of the red pixel intensity per striatal area in R6/2 mouse striatum treated with saline (right striata) and 50 μM NA (left striata) obtained via ImageJ quantification of ×20 mHTT/red channel epifluorescent images (4 mice total, 3 slides quantified per mouse, 30 images per mouse, 60–75 cells per image). An unpaired two-tailed t-test was used to compare the intensity of the red pixels in treated versus untreated striata. c, Quantification of the percentage of MSN nuclei containing mHTT aggregates in R6/2 mouse striatum treated with saline (right striata) and 50 μM NA (left striata) obtained via counting of mHTT-positive MSN nuclei in ×40 confocal images (4 mice total, 3 slides quantified per mouse, 10 images quantified per striata, ~50–100 cells per image). An unpaired two-tailed t-test was used to compare the percentage of MSN nuclei containing mHTT aggregates in treated versus untreated striata.
Figure 8 |
Figure 8 |. Schematic of the plausible mechanisms through which NA may induce contractions of expanded CAG tracts.
Schematic of transcription dependent slip-out formation and repair in the presence (green panel) or absence (white panel) of NA. See text for details.

Comment in

References

    1. Kennedy L et al. Dramatic tissue-specific mutation length increases are an early molecular event in Huntington disease pathogenesis. Hum Mol Genet 12, 3359–67 (2003). - PubMed
    1. Lopez Castel A, Cleary JD & Pearson CE Repeat instability as the basis for human diseases and as a potential target for therapy. Nat Rev Mol Cell Biol 11, 165–70 (2010). - PubMed
    1. Mirkin SM Expandable DNA repeats and human disease. Nature 447, 932–40 (2007). - PubMed
    1. Pearson CE, Nichol Edamura K & Cleary JD Repeat instability: mechanisms of dynamic mutations. Nat Rev Genet 6, 729–42 (2005). - PubMed
    1. Sathasivam K, Amaechi I, Mangiarini L & Bates G Identification of an HD patient with a (CAG)180 repeat expansion and the propagation of highly expanded CAG repeats in lambda phage. Hum Genet 99, 692–5 (1997). - PubMed

Publication types

MeSH terms