Review
. 2020 Jun 1;41(3):bnaa002.
doi: 10.1210/endrev/bnaa002.

Dynamics of ACTH and Cortisol Secretion and Implications for Disease

Affiliations
Review

Dynamics of ACTH and Cortisol Secretion and Implications for Disease

Stafford L Lightman et al. Endocr Rev. .

Abstract

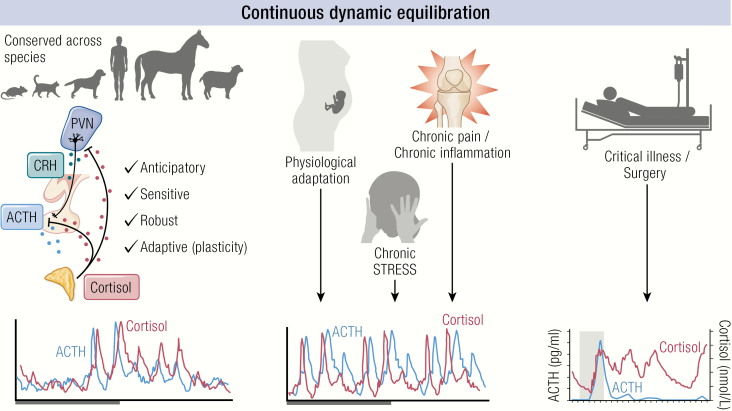
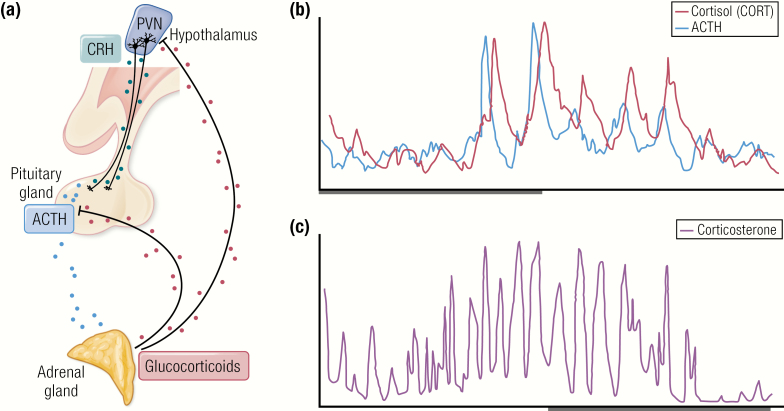
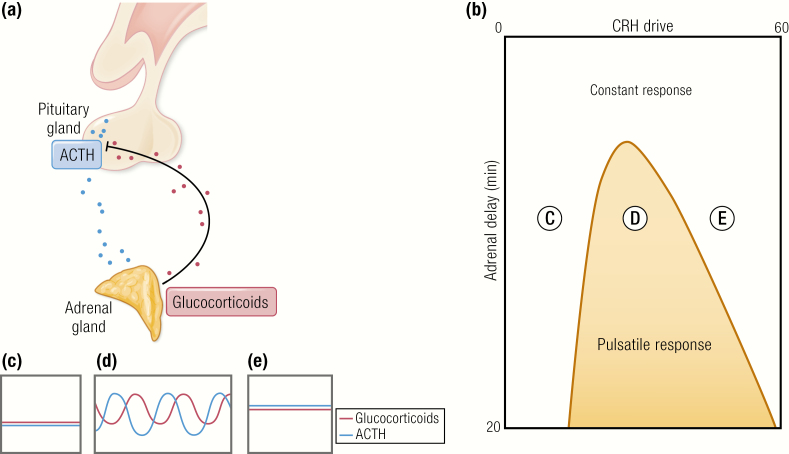
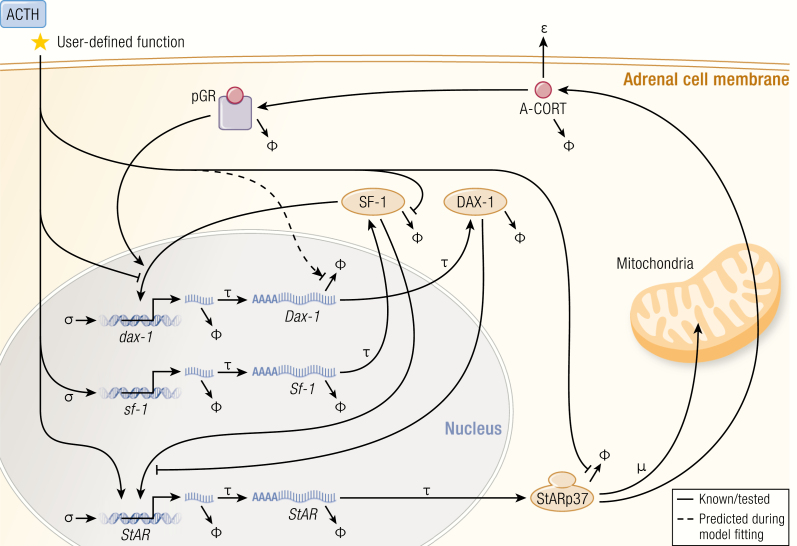
The past decade has seen several critical advances in our understanding of hypothalamic-pituitary-adrenal (HPA) axis regulation. Homeostatic physiological circuits need to integrate multiple internal and external stimuli and provide a dynamic output appropriate for the response parameters of their target tissues. The HPA axis is an example of such a homeostatic system. Recent studies have shown that circadian rhythmicity of the major output of this system-the adrenal glucocorticoid hormones corticosterone in rodent and predominately cortisol in man-comprises varying amplitude pulses that exist due to a subhypothalamic pulse generator. Oscillating endogenous glucocorticoid signals interact with regulatory systems within individual parts of the axis including the adrenal gland itself, where a regulatory network can further modify the pulsatile release of hormone. The HPA axis output is in the form of a dynamic oscillating glucocorticoid signal that needs to be decoded at the cellular level. If the pulsatile signal is abolished by the administration of a long-acting synthetic glucocorticoid, the resulting disruption in physiological regulation has the potential to negatively impact many glucocorticoid-dependent bodily systems. Even subtle alterations to the dynamics of the system, during chronic stress or certain disease states, can potentially result in changes in functional output of multiple cells and tissues throughout the body, altering metabolic processes, behavior, affective state, and cognitive function in susceptible individuals. The recent development of a novel chronotherapy, which can deliver both circadian and ultradian patterns, provides great promise for patients on glucocorticoid treatment.

Keywords: GR; HPA axis; MR; circadian; cortisol; dynamics; glucocorticoid; rhythms; ultradian.


Figures

Graphical Abstract
Graphical Abstract
Figure 1.
Figure 1.
The HPA axis and its hormonal output over the day. (A) A schematic of the HPA axis. CRH (and AVP) are secreted from the PVN. These hormones in turn, stimulate the secretion of ACTH from the anterior pituitary, which in turn, drives the secretion of glucocorticoids from the adrenal cortex. Automated blood sampling has enabled high resolution measurements of the circadian and ultradian profile of (B) ACTH and cortisol (CORT) in human over a 24-hour period and (C) corticosterone in rat.
Figure 2.
Figure 2.
Response of the pituitary–adrenal system to constant CRH drive. (A) Feed-forward feedback interplay between the pituitary and adrenal accounts for ultradian oscillations in glucocorticoid secretion. (B) Different combinations of constant CRH drive and delay can lead to 2 qualitatively different responses. On one side of the transition curve, when the CRH drive is low, the pituitary–adrenal system responds with constant levels in ACTH and glucocorticoid (C). On the other side of the transition curve, the pituitary–adrenal system responds with pulsatile fluctuations in the levels of ACTH and glucocorticoid, despite the fact that the CRH drive is constant (D). On the far right-hand side of the transition curve, when the CRH drive is highest, the pituitary–adrenal system again responds with constant levels in ACTH and glucocorticoid (E). Model predictions for ACTH (blue) and glucocorticoid (pink) are shown in C, D, and E. Walker et al. (57).Walker JJ, Terry JR, Lightman SL. Origin of ultradian pulsatility in the hypothalamic-pituitary-adrenal axis. Proc Biol Sci 2010;277:1627–1633. CC-BY OA. © 2010 Springer Nature.
Figure 3.
Figure 3.
The steroidogenic regulatory network. The synthesis of glucocorticoids in adrenocortical cells is governed at multiple levels by both genomic and nongenomic components indicated in this schematic. In order to constrain the complexity of the model only nodes shown to be involved in glucocorticoid-mediated feedback loops or in crosstalk with StAR are included. The model therefore consists of a set of delay differential equations (DDEs) that describes the ACTH stimulated dynamics of intra-adrenal glucocorticoid (A-CORT) levels and phosphorylation of GR (pGR, a marker of GR activation), and the expression of DAX-1, SF-1, and StAR. Symbology: σ accounts for the basal non-ACTH-dependent gene promoter activation rate. It is also more commonly known as “leaky transcription”. τ represents time delays, in this case, transcription and translation of each gene. ϕ represents degradation sinks for each molecular species, in this case heteronuclear RNAs (hnRNAs), mRNAs, and proteins. The model predicted that ACTH should modulate the half-life (stability or degradation rate) of Dax-1 mRNA, depicted here by the dashed line, and required in order to explain the data. μ represents a combination of 2 processes: the proteasome-mediated degradation of StARp37 as it progresses through the outer to inner mitochondrial membrane, and the import of StARp32 and StARp30 into mitochondria. ɛ represents the export rate of intra-adrenal glucocorticoid (A-CORT) out of adrenocortical cells. Spiga F, Zavala E, Walker JJ, Zhao Z, Terry JR, Lightman SL. Dynamic responses of the adrenal steroidogenic regulatory network. Proc Natl Acad Sci U S A 2017; 114:E6466-E6474. CC-BY OA © 2017 Springer Nature.
Figure 4.
Figure 4.
Comparison of MR or GR homodimers bound to a GRE. The sequence of the element, along with the 2 bound half sites, is shown below the structure. (A) The structure of 2 MR DBDs (each monomer depicted in a different shade of green) bound to a 17 base pair GRE shows the asymmetric unit of the crystal structure (84). (B) The structure of the GR DBD (each monomer depicted in a different shade of orange) bound to a similar GRE, with the exception that it is derived from the structure of the GR DBD bound to the FKBP5 GRE (85). (C) The steroid receptors have a highly conserved protein domain structure. The % sequence identity is indicated for each domain, relative to hGR. The size of each protein is indicated on the schematic; hGRalpha 777 amino acids, MR 984 amino acids, PR 934 amino acids, AR 919 amino acids, ERalpha 595 amino acids, ERbeta 477 amino acids. Abbreviations: NTD, N-terminal domain; DBD, DNA binding domain; LBD, ligand binding domain. GR and MR have a highly conserved DBD at 94% similarity. The LBD is also more similar between GR and MR than GR and other members of the steroid receptor family although at 57% identity there are some important structural and functional differences in ligand binding affinity and specificity. The NTD is the least similar between members of the steroid receptor family. AdaHudson WH, Youn C, Ortlund EA. Crystal structure of the mineralocorticoid receptor DNA binding domain in complex with DNA. PLoS One 2014;9:e107000. [Adapted under Open Access License.]
Figure 5.
Figure 5.
Key concepts underpinning the GR ultradian cycling model. (A) Pulsatile GFP-GR recruitment and loss from the MMTV array is visualized in real time during pulsatile glucocorticoid (CORT) addition to the MMTV array containing cell line. (B) Fluorescence intensity at the array relative to fluorescence intensity of the surrounding nucleoplasm is quantified and plotted in blue over timing of corticosterone (CORT) pulse addition to the cell culture media plotted in red. Stavreva DA, Wiench M, John S, Conway-Campbell BL, McKenna MA, Pooley JR, Johnson TA, Voss TC, Lightman SL, Hager GL. Ultradian hormone stimulation induces glucocorticoid receptor-mediated pulses of gene transcription. CC-BY OA Nat Cell Biol 2009;11:1093–1102. © 2009, Springer Nature. (C) The temporal dynamics of the system has been interrogated in the pituitary cell line AtT20, where pulsatile recruitment of GR, P300, CBP, and RNA-Pol2 to the Per1 proximal GRE is relative to the transient pulses of acetylation at the same site. Conway-Campbell BL, George CL, Pooley JR, Knight DM, Norman MR, Hager GL, Lightman SL. The HSP90 molecular chaperone cycle regulates cyclical transcriptional dynamics of the glucocorticoid receptor and its coregulatory molecules CBP/p300 during ultradian ligand treatment. Mol Endocrinol 2011;25:944–954. Reproduced with permission. Mol Endocrinol 2011; 25:944–954 © 2011, Endocrine Society. (D) A schematic representation of GR activity at the chromatin template during pulsatile peak and nadir. At the pulse peak, GR undergoes rapid cycling to efficiently sample GRE sites across the genome. At this time, GR can be detected as “enriched” by ChIP assay at cell-specific target regulatory sites. At the pulse nadir, GR in no longer “enriched” at these same sites when assessed in ChIP assays. Subsequent cycles of GR activity ‘ON’ and “OFF” the chromatin template closely follow the peaks and troughs of each glucocorticoid pulse.
Figure 6.
Figure 6.
Dynamics of glucocorticoid receptor and mineralocorticoid receptor during ultradian glucocorticoid exposure. (A) Representative plot (adapted from (92)) showing temporal dynamics of hippocampal GR and MR activation times in relation to 2 intravenous corticosterone (CORT) pulses administered to adrenalectomized rats. (B) Area-proportional Venn diagrams show the proportions of GR and MR MACS2 binding sites that directly overlap by at least 1 bp between treatments (i) vehicle, (ii) CORT pulse, and (iii) washout period after CORT pulse. (C) University of California Santa Cruz Genome Browser image at the Fkbp5 gene shows comparison of mapped MR and GR ChIP-nexus data for each treatment group. Rivers CA, Rogers MF, Stubbs FE, Conway-Campbell BL, Lightman SL, Pooley JR. Glucocorticoid receptor-tethered mineralocorticoid receptors increase glucocorticoid-induced transcriptional responses. Endocrinology 2019;160:1044–1056 (B and C; 108). Reproduced with permission Endocrinology 2019; 160:1044–1056. © Endocrine Society.
Figure 7.
Figure 7.
Schematic representation of experimental design and patterns of hydrocortisone replacement. (A) Protocol design and ABS profiles showing the circulating cortisol pattern with either (B) oral hydrocortisone dosing, or subcutaneous pump infusion of (C) pulsatile hydrocortisone or (D) constant hydrocortisone. From (134) and (135).
Figure 8.
Figure 8.
Crosstalk between the adrenal steroidogenic regulatory network and the immune pathway. During the inflammatory response induced by LPS, the synthesis of glucocorticoids in adrenocortical cells is modulated by the immune pathway through cytokines. The SRN, in turn, feeds back upon the cytokines signaling pathways. The Spiga et al. mathematical model has therefore also integrated these cytokine effects on the steroidogenic response to LPS. Their model predicts sustained induction of adrenal glucocorticoid (A-CORT) and inhibition of pGR, transient induction of SF-1 and StAR transcription, transient inhibition of DAX-1 gene expression, and SF-1, StAR, and DAX-1 mRNA and protein dynamics that were then shown experimentally in LPS treated rats. From (69). Spiga F, Zavala E, Walker JJ, Zhao Z, Terry JR, Lightman SL. Dynamic responses of the adrenal steroidogenic regulatory network. Proc Natl Acad Sci U S A 2017;114:E6466–E6474. CC-BY OA. 2017, Springer Nature

Similar articles

Cited by

References

    1. Lightman SL, Conway-Campbell BL. The crucial role of pulsatile activity of the HPA axis for continuous dynamic equilibration. Nat Rev Neurosci. 2010;11(10):710–718. - PubMed
    1. Herman JP, McKlveen JM, Ghosal S, et al. Regulation of the hypothalamic-pituitary-adrenocortical stress response. Compr Physiol. 2016;6(2):603–621. - PMC - PubMed
    1. Herman JP, Figueiredo H, Mueller NK, et al. Central mechanisms of stress integration: hierarchical circuitry controlling hypothalamo-pituitary-adrenocortical responsiveness. Front Neuroendocrinol. 2003;24(3):151–180. - PubMed
    1. Eliava M, Melchior M, Knobloch-Bollmann HS, et al. A new population of parvocellular oxytocin neurons controlling magnocellular neuron activity and inflammatory pain processing. Neuron. 2016;89(6):1291–1304. - PMC - PubMed
    1. Mohr E, Bahnsen U, Kiessling C, Richter D. Expression of the vasopressin and oxytocin genes in rats occurs in mutually exclusive sets of hypothalamic neurons. FEBS Lett. 1988;242(1):144–148. - PubMed

Publication types