. 2020 Sep 1;528(13):2174-2194.
doi: 10.1002/cne.24883. Epub 2020 Feb 28.

Characterization of Drosophila octopamine receptor neuronal expression using MiMIC-converted Gal4 lines

Affiliations

Characterization of Drosophila octopamine receptor neuronal expression using MiMIC-converted Gal4 lines

Hannah M McKinney et al. J Comp Neurol. .

Abstract

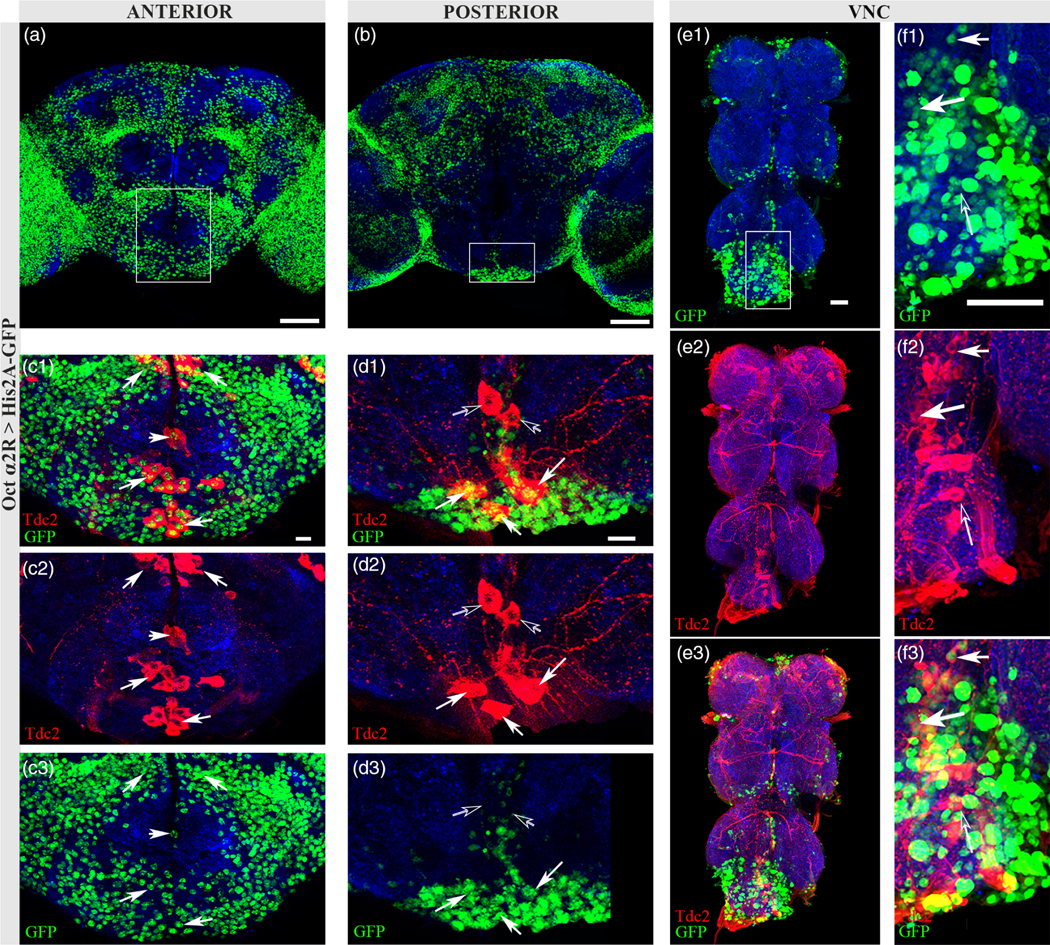
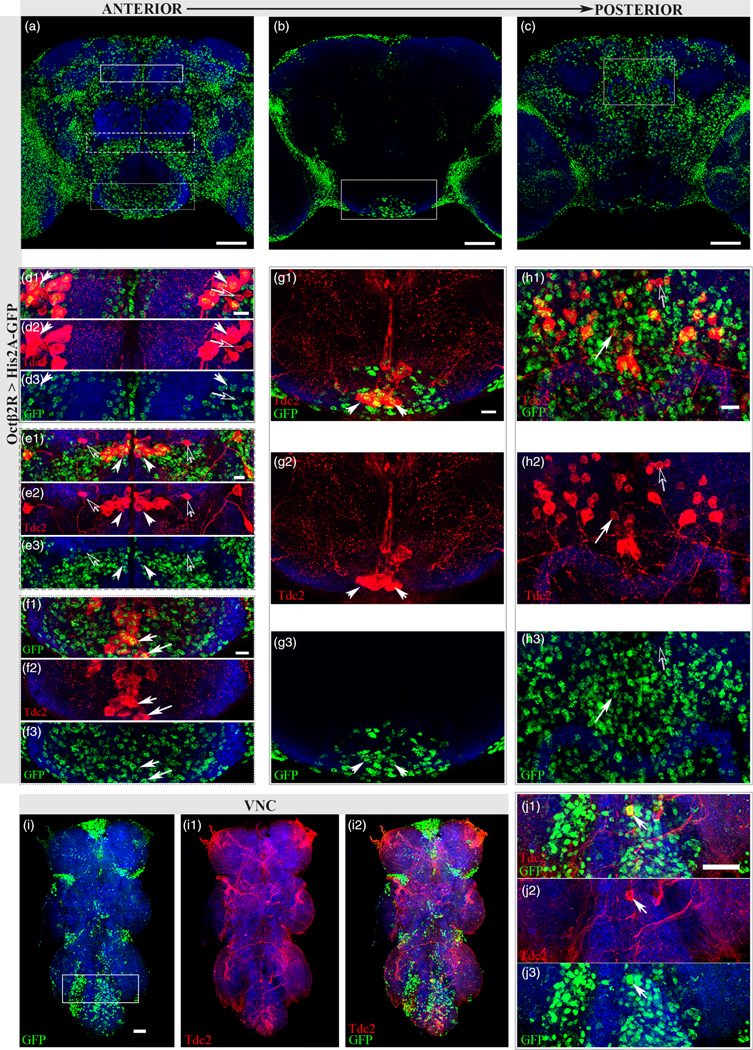
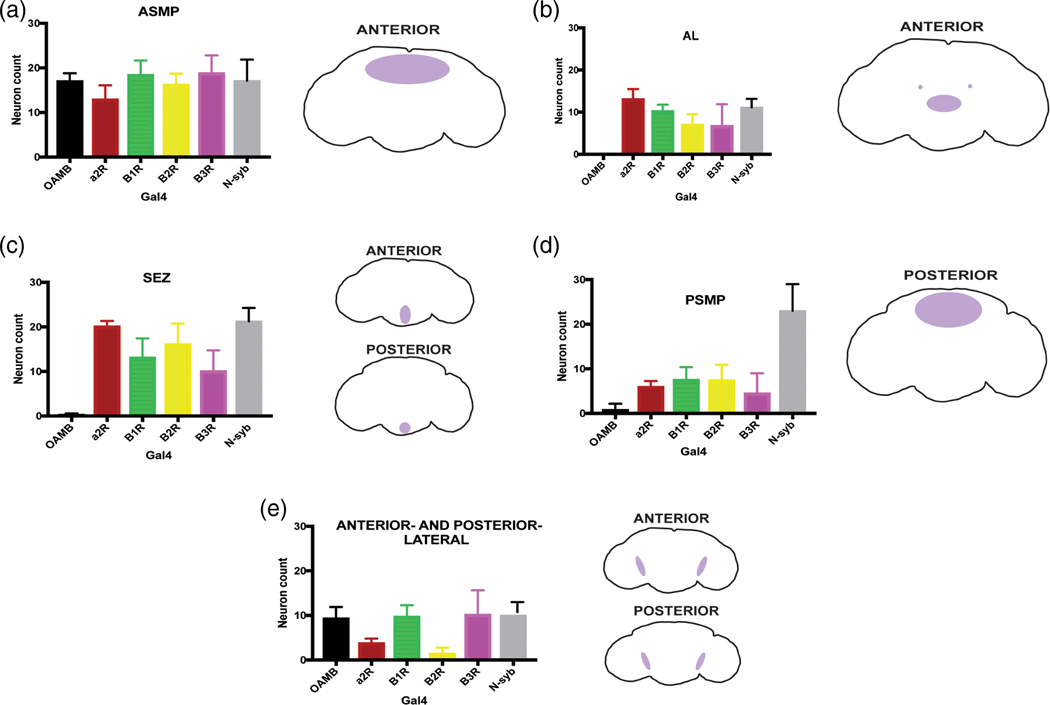
Octopamine, the invertebrate analog of norepinephrine, is known to modulate a large variety of behaviors in Drosophila including feeding initiation, locomotion, aggression, and courtship, among many others. Significantly less is known about the identity of the neurons that receive octopamine input and how they mediate octopamine-regulated behaviors. Here, we characterize adult neuronal expression of MiMIC-converted Trojan-Gal4 lines for each of the five Drosophila octopamine receptors. Broad neuronal expression was observed for all five octopamine receptors, yet distinct differences among them were also apparent. Use of immunostaining for the octopamine neurotransmitter synthesis enzyme Tdc2, along with a novel genome-edited conditional Tdc2-LexA driver, revealed all five octopamine receptors express in Tdc2/octopamine neurons to varying degrees. This suggests autoreception may be an important circuit mechanism by which octopamine modulates behavior.

Keywords: Drosophila; RRID:AB_221568; RRID:AB_2340686; RRID:AB_2340850; RRID:AB_2536611; RRID:AB_2633280; RRID:AB_2814891; RRID:BDSC_27392; RRID:BDSC_42119; RRID:BDSC_43050; RRID:BDSC_57940; RRID:BDSC_59133; RRID:BDSC_60312; RRID:BDSC_60313; RRID:BDSC_67636; RRID:BDSC_68264; autoreception; octopamine; octopamine receptor.


Figures

FIGURE 1
FIGURE 1
Expression patterns of MiMIC OctR-Gal4 lines. Nuclear expression patterns in male adult brains for (a1) OAMB > His2A-GFP, (a2) Octα2R > His2A-GFP, (a3) Octβ1R > His2A-GFP, (a4) Octβ2R > His2A-GFP, (a5) Octβ3R > His2A-GFP; genomic locations of MiMIC insertions retrieved from flybase.org for (b1) OAMB-Gal4, (b2) Octα2R, (b3) Octβ1R, (b4) Octβ2R, (b5) Octβ3R; expression patterns using a plasma membrane reporter (c1) OAMB > CD8-mCherry, (c2) Octα2R > CD8-mCherry, (c3) Octβ1R > CD8-mCherry, (c4) Octβ2R > CD8-mCherry, (c5) Octβ3R > CD8-mCherry. Scale bar = 75 μm. Antibodies used: anti-mCherry (green) and anti-SYN (blue)
FIGURE 2
FIGURE 2
OAMB is expressed in a subset of Oct neurons. (a1) Tdc2 expression (red) in a control UAS-His2A-GFP/+ brain. Scale bar = 50 μm (a2) Anterior optical sections of (a1) outlining Tdc2+ neuronal clusters (uppercase): ASM cluster in the ASMP (anterior superior medial protocerebrum), AL (antennal lobe) clusters AL1 and AL2, VL (ventrolateral), SEZ (subesophageal ganglion) (a3) Posterior sections of (a1): PSM and PB1 clusters in posterior superior medial protocerebrum (PSMP), PB2 cluster in pb (protocerebral bridge), oes (esophagus), SEZ (b) Anterior sections (46–76) of OAMB > His2A-GFP. Scale bar = 50 μm. (c1–c3) Solid white rectangle from b showing co-expression of Tdc2 (red) and OAMB (green) in the ASM cluster of Tdc2 neurons (closed arrows) and neurons with no co-expression (open arrows). Scale bar = 10 μm. (d1–d3) Dashed rectangle from (b) showing no co-expressing neurons in the SEZ (open arrows) Scale bar = 10 μm. (e) Posterior sections (1–37) of OAMB > His2A-GFP. Scale bar = 50 μm. (f1–f3) Solid white rectangle from (e) showing no discernible co-expression in the SEZ (open arrows). (g) Dashed rectangle from (e) showing no co-expression seen in the PSMP region of the brain (open arrows). Scale bar = 10 μm. Antibodies used: anti-Tdc2 (red), anti-GFP (green), and anti-SYN (blue). (h1–h3) Nuclear GFP (h1, green) expression pattern in adult VNC with Tdc2 (h2, red) co-expression (h3, closed white arrow). Scale bar =30 μm. (i1–i3) Solid rectangle from (h1) showing neurons co-expressing with Tdc2 (closed white arrow) and neurons without Tdc2 co-expression (open white arrow) in the VNC. Scale bar = 30 μm. Antibodies used (h1–i3): anti-brp (blue), anti-GFP (green), anti-Tdc2 (red)
FIGURE 3
FIGURE 3
Octα2R is expressed in a subset of Oct neurons. (a) Anterior optical sections (58–79) of Octα2R > His2A-GFP. Scale bar = 50 μm.(b) Posterior sections (3–37) of Octα2R > His2A-GFP. Scale bar = 50 μm. (c1–c3) Solid white rectangle from (a) showing co-expression of nuclear GFP (green) in Tdc2-stained somata (red) of the SEZ (closed arrows). Scale bar = 10 μm. (d1–d3) Solid white rectangle from (b) showing co-expression (closed arrows) of Tdc2 and nuclear GFP in posterior SEZ neurons. Open arrows indicate a single pair of SEZ neurons with no co-expression. Scale bar = 10 μm. Antibodies used: anti-GFP (green), anti-SYN (blue), anti-Tdc2 (red). (e1–e3) Nuclear GFP (e1, green) expression pattern in adult VNC with Tdc2 (e2, red) co-expression (e3, closed white arrows). Scale bar = 30 μm. (f1–f3) Solid rectangle from (e1) showing co-expression (closed white arrows) and at least one neuron with no co-expression (open arrow) in the VNC. Scale bar = 30 μm. Antibodies used (e1–f3): anti-brp (blue), anti-GFP (green), and anti-Tdc2 (red)
FIGURE 4
FIGURE 4
Octβ1R is expressed in a subset of Oct neurons. (a) Anterior sections (26–33) of Octβ1R > His2A-GFP showing broad GFP expression. Scale bar = 50 μm. (b) Posterior sections (6–14) of Octβ1R > His2A-GFP. Scale bar = 50 μm. (c–c2) Solid white rectangle from (a) showing co-expression of Octβ1R > His2A-GFP (green) in the AL2 cluster Tdc2+ neurons (red). Scale bar = 10 μm. (d–d2) Dashed rectangle from (b) showing Octβ1R co-expression in the Tdc2+ (red) PB1 cluster (closed arrows). Neurons negative for co-expression are illustrated with open arrows. Scale bar = 10 μm. (e1–e3) Solid white rectangle from (b) showing co-expression of Octβ1R > His2A-GFP (green) in Tdc2+ neurons (red) in posterior SEZ (closed arrows). Scale bar = 10 μm. Antibodies used: anti-GFP (green), anti-Tdc2 (red), anti-SYN (blue). (f1–f3) Nuclear GFP (f1, green) expression pattern in adult VNC with Tdc2 (f2, red) co-expression (f3, closed white arrow). Scale bar = 30 μm. (g1–g3) Solid rectangle from (f1) showing a neuron without co-expression with Tdc2 (open arrow). Scale bar =30 μm. Antibodies used (f1–g3): anti-brp (blue), anti-GFP (green), anti-Tdc2 (red)
FIGURE 5
FIGURE 5
Octβ2R expresses in a subset of Oct neurons. (a) Anterior sections (70–93) of Octβ2R > His2A-GFP. Scale bar = 50 μm. (b) Middle sections (36–65) of Octβ2R > His2A-GFP. Scale bar = 50 μm. (c) Posterior sections (15–31) of Octβ2R > His2A-GFP. Scale bar 50 μm. (d1–d3) Solid white rectangle from (a) showing co-expression of Tdc2 (red) and Octβ2R > His2A-GFP(green) in the ASM cluster (closed arrows) with at least one pair of Tdc2 neurons showing no co-expression (open arrows). Scale bar = 10 μm (e1–e3) Dashed rectangle from (a) indicating co-expression of Tdc2 (red) and Octβ2R > His2A-GFP (green) in AL2 cluster (closed white arrows). A pair of AL1 neurons (open white arrows) did not exhibit co-expression. Scale bar = 10 μm. (f1–f3) Dotted rectangle from (a) showing co-expression in the anterior section of the SEZ (closed arrows). Scale bar = 10 μm (g1–g3) Solid white rectangle from (b) showing co-expression in the SEZ. Scale bar = 10 μm. (h1–h3) Some co-expression of Tdc2 and Octβ2R > His2A-GFP (closed arrows) and neurons not showing co-expression (open arrows) in the PB1 cluster of the PSMP region. Scale bar = 10 μm. Antibodies used: anti-Tdc2 (red), anti-GFP (green) and anti-SYN (blue). (i1–i3) Nuclear GFP (i1, green) expression pattern in adult VNC with Tdc2 (i2, red) co-expression in one neuron (i3). Scale bar = 30 μm. (j1–j3) Solid rectangle from (i1) with only one neuron showing co-expression with Tdc2 (closed white arrow). Scale bar = 30 μm. Antibodies used (f1–g3): anti-brp (blue), anti-GFP (green), anti-Tdc2 (red)
FIGURE 6
FIGURE 6
Octβ3R is expressed in a subset of Oct neurons. (a) Anterior sections (32–42) of Octβ3R > His2A-GFP. Scale bar = 50 μm. (b) Posterior sections (0–26) of Octβ3R > His2A-GFP. Scale bar = 50 μm. (c1-c3) White rectangle from (a) showing co-expression in the ASM cluster of Tdc2 neurons (closed arrows). Scale bar = 10 μm. (d1–d3) White rectangle from (b) showing some co-expression in PSMP cluster of Tdc2 neurons (closed arrows) and some neurons negative for co-expression (open arrows). Scale bar 10 μm. Antibodies used: anti-Tdc2 (red), anti-GFP (green) and anti-SYN (blue). (e1–e3) Nuclear GFP (e1, green) expression pattern in adult VNC with Tdc2 (e2, red) co-expression (e3). Scale bar = 30 μm. (f1–f3) Solid rectangle from (e1) showing co-expression with Tdc2 (closed white arrow) and neurons showing no co-expression (open arrow). Scale bar = 30 μm. Antibodies used: anti-brp (blue), anti-GFP (green), anti-Tdc2 (red)
FIGURE 7
FIGURE 7
Examination of sex differences among OctR-Gal4 lines. Full z-stacks of anterior and posterior sections of male and female brains with overlapping Tdc2 stain. (a1–b2) OAMB-Gal4 > His2A-GFP, (c1–d2) Octα2R-Gal4 > His2A-GFP, (e1–f2) Octβ1R-Gal4 > His2A-GFP, (g1–h2) Octβ2R-Gal4 > His2A-GFP, and (i1–j2) Octβ3R-Gal4 > His2A-GFP. Scale bars = 50 μm. Antibodies used: anti-SYN (blue), anti-GFP (green), anti-Tdc2 (red)
FIGURE 8
FIGURE 8
B3RT-Tdc2 expression in α-adrenergic-like receptors. (a) Schematic of B3RT-Tdc2-LexA. CRISPR/Cas9 genome editing was used to insert same orientation B3 recombinase target sites (B3RTs) into the 5′ untranslated region (UTR) of the Tdc2 gene and into the intron between the first two Tdc2 coding exons. The coding sequence of the LexA transcription factor was also inserted immediately adjacent to the downstream B3RT. The B3 recombinase mediates excision between the B3RT’s in all neurons that express the B3 recombinase using a Gal4 driver and UAS-B3. After the excision, a Tdc2-LexA driver is created and is expressed only in the subset of Gal4-expressing neurons that also express Tdc2 and not in Gal4-expressing neurons that do not express Tdc2. Black rectangles are untranslated exons, white rectangles are coding exons, red rectangles are B3RTs, and yellow rectangles are coding LexA sequence. (b) Control B3RT-Tdc2 with no Gal4 driver, anti-mCherry (red), anti-SYN (blue), anti-GFP (green). (c) Germline excision of B3RT-Tdc2 (see Section 2), where Tdc2-LexA is expressed in all Tdc2 neurons, anti-syn (blue), anti-mCherry (red), anti-Tdc2 (green). (d1–d3) Nuclear expression of n-syb-Gal4 (d3, anti-GFP, green) and subset of nsyb-Gal4 neurons that express Tdc2 (d2, anti-mCherry, red), anti-SYN (blue) yw; B3RT-Tdc2, nsyb-Gal4; LexAop2-His2B-mCherry, UAS-His2A-GFP. (e1–e3) OAMB > His2A-GFP (e3, anti-GFP, green) and the subset of OAMB-Gal4 neurons which express Tdc2 (e2, anti-mCherry, red), anti-SYN (blue): yw; B3RT-Tdc2; LexAop2-His2B-mCherry, UAS-His2A-GFP/OAMB-Gal4. (f1–f3) Octα2R > His2A-GFP (f3, anti-GFP, green) and subset of Octα2-Gal4 neurons which express Tdc2 (f2, anti-mCherry, red), anti-SYN (blue): yw; B3RT-Tdc2; LexAop2-His2B-mCherry, UAS-His2A-GFP/Oct2R-Gal4. All scale bars 50 μm
FIGURE 9
FIGURE 9
B3RT-Tdc2 expression in OctβR-Gal4s. (a1–a3) yw; B3RT-Tdc2; LexAop2-His2B-mCherry, UAS-His2A-GFP/Octβ1R-Gal4 showing subset of Octβ1R-Gal4 neurons which also express Tdc2 (a2, red), only the Gal4 pattern (a3, green) and merged (a1). (b1–b3) yw; B3RT-Tdc2; LexAop2-His2B-mCherry, UAS-His2A-GFP/Octβ2R-Gal4 showing subset of Octβ2R-Gal4 neurons that also express Tdc2 (b2, red), only the Gal4 pattern (b3, green) and merged (b1). (c1–c3) yw; B3RT-Tdc2; LexAop2-His2B-mCherry, UAS-His2A-GFP/Octβ3R-Gal4 showing subset of Octβ3R-Gal4 neurons that also express Tdc2 (c2, red), only the Gal4 pattern (c3, green) and merged (c1). Antibodies used: anti-GFP (green), anti-mCherry (red), and anti-SYN (blue). Scale bar = 50 μm
FIGURE 10
FIGURE 10
Average number of co-expressing OctR-Gal4/B3RT-Tdc2 neurons. Co-expressing Gal4 > His2A-GFP/Tdc2-LexA > His2B-mCherry neurons were manually counted in brain regions (a) anterior superior medial protocerebrum (ASMP), (b) antennal lobe (AL), (c) suboesophageal ganglion (SEZ), (d) posterior superior medial protocerebrum (PSMP), and (e) anterior- and posterior-lateral regions. OAMB-Gal4 (n = 12), Octα2R-Gal4 (n = 6), Octβ1R-Gal4 (n = 10), Octβ2R-Gal4 (n = 10), Octβ3R-Gal4 (n = 9), N-syb-Gal4 (n = 8)
FIGURE 11
FIGURE 11
KDRT-GluRIA expression in α-adrenergic-like receptors. (a) vGlut-Gal4; UAS-dsRed (red) and anti-Tdc2 (green) showing distinct co-localization, indicative of dual transmitting neurons (white arrows). Scale bar 30 μm. (b) Schematic of KDRT-GluRIA-QF2 construct. The first KD recombination target site (KDRT) was CRISPR’d upstream of the endogenous locus of the GluRIA translation start site within the 5′ untranslated region (UTR) while the second KDRT was placed in an intron downstream of the translation start site, directly preceding a QF2 driver sequence. Prior to the excision of the DNA the two KDRTs flank, no QF2 expression occurs. After the excision mediated by the KD recombinase, a null mutation in the GluRIA gene is formed, along with a GluRIA-QF2 driver, which can drive the expression of our QUAS reporter of interest. (c1–c3) Pan-neuronal Gal4 driving expression of the KD recombinase in the subset of n-syb-Gal4 neurons that express GluRIA (c2, red). yw;n-syb-Gal4; KDRT-GluRIA, UAS-KD, UAS-His2A-GFP, QUAS-His2B-mCherry. (d) Germline excision of KDRT-GluRIA driving expression of QUAS-His2B-mCherry in all GluRIA-expressing neurons (red). (e1–e3) OAMB-His2A-GFP pattern (e3, green), subset of OAMB-Gal4 neurons expressing GluRIA (e2, red), and merged channels (e1) yw; UAS-KD, UAS-His2A-GFP, QUAS-His2B-mCherry; KDRT-GluRIA, OAMB-Gal4. Closed white arrow indicating four PENP neurons co-expressing OAMB and GluRIA. (f1–f3) Octα2R > His2A-GFP pattern (f3, green) and subset of Octα2R-Gal4 neurons expressing GluRIA (f2, red), with broad expression seen in optic lobes. Merged channels (f1) yw; UAS-KD, UAS-His2A-GFP, QUAS-His2B-mCherry; KDRT-GluRIA, Octα2R-Gal4. Closed white arrow indicating four PENP neurons co-expressing Octα2R and GluRIA. Antibodies used: anti-GFP (green), anti-mCherry (red), and anti-SYN (blue). All scale bars = 50 μm unless otherwise specified
FIGURE 12
FIGURE 12
KDRT-GluRIA expression in OctβR-Gal4s. (a1–a3) yw; UAS-His2A-GFP, QUAS-His2B-mCherry; KDRT-GluRIA, UAS-KD/Octβ1R-Gal4 showing subset of Octβ1R-Gal4 neurons in the anterior sections (a3, green) that also express GluRIA (a2, red), and merged channels (a1) with closed white arrow indicating at least one neuron co-expressing Octβ1R and GluRIA in the anterior SEZ. Very little co-expression was seen in the central brain, with the majority seen in the optic lobes. (b1–b3) yw; UAS-His2A-GFP, QUAS-His2B-mCherry; KDRT-GluRIA, UAS-KD/Octβ2R-Gal4 labeling the subset of Octβ2R-Gal4 neurons in the anterior sections (b3, green) also expressing GluRIA (b2, red), and merged channels (b1) with closed white arrow indicating at least one neuron co-expressing Octβ2R and GluRIA in the anterior SEZ. (c1–d3) yw; UAS-His2A-GFP, QUAS-His2B-mCherry; KDRT-GluRIA, UAS-KD/Octβ3R anterior (c) and posterior (d) sections showing the subset of Octβ3R-Gal4 neurons (c3, d3, green) also expressing GluRIA (c2, d2, red) and merged channels (c1,d1). Closed white arrows indicate co-expressing neurons in anterior and posterior superior medial protocerebrum. (e1–e3) yw; UAS-His2A-GFP, QUAS-His2B-mCherry/Tdc2-Gal4-AD, vGlut-Gal4-DBD; KDRT-GluRIA, UAS-KD labeling GluRIA-expressing neurons (e2) within the subset of neurons labeled by the Tdc2/vGlut split Gal4 (e3) and merged channels (e1). Closed white arrows indicate co-expressing neurons in the SEZ. Stained with anti-GFP (green), anti-mCherry (red), and anti-SYN (blue). Scale bars = 50 μm
FIGURE 13
FIGURE 13
Dual transmission and postsynaptic receptor scenarios. In dual transmitting neurons, neurotransmitters are either packaged in synaptic vesicles together (a, presynaptic) or separately (b,c, presynaptic) and may be released at the same synapse (a, presynaptic) or separate ones (b,c, postsynaptic). From our experiments here, we show OctR expression in Tdc2+ neurons, which are indicate autoreception properties as shown in (a) and (c). Additional data indicates potential GluRIA autoreception as seen in (a) and (b). Postsynaptically, receptors may be expressed together (a, postsynaptic) or on different neurons (b,c, postsynaptic). Our data indicate a number of neurons express OctR and a GluRIA, as in (a)

Similar articles

Cited by

References

    1. Aguilar JI, Dunn M, Mingote S, Karam CS, Farino ZJ, Sonders MS, … Freyberg Z. (2017). Neuronal depolarization drives increased dopamine synaptic vesicle loading via VGLUT. Neuron, 95(5), 1074–1088 e1077. 10.1016/j.neuron.2017.07.038 - DOI - PMC - PubMed
    1. Andrews JC, Fernandez MP, Yu Q, Leary GP, Leung AK, Kavanaugh MP, … Certel SJ (2014). Octopamine neuromodulation regulates Gr32a-linked aggression and courtship pathways in drosophila males. PLoS Genetics, 10(5), e1004356. 10.1371/journal.pgen.1004356 - DOI - PMC - PubMed
    1. Balfanz S, Strunker T, Frings S, & Baumann A. (2005). A family of octopamine [corrected] receptors that specifically induce cyclic AMP production or Ca2+ release in Drosophila melanogaster. Journal of Neurochemistry, 93(2), 440–451. 10.1111/j.1471-4159.2005.03034.x - DOI - PubMed
    1. Busch S, Selcho M, Ito K, & Tanimoto H. (2009). A map of octopaminergic neurons in the Drosophila brain. The Journal of Comparative Neurology, 513(6), 643–667. 10.1002/cne.21966 - DOI - PubMed
    1. Certel SJ, Leung A, Lin CY, Perez P, Chiang AS, & Kravitz EA (2010). Octopamine neuromodulatory effects on a social behavior decision-making network in drosophila males. PLoS One, 5(10), e13248. 10.1371/journal.pone.0013248 - DOI - PMC - PubMed

Publication types

MeSH terms

LinkOut - more resources