. 2020 Feb:52:102651.
doi: 10.1016/j.ebiom.2020.102651. Epub 2020 Feb 12.

MiR-18a-downregulated RORA inhibits the proliferation and tumorigenesis of glioma using the TNF-α-mediated NF-κB signaling pathway

Affiliations

MiR-18a-downregulated RORA inhibits the proliferation and tumorigenesis of glioma using the TNF-α-mediated NF-κB signaling pathway

Yang Jiang et al. EBioMedicine. 2020 Feb.

Abstract

Background: Glioma has a poor prognosis, and is the most common primary and lethal primary malignant tumor in the central nervous system. Retinoic acid receptor-related orphan receptor A (RORA) is a member of the ROR subfamily of orphan receptors and plays an anti-tumor role in several cancers.

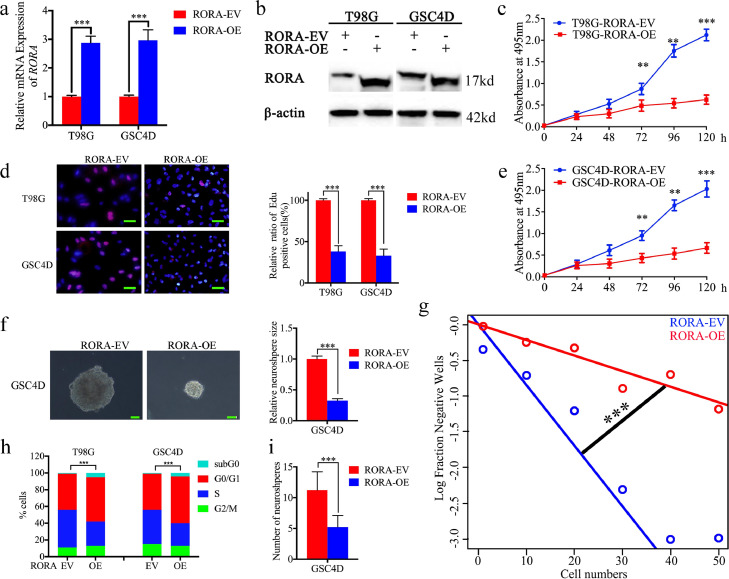
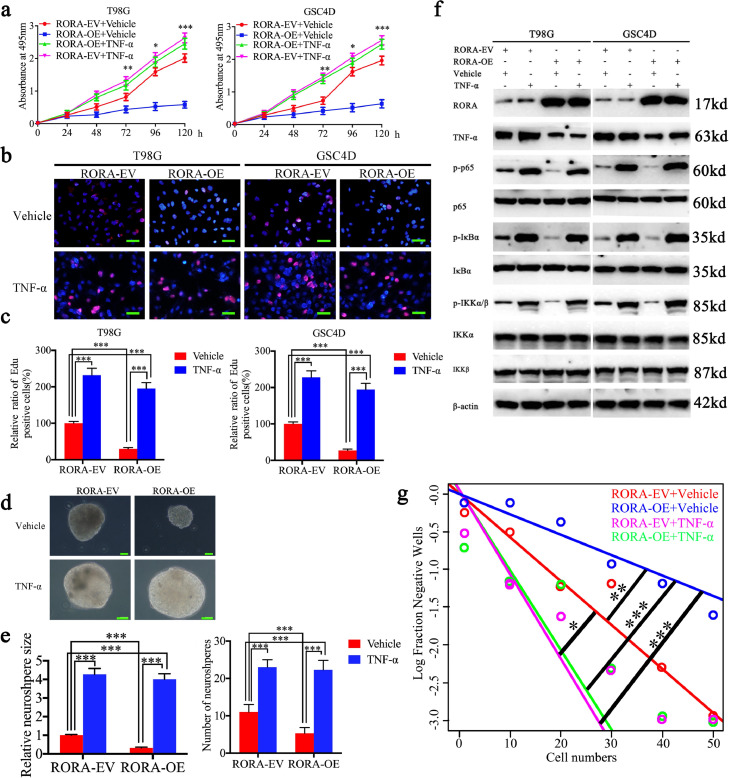
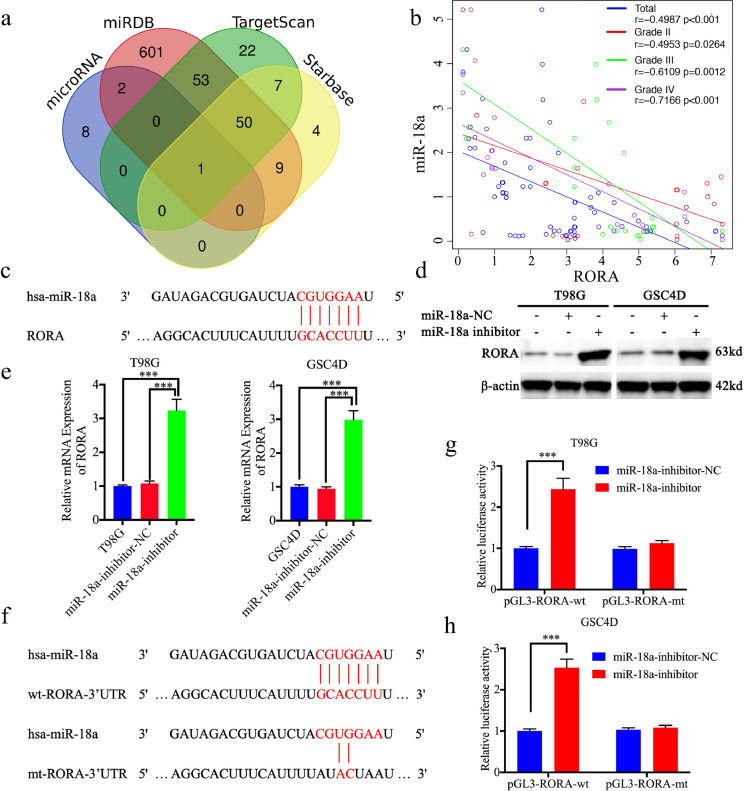
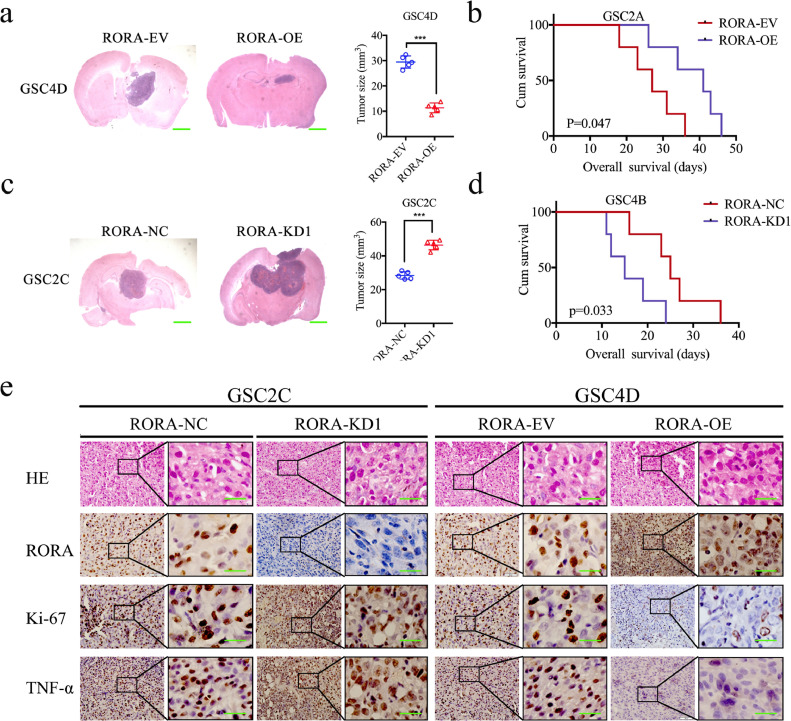
Methods: A cell viability assay, the Edu assay, neurosphere formation assay, and xenograft experiments were used to detect the proliferative abilities of glioma cell line, glioma stem cells (GSCs). Western blotting, ELISAs, and luciferase reporter assays were used to detect the presence of possible microRNAs.

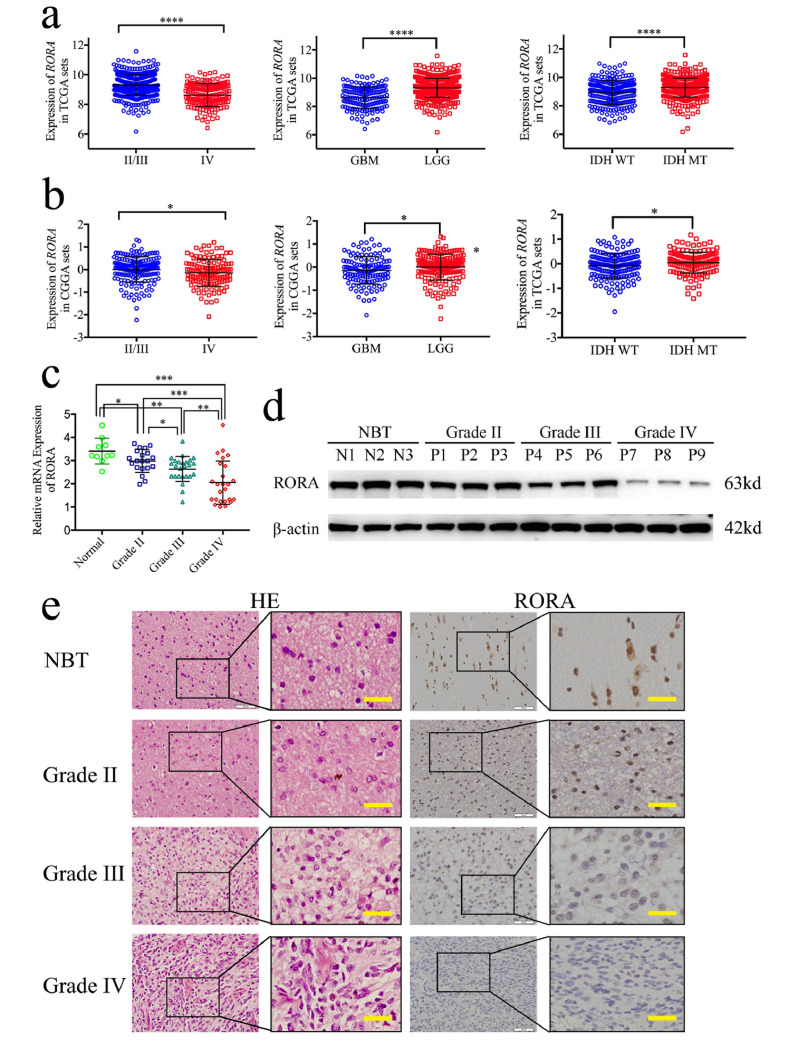
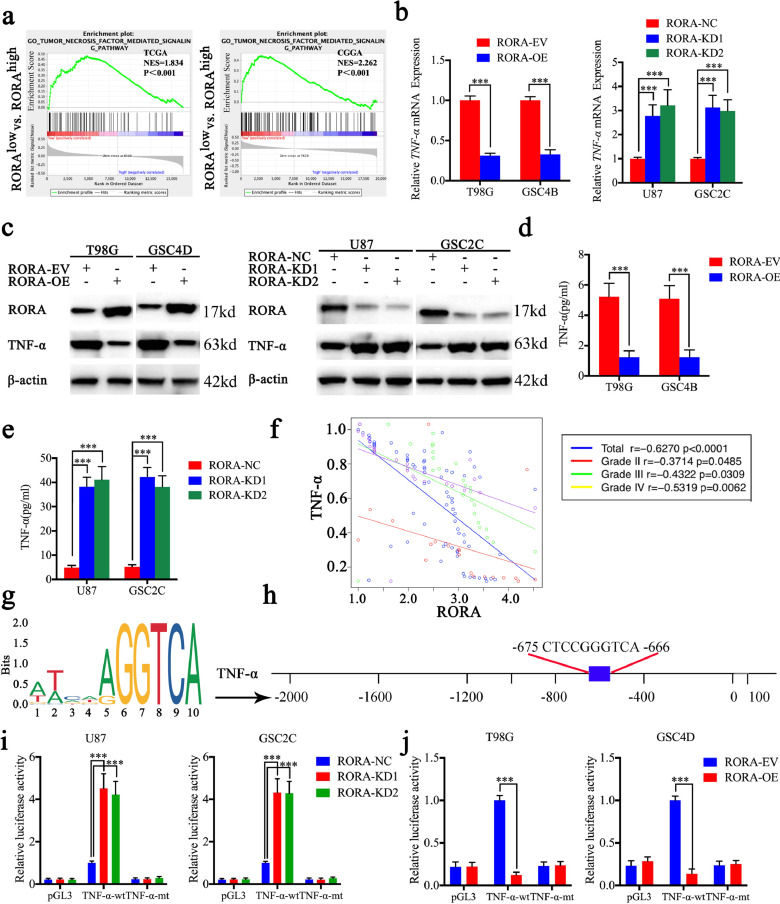
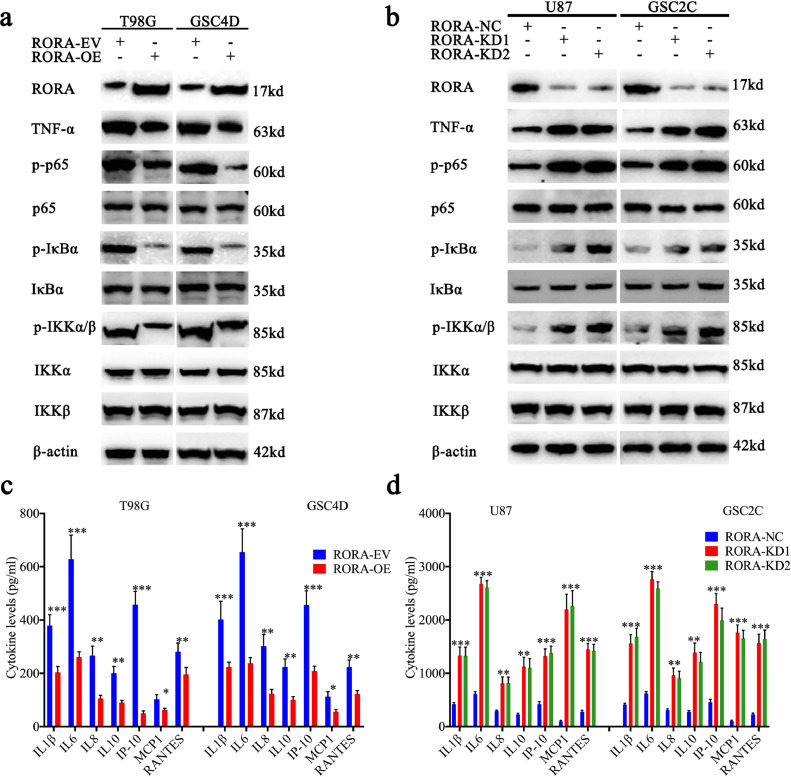
Findings: Our study found for the first time that RORA was expressed at low levels in gliomas, and was associated with a good prognosis. RORA overexpression inhibited the proliferation and tumorigenesis of glioma cell lines and GSCs via inhibiting the TNF-α mediated NF-κB signaling pathway. In addition, microRNA-18a had a promoting effect on gliomas, and was the possible reason for low RORA expression in gliomas.

Interpretation: RORA may be a promising therapeutic target in the treatment of gliomas.

Keywords: Glioma; Glioma stem cells; RORA; Tumorigenesis; microRNA-18a.


Conflict of interest statement

Declarations of Competing Interest The authors have declared that no conflict of interest exists.

Figures

Fig 1
Fig. 1
Retinoic acid receptor-related orphan receptor A (RORA) is expressed at low levels in glioma. (a) and (b): the expressions of RORA are shown according to World Health Organization grades, GBM and LGG, and IDH status in The Cancer Genome Atlas (TCGA) (a) and the Chinese Glioma Genome Atlas (CGGA) (b) glioma datasets. (c), (d) and (e) The qPCR (c), western blots (d), and IHC (e) showed that RORA was expressed at low levels in glioma patients with different grades of disease, compared with normal brain tissue (NBT), (grade II, n = 20; grade III, n = 25; grade IV, n = 25; NBT n = 10; P < 0.001; one-way analysis of variance). Scale bar = 50 μm. All data are shown as the mean ± SD (from three independent experiments). *P < 0.05; ⁎⁎P < 0.01; ⁎⁎⁎P < 0.001.
Fig 2
Fig. 2
Retinoic acid receptor-related orphan receptor A (RORA) overexpression inhibited glioma proliferation in vitro. (a) and (b) The lentiviral-based overexpression of RORA was detected by qPCR (a), T98G cells; P < 0.001; GSC4D; P< 0.001; Student's t-test) and western blots (b). (c) and (e) MTS assays showed the cell viability of T98G cells (c) P < 0.001; one-way analysis of variance and GSC4D (e) P < 0.001, one-way analysis of variance was decreased after RORA overexpression. (d) The Edu assay showed that the proliferations of T98G cells and GSC4D were decreased after RORA overexpression. (T98G cells: P < 0.001, GSC4D: P < 0.001; Student's t-test). Scale bar = 50 μm. (f) and (g) The neurosphere formation assay (f) and limiting dilution assays (g) showed the self-renewing capacity of GSC4D decreased after RORA overexpression (neurosphere size: P < 0.001, neurosphere number: P < 0.001; Student's t-test). Scale bar = 20 μm. (h) Cell cycle assay showed the effects of RORA on cell cycle distributions in T98G and GSC4D. (T98G cells: P < 0.001, GSC4D: P < 0.001; Student's t-test). All data are shown as the mean ± SD (from three independent experiments). *P < 0.05; ⁎⁎P < 0.01; ⁎⁎⁎P < 0.001.
Fig 3
Fig. 3
Retinoic acid receptor-related orphan receptor A (RORA) inhibits the transcription and expression of TNF-α. (a) Gene set enrichment analysis indicated that high expression of RORA was negatively associated with the tumor necrosis factor-mediated signaling pathway in both TCGA and CGGA databases. (b)–(e) The expression and secretion of TNF-α after RORA overexpression or knockdown were detected by qPCR (b), RORA overexpression: T98G: P < 0.001, GSC4D: P < 0.001, Student's t-test; RORA knockdown: U87 cells: P < 0.001, GSC2C: P < 0.001, one-way analysis of variance, western blots (c) and ELISA (d) and (e). (f) The mRNA expression correlation between RORA and TNF-α in 70 cases of glioma patients were detected by qPCR. (g) Sequence motif representing the consensus RORA binding motif (JASPAR database). (h) Schematic representation of the human TNF-α promoter region. (i) and (j) RORA knockdown ((i), U87 cells: P < 0.001, GSC2C: P < 0.001, one-way analysis of variance) or overexpression ((j), T98G cells: P < 0.001, GSC4D: P < 0.001, Student's t-test) altered the luciferase promoter activities of TNF-α. All data are expressed as the mean ± SD (from three independent experiments). *P < 0.05; ⁎⁎P < 0.01; ⁎⁎⁎P < 0.001.
Fig. 4
Fig. 4
Retinoic acid receptor-related orphan receptor A (RORA) participates in the TNF-mediated NF-κB signaling pathway. (a) and (b) Western blots showed that the downstream targets of NF-κB signaling pathway were regulated after RORA overexpression (a) or knockdown (b). (c) and (d) RORA overexpression (c) and knockdown (d) regulated the secretion of proinflammatory cytokines in glioma cells and GSCs as measured by an ELISA. All data are shown as the mean ± SD (from three independent experiments). *P < 0.05; ⁎⁎P < 0.01; ⁎⁎⁎P < 0.001.
Fig. 5
Fig. 5
Recombinant TNF-α treatment abrogates the proliferation inhibiting effects of RORA. (a) The MTS assay showed that the inhibited cell viability of T98G cells and GSC4D after RORA overexpression was reversed after recombinant TNF-α treatment (T98G cells: P < 0.001, GSC4D: P < 0.001, one-way analysis of variance). (b) and ( c) The Edu assay showed that the inhibited proliferation of T98G cells and GSC4D after RORA overexpression was reversed following recombinant TNF-α treatment (T98G cells: P < 0.001, GSC4D: P < 0.001, one-way analysis of variance). Scale bar = 50 μm. (d), (e) and (g) The neurosphere formation assay (d) and (e) and limiting dilution assays (g) showed the inhibited self-renewing capacity of GSC4D after RORA overexpression was reversed after recombinant TNF-α treatment. (neurosphere size: P < 0.001, neurosphere number: P < 0.001, one-way analysis of variance). Scale bar = 20 μm. (f) Western blots showed the inhibited downstream targets of NF-κB signaling pathway after RORA overexpression was activated following recombinant TNF-α treatment. All data are shown as the mean ± SD (three independent experiments). *P < 0.05; ⁎⁎P < 0.01; ⁎⁎⁎P < 0.001.
Fig. 6
Fig. 6
miR-18a negatively regulated retinoic acid receptor-related orphan receptor A (RORA) expression by binding with the RORA 3′-UTR. (a) Identification of a miRNA that potentially regulated RORA expression based on Starbase, TargetScan, microRNA, and miRDB. (b) The mRNA expression correlation between RORA and miR-18a in 70 cases of glioma patients were detected by qPCR (r = −0.4987, P < 0.001, Pearson's correlation analysis). (c) and (f) Schematic diagram of the putative miR-18a binding site in the 3′-UTR of RORA in humans. (d) and (e) Western blotting (d) and qPCR (e) showed the expression of RORA increased after miR-18a inhibitor treatment (T98G cells: P < 0.001; GSC4D: P < 0.001, Student's t-test). (g) and (h) MiR-18a inhibitor treatment increased the luciferase promoter activities of RORA ((g), T98G cells: P < 0.001; (h), GSC4D: P < 0.001, Student's t-test). All data are shown as the mean ± SD (from three independent experiments). *P < 0.05; ⁎⁎P < 0.01; ⁎⁎⁎P < 0.001.
Fig. 7
Fig. 7
Retinoic acid receptor-related orphan receptor A (RORA) regulates glioma tumorigenesis. (a) and (c) Representative photographs showed that the sizes of intracranial tumors in the coronal position were decreased after RORA overexpression (a), while it increased after RORA was silenced (c). Scale bar = 10 mm. (b) and (d) Kaplan–Meier survival curves showed RORA overexpression shortened the survival times of nude mice (b), while it prolonged the survival times after RORA was silenced (d). For each group, n= = 5. (e) Representative immunohistochemical staining showing the changes in RORA, TNF-α, and Ki-67 after RORA overexpression and knockdown of orthotopic xenograft models. Scale bar = 50 μm. (f) Schematic diagram showing that the downregulation of RORA promoted the proliferation and tumorigenesis of glioma through the TNF-mediated NF-κB signaling pathway. All data are shown as the mean ± SD (three independent experiments). *P < 0.05; ⁎⁎P < 0.01; ⁎⁎⁎P < 0.001.

Similar articles

Cited by

References

    1. Ostrom Q.T., Gittleman H., Liao P. CBTRUS statistical report: primary brain and other central nervous system tumors diagnosed in the United States in 2010–2014. Neuro Oncol. 2017;19(suppl_5):v1–v88. - PMC - PubMed
    1. Sotoudeh H., Shafaat O., Bernstock J.D. Artificial intelligence in the management of glioma: era of personalized medicine. Front Oncol. 2019;9:768. - PMC - PubMed
    1. Chiocca E.A., Yu J.S., Lukas R.V. Regulatable interleukin-12 gene therapy in patients with recurrent high-grade glioma: results of a phase 1 trial. Sci Transl Med. 2019;11(505) - PMC - PubMed
    1. Rajesh Y., Pal I., Banik P. Insights into molecular therapy of glioma: current challenges and next generation blueprint. Acta Pharmacol Sin. 2017;38(5):591–613. - PMC - PubMed
    1. Zhou D., Alver B.M., Li S. Distinctive epigenomes characterize glioma stem cells and their response to differentiation cues. Genome Biol. 2018;19(1):43. - PMC - PubMed

MeSH terms