Observational Study
. 2020 Feb 17;18(1):35.
doi: 10.1186/s12916-020-1496-1.

C-reactive protein as a potential biomarker for disease progression in dengue: a multi-country observational study

Affiliations
Observational Study

C-reactive protein as a potential biomarker for disease progression in dengue: a multi-country observational study

Nguyen Lam Vuong et al. BMC Med. .

Abstract

Background: Dengue infection can cause a wide spectrum of clinical outcomes. The severe clinical manifestations occur sufficiently late in the disease course, during day 4-6 of illness, to allow a window of opportunity for risk stratification. Markers of inflammation may be useful biomarkers. We investigated the value of C-reactive protein (CRP) measured early on illness days 1-3 to predict dengue disease outcome and the difference in CRP levels between dengue and other febrile illnesses (OFI).

Method: We performed a nested case-control study using the clinical data and samples collected from the IDAMS-consortium multi-country study. This was a prospective multi-center observational study that enrolled almost 8000 participants presenting with a dengue-like illness to outpatient facilities in 8 countries across Asia and Latin America. Predefined severity definitions of severe and intermediate dengue were used as the primary outcomes. A total of 281 cases with severe/intermediate dengue were compared to 836 uncomplicated dengue patients as controls (ratio 1:3), and also 394 patients with OFI.

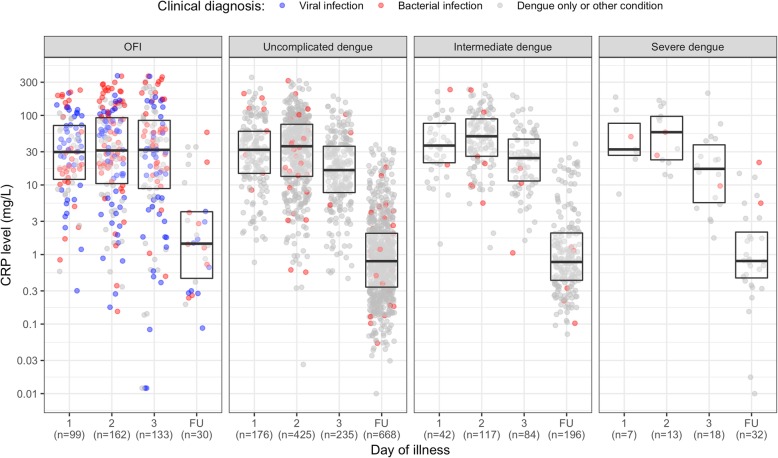
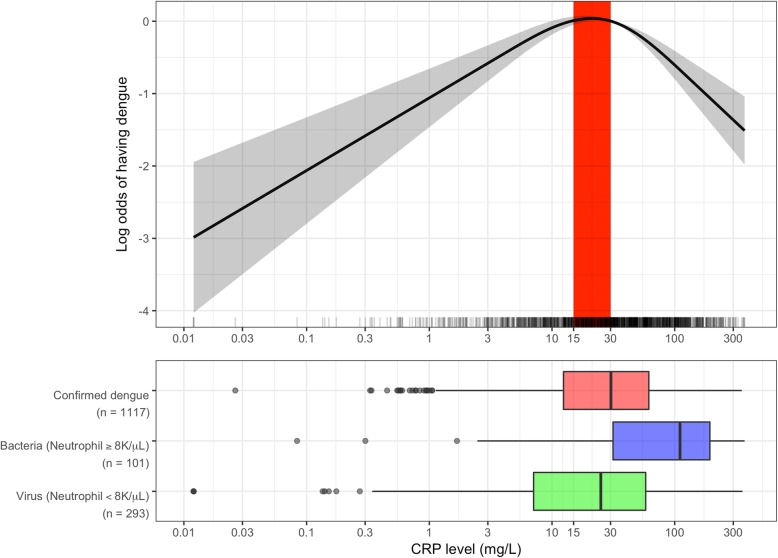
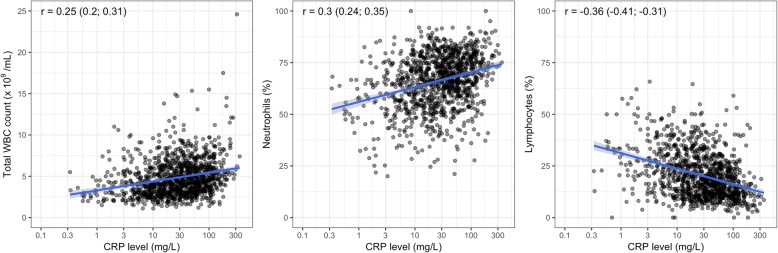
Results: In patients with confirmed dengue, median (interquartile range) of CRP level within the first 3 days was 30.2 mg/L (12.4-61.2 mg/L) (uncomplicated dengue, 28.6 (10.5-58.9); severe or intermediate dengue, 34.0 (17.4-71.8)). Higher CRP levels in the first 3 days of illness were associated with a higher risk of severe or intermediate outcome (OR 1.17, 95% CI 1.07-1.29), especially in children. Higher CRP levels, exceeding 30 mg/L, also associated with hospitalization (OR 1.37, 95% CI 1.14-1.64) and longer fever clearance time (HR 0.84, 95% CI 0.76-0.93), especially in adults. CRP levels in patients with dengue were higher than patients with potential viral infection but lower than patients with potential bacterial infection, resulting in a quadratic association between dengue diagnosis and CRP, with levels of approximately 30 mg/L associated with the highest risk of having dengue. CRP had a positive correlation with total white cell count and neutrophils and negative correlation with lymphocytes, but did not correlate with liver transaminases, albumin, or platelet nadir.

Conclusions: In summary, CRP measured in the first 3 days of illness could be a useful biomarker for early dengue risk prediction and may assist differentiating dengue from other febrile illnesses.

Keywords: Biomarker; C-reactive protein; Dengue; Other febrile illness; Prognosis.


Conflict of interest statement

SY receives consulting fees from Janssen pharmaceuticals for work on dengue antiviral development. All other authors declared that they have no competing interests. All authors have submitted the ICMJE Form for Disclosure of Potential Conflicts of Interest.

CH is staff of the World Health Organization. The authors alone are responsible for the views expressed in this article, and they do not necessarily represent the views, decisions, or policies of the institutions with which they are affiliated.

Figures

Fig. 1
Fig. 1
Study flowchart CRP, C-reactive protein; OFI, other febrile illnesses; LOD, limit of detection
Fig. 2
Fig. 2
Summary of CRP levels by day of illness at enrollment and follow-up The upper and lower edges of each box represent the interquartile range (25th–75th percentile) while the middle line is corresponding to the median. The points are the actual CRP values and colored by clinical diagnosis of bacterial infection (in red), viral infection (in blue), and dengue only infection (for patients with dengue infection) or other condition (for patients in the OFI group) (in gray). Among patients in the OFI group, 131 were clinically bacterial infection, 139 were clinically viral infection, and 124 were other conditions. The day of illness at enrollment is 1, 2, or 3, and FU is the follow-up period. The y-axis is transformed using base-2 logarithm. CRP, C-reactive protein; FU, follow-up; OFI, other febrile illnesses
Fig. 3
Fig. 3
Association between plasma CRP level and patients diagnosed with dengue or OFI The log odds of having dengue (the black line) and its 95% confidence interval (the gray region) by CRP level were estimated from multivariable logistic regression models with non-linear effect of log 2 of CRP levels, which modeled using restricted cubic splines with 3 knots, and adjustment for age and DOI at enrollment. The red region highlights the range of CRP of 15–30 mg/L, which corresponds to the highest probability of having dengue. The rug plots on the x-axis represent the distribution of CRP value of individual cases. Horizontal plots described distribution of CRP levels among dengue group (in red) and OFI group (the OFI group was further separated into potential bacterial infection [in blue] and potential viral infection [in green] based on clinical diagnosis by treating doctor [clinical diagnosis] or number of neutrophil). There are significant differences between CRP levels in the dengue group with the potential bacterial infection group (p < 0.001) and with the potential viral infection group (p = 0.003) (Mann-Whitney U test). The x-axis was transformed using base-2 logarithm. CRP, C-reactive protein; DOI, day of illness; OFI, other febrile illnesses
Fig. 4
Fig. 4
ad Association between CRP level and clinical outcomes among dengue patients The log odds (or log hazard for fever clearance time) of the outcomes (the black line) and its 95% confidence interval (the gray region) are estimated from multivariable logistic regression models (or multivariable Cox model for fever clearance time) allowing for non-linear effect of log 2 of CRP levels using restricted cubic splines and adjusted for age, DOI at enrollment, viremia levels at enrollment, and immune status. The rug plot on the x-axis represents the distribution of individual cases. The x-axis is transformed using base-2 logarithm. CRP, C-reactive protein
Fig. 5
Fig. 5
Association between CRP and total white blood cell count (n = 1115), the percentages of neutrophils (n = 1110) and lymphocytes (n = 1111) Each black point represents for each patient. The blue line is the linear regression line, and the gray region is the 95% confidence interval. Pearson’s correlation coefficient and its 95% confidence interval are shown in the top left corner of each plot. The x-axis is transformed using base-2 logarithm. CRP, C-reactive protein; WBC, white blood cell

References

    1. Simmons CP, Farrar JJ, Nguyen V, Wills B. Dengue. N Engl J Med. 2012;366(15):1423–1432. doi: 10.1056/NEJMra1110265. - DOI - PubMed
    1. Bhatt S, Gething PW, Brady OJ, et al. The global distribution and burden of dengue. Nature. 2013;496(7446):504–507. doi: 10.1038/nature12060. - DOI - PMC - PubMed
    1. World Health Organization. Dengue: guidelines for treatment, prevention and control. New Edition. Geneva: World Health Organization; 2009. - PubMed
    1. Yacoub S, Wills B. Predicting outcome from dengue. BMC Med. 2014;12:147. doi: 10.1186/s12916-014-0147-9. - DOI - PMC - PubMed
    1. Chen CC, Lee IK, Liu JW, Huang SY, Wang L. Utility of C-reactive protein levels for early prediction of dengue severity in adults. Biomed Res Int. 2015;2015:936062. - PMC - PubMed

Publication types