. 2020 Jan 1;10(1):38-59.
eCollection 2020.

miR-193a-5p promotes pancreatic cancer cell metastasis through SRSF6-mediated alternative splicing of OGDHL and ECM1

Affiliations

miR-193a-5p promotes pancreatic cancer cell metastasis through SRSF6-mediated alternative splicing of OGDHL and ECM1

Manman Li et al. Am J Cancer Res. .

Abstract

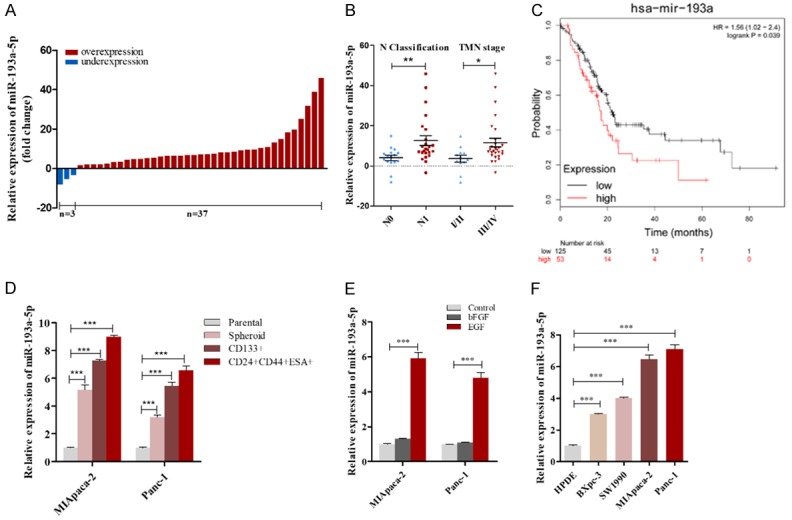
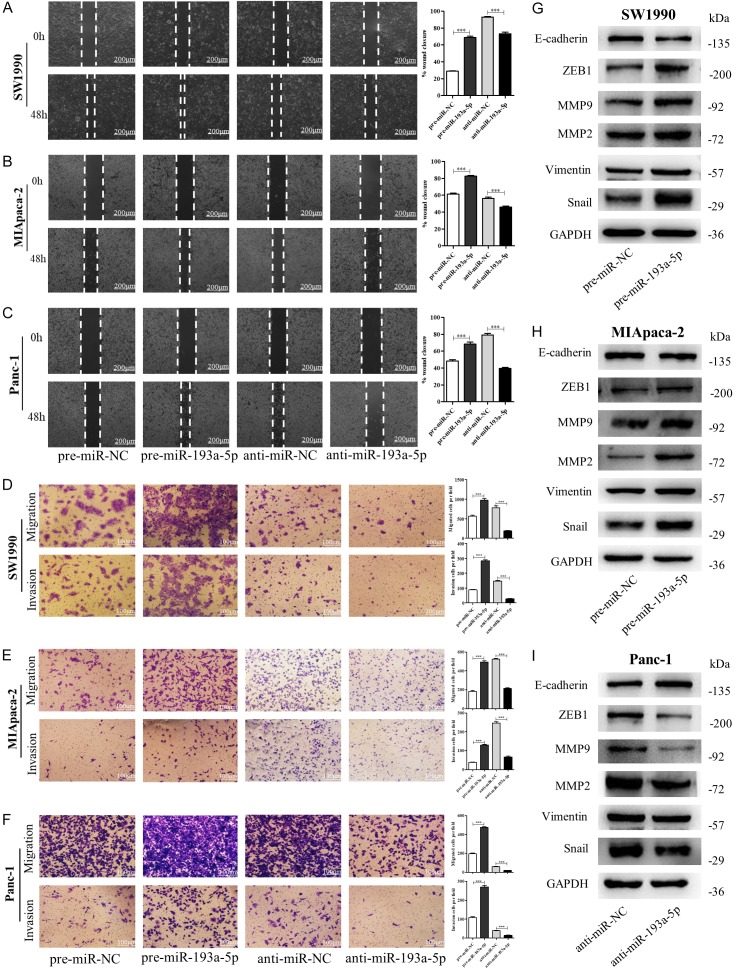
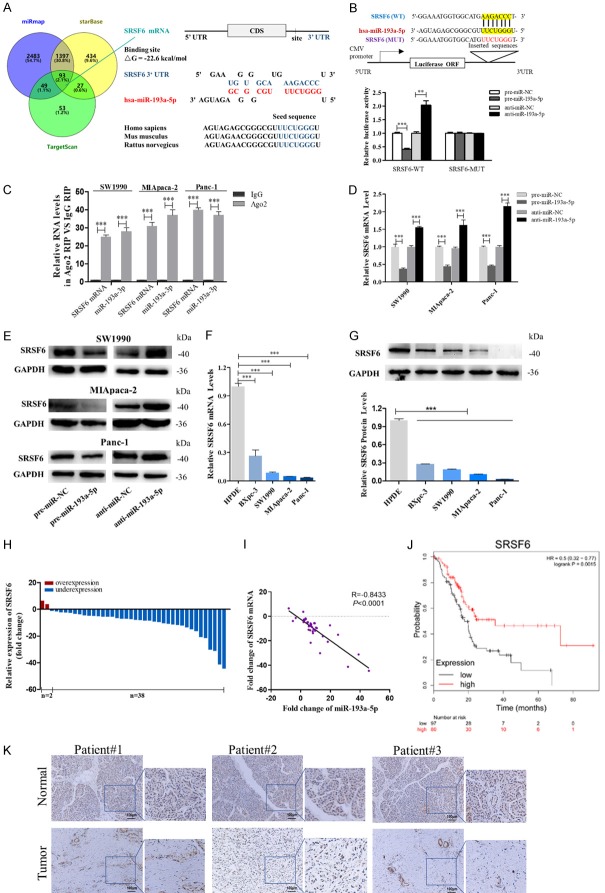
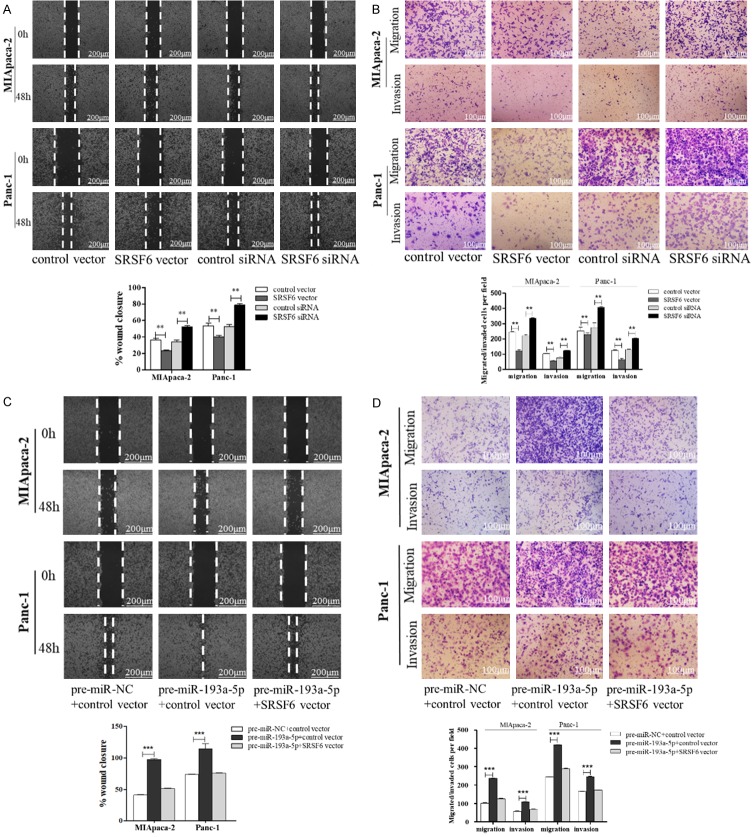
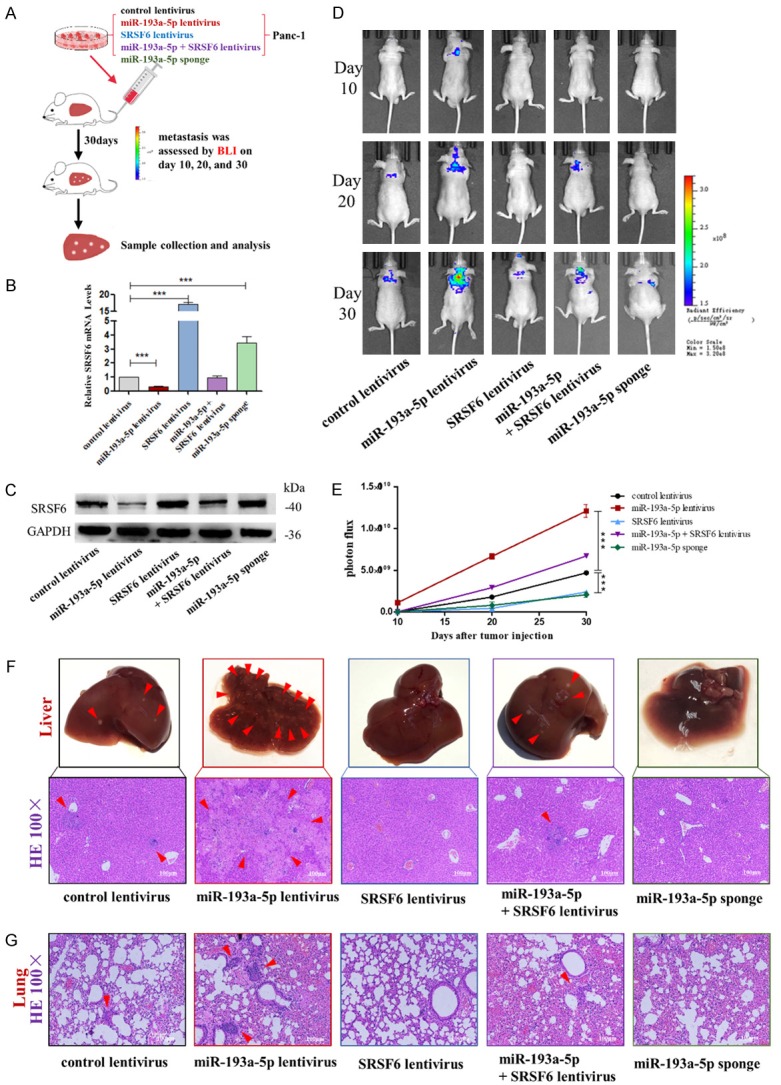
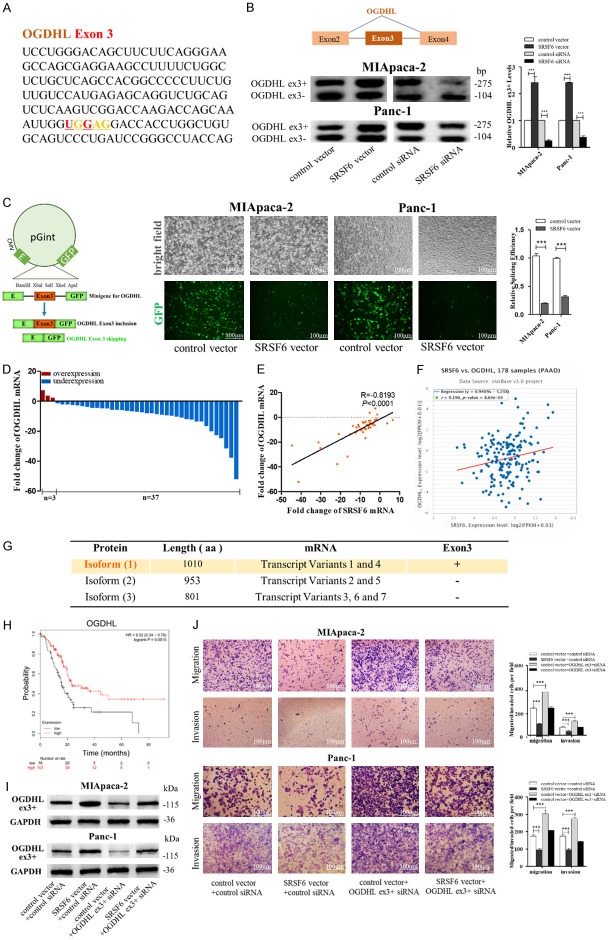
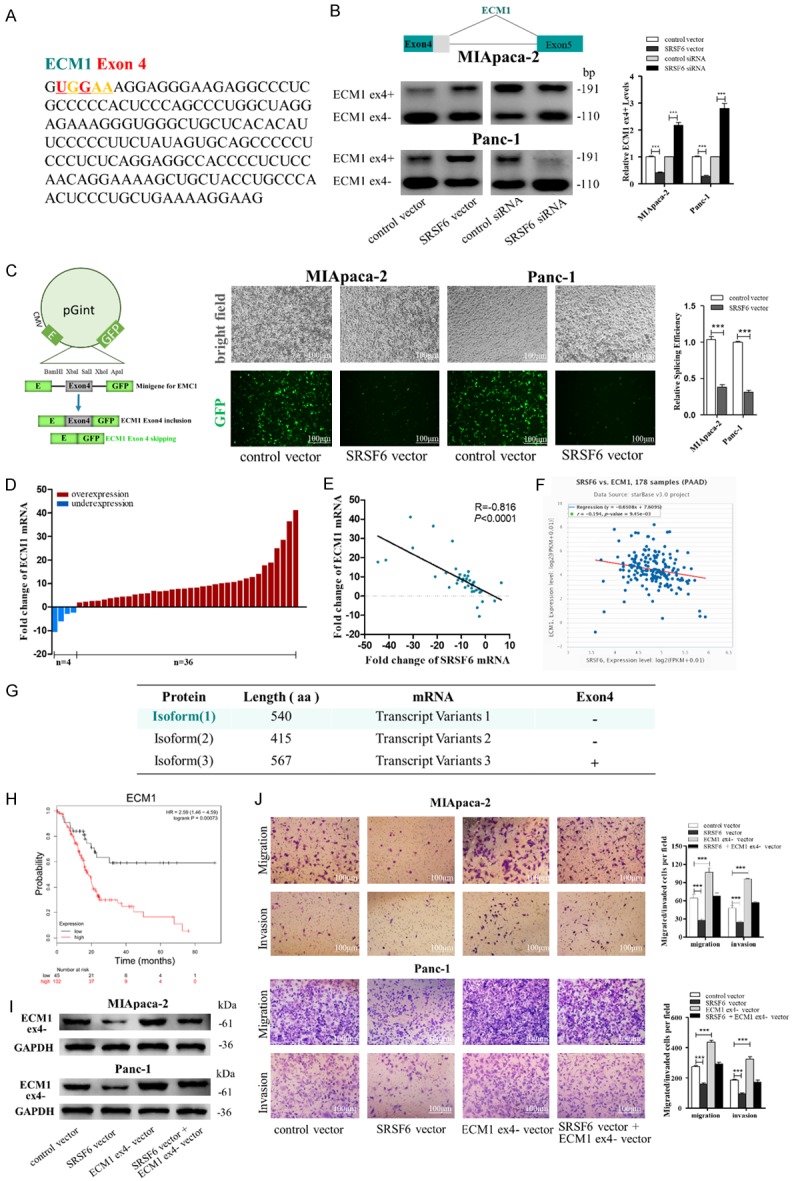
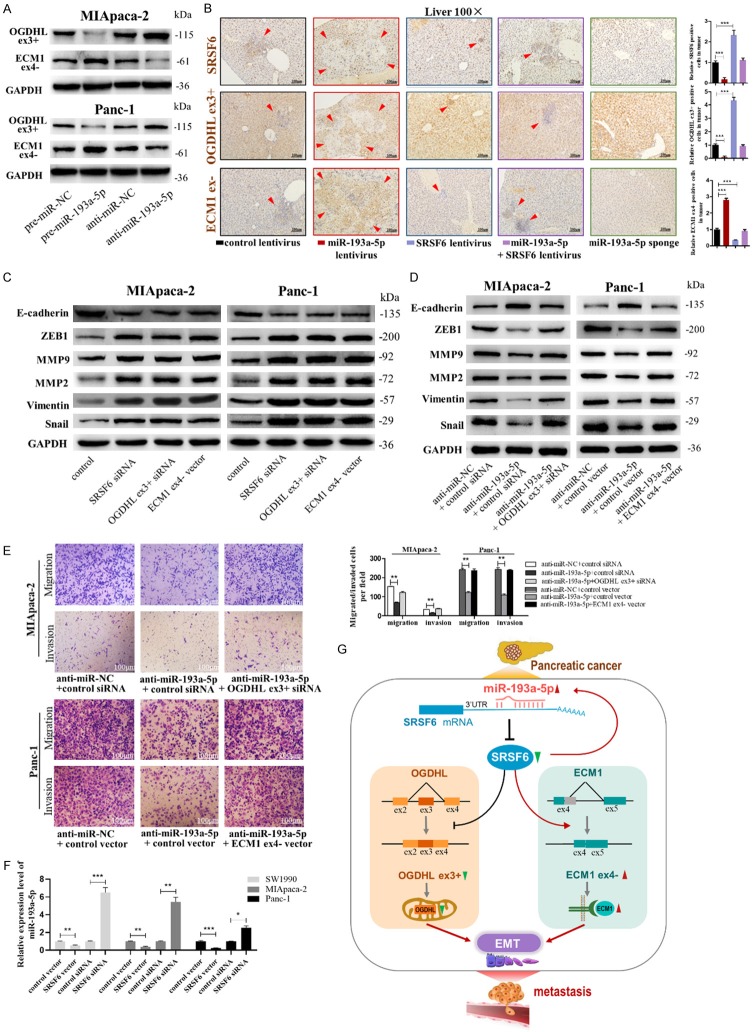
MicroRNAs (miRNAs) are short and non-coding RNAs binding to 3'UTR of target mRNAs to downregulate their expression. Recent studies have shown that miRNAs indirectly regulated alternative splicing (AS) by targeting splicing factors and caused shifts in splicing patterns of target genes. However, the roles of miRNA-regulating splicing factors in pancreatic cancer progression remain unknown. Herein, we reported that miR-193a-5p was markedly upregulated in pancreatic cancer tissues and cells and correlated with clinical outcomes of pancreatic cancer patients. Overexpression of miR-193a-5p contributed to the metastasis of pancreatic cancer cells both in vitro and in vivo. The mechanistic investigation suggested that miR-193a-5p modulated oxoglutarate dehydrogenase-like (OGDHL) and extracellular matrix protein 1 (ECM1) AS by targeting serine/arginine-rich splicing factor 6 (SRSF6), leading to the activation of the epithelial-to-mesenchymal transition (EMT) process. Together, our findings highlighted the role of miR-193a-5p-targeting SRSF6 in pancreatic cancer metastasis, which may serve as a novel target for pancreatic cancer diagnosis and therapy.

Keywords: ECM1; OGDHL; Pancreatic cancer; SRSF6; alternative splicing; invasion; miR-193a-5p; migration.


Conflict of interest statement

None.

Figures

Figure 1
Figure 1
miR-193a-5p is upregulated in pancreatic cancer tissues and cells. A. miR-193a-5p levels were detected in 40 paired pancreatic ductal carcinoma tissues by qRT-pancreatic cancerR. B. miR-193a-5p levels in pancreatic ductal carcinoma (PADC) patients with different N classification and TNM stage. C. miR-193a-5p high expression was correlated with a poor survival rate of pancreatic cancer patients (n=188, P<0.05). Data was analyzed using Kaplan Meier Plotter (www.kmplot.com). D. miR-193a-5p levels were detected in pancreatic cancerSCs by qRT-pancreatic cancerR. E. miR-193a-5p levels in MIApaca-2 and Panc-1 cells under stimulation of bFGF and EGF. F. miR-193a-5p levels were detected in different pancreatic cancer cells by qRT-pancreatic cancerR. All data are shown as the mean ± SEM. *P<0.05, **P<0.01, and ***P<0.001 by two-tailed Student’s t-test.
Figure 2
Figure 2
miR-193a-5p promotes pancreatic cancer cells migration and invasion in vitro. (A-C) Migration of SW1990 cells (A), MIApaca-2 cells (B) and Panc-1 cells (C) transfected with pre-miR-NC, pre-miR-193a-5p, anti-miR-NC, or anti-miR-193a-5p detected by wound healing assay. Scale bar, 100 μm. (D-F) Migration and invasion of SW1990 cells (D), MIAPACA-2 cells (E), and Panc-1 cells (F) transfected with pre-miR-NC, pre-miR-193a-5p, anti-miR-NC, or anti-miR-193a-5p detected by transwell migration and invasion assay. Scale bar, 100 μm. (G-I) The protein levels of EMT target genes in SW1990 cells (G), MIAPACA-2 cells (H) and Panc-1 cells (I) transfected with pre-miR-NC, pre-miR-193a-5p, anti-miR-NC or anti-miR-193a-5p detected by western blotting. All data are shown as the mean ± SEM. ***P<0.001.
Figure 3
Figure 3
Identification of SRSF6 as a direct target gene of miR-193a-5p in pancreatic cancer cells. (A) Left: Venn diagram analysis of four independent databases reveals 93 possible targets of miR-193a-5p. Right: Schematic description of the hypothetical duplexes formed by the interactions between the binding sites in the SRSF6 3’-UTR and miR-193a-5p. The predicted free energy value of the hybrid is indicated. The seed recognition sites are denoted, and all nucleotides in these regions are highly conserved across species, including human, mouse, and rat. (B) Luciferase activity in Panc-1 cells co-transfected with a luciferase reporter containing either SRSF6-WT or SRSF6-MUT (miR-193a-5p-binding sequence mutated), and mimics NC, miR-193a-5p mimics, inhibitor NC or miR-193a-5p inhibitor. Data are presented as the relative ratio of renilla luciferase activity and firefly luciferase activity. (C) Relative enrichment of SRSF6 mRNA and miR-193a-5p associated with AGO2 in SW1990 cells, MIApaca-2 cells and Panc-1 cells detected by anti-AGO2 RIP (non-specific IgG as negative control). (D, E) SRSF6 mRNA (D) and protein (E) levels in SW1990 cells, MIApaca-2 cells and Panc-1 cells transfected with mimics NC, miR-193a-5p mimics, inhibitor NC, or miR-193a-5p inhibitor. (F, G) SRSF6 mRNA (F) and protein levels (G) in different pancreatic cancer cells. (H, I) SRSF6 mRNA levels (H) and Pearson’s correlation scatter plot of the fold change of miR-193a-5p and SRSF6 mRNA levels (I) in 40 pairs of human PADC tissues and corresponding adjacent normal tissues. (J) SRSF6 low expression was correlated with a poor survival rate of pancreatic cancer patients (n = 177, P<0.01). Data was analyzed using Kaplan Meier Plotter (www.kmplot.com). (K) In situ hybridization (ISH) analysis of miR-193a-5p expression levels in PADC tissues (Tumor) and their adjacent normal tissues (Normal). Representative LNA ISH images from patients #1, #2 and #3 are shown. Scale bar, 100 μm. All data are shown as the mean ± SEM. **P<0.01; ***P<0.001.
Figure 4
Figure 4
miR-193a-5p promotes pancreatic cancer cell migration and invasion via targeting SRSF6. (A, B) Migration and invasion of MIApaca-2 cells (upper) and Panc-1 cells (lower) transfected with control vector, SRSF6 vector, control siRNA or SRSF6 siRNA detected by wound healing assay (A) or migration and invasion assay (B). Scale bar, 100 μm. (C, D) Migration and invasion of MIApaca-2 cells and Panc-1 cells transfected with pre-miR-NC plus control vector, pre-miR-193a-5p plus control vector, or pre-miR-193a-5p plus SRSF6 vector detected by wound healing assay (C) or migration and invasion assay (D). Scale bar, 100 μm. All data are shown as the mean ± SEM. **P<0.01; ***P<0.001.
Figure 5
Figure 5
Effects of SRSF6-targeted miR-193a-5p on the liver colonization of Panc-1 cells xenografts in mice. (A) Experimental design: immunocompromised mice were injected through tail vein with Panc-1 cells transfected with either the control lentivirus, miR-193a-5p lentivirus, SRSF6 lentivirus, miR-193a-5p lentivirus plus SRSF6 lentivirus, or miR-193a-5p sponge. (B, C) miR-193a-5p levels (B) and SRSF6 protein levels (C) in Panc-1 cells transfected with different lentiviruses. (D, E) Representative BLI images (D) and quantitative analysis of the fluorescence intensities (E) of mice of five groups. The BLI was performed on days 10, 20, and 30 after injection. The intensity of BLI is represented by the color. (F) Upper: Representative liver tissues isolated from the intravenously injected mice. Red arrows indicate metastatic nodules. Lower: Representative H&E staining of liver tissues. (G) Representative H&E staining in lung tissues. Scale bar, 100 μm. All data are shown as the mean ± SEM. ***P<0.001.
Figure 6
Figure 6
SRSF6 promotes pancreatic cancer cell migration and invasion through regulating OGDHL alternative splicing. (A) A consensus motif sequence (UGGAG) with predicted SRSF6 binding motif in exon3 of OGDHL. (B) RT-pancreatic cancerR for detecting OGDHL exon3 splicing isoforms expression in MIApaca-2 and Panc-1 cells transfected with control vector, SRSF6 vector, control siRNA or SRSF6 siRNA. (C) Minigene reporter system for detecting OGDHL exon3 splicing (left). The fluorescence signal in the GFP channel represents exon3 splicing efficiency in control and SRSF6 overexpression MIApaca-2 and Panc-1 cells (middle). Quantification of splicing efficiency by measuring the relative expression of intact EGFP transcript (right). (D, E) OGDHL mRNA levels (D) and Pearson’s correlation scatter plot of the fold change of OGDHL and SRSF6 mRNA levels (E) in 40 pairs of human PADC tissues and corresponding adjacent normal tissues. (F) Pearson’s correlation analysis of the fold change of OGDHL mRNA and SRSF6 mRNA in 178 human pancreatic adenocarcinoma (PAAD) tissues by ENCORI database from the TCGA project. (G) Different isoforms of OGDHL from NCBI database. Isoform 1 (1100aa) that contains exon3 is the canonical protein isoform. (H) OGDHL low expression was correlated with a poor survival rate of pancreatic cancer patients (n=177, P<0.01). Data was analyzed using Kaplan Meier Plotter (www.kmplot.com). (I) OGDHL exon3 included (ex3+) protein levels in MIApaca-2 and Panc-1 cells transfected with or without SRSF6 vector and with or without OGDHL (ex3+) siRNA detected by western blotting. (J) Migration and invasion of MIApaca-2 cells (upper) and Panc-1 cells (lower) transfected with or without SRSF6 vector and with or without OGDHL (ex3+) siRNA detected by transwell migration and invasion assay. Scale bar, 100 μm. All data are shown as the mean ± SEM. ***P<0.001.
Figure 7
Figure 7
SRSF6 promotes pancreatic cancer cell migration and invasion through regulating ECM1 alternative splicing. (A) A consensus motif sequence (UGGAA) with predicted SRSF6 binding motif in exon4 of ECM1. (B) RT-pancreatic cancerR for detecting ECM1 exon4 splicing isoforms expression in MIApaca-2 and Panc-1 cells transfected with control vector, SRSF6 vector, control siRNA or SRSF6 siRNA. (C) Minigene reporter system for detecting ECM1 exon4 splicing (left). The fluorescence signal in the GFP channel represents exon4 splicing efficiency in control and SRSF6 overexpression MIApaca-2 and Panc-1 cells (middle). Quantification of splicing efficiency by measuring the relative expression of intact EGFP transcript (right). (D, E) ECM1 mRNA levels (D) and Pearson’s correlation scatter plot of the fold change of ECM1 and SRSF6 mRNA levels (E) in 40 pairs of human PADC tissues and corresponding adjacent normal tissues. (F) Pearson’s correlation analysis of the fold change of ECM1 mRNA and SRSF6 mRNA in 178 human pancreatic adenocarcinoma (PAAD) tissues by ENCORI database from the TCGA project. (G) Different isoforms of ECM1 from NCBI database. Isoform 1 (540aa) that excludes part of exon4 is the canonical protein isoform. (H) ECM1 high expression was correlated with a poor survival rate of pancreatic cancer patients (n=177, P<0.001). Data was analyzed using Kaplan Meier Plotter (www.kmplot.com). (I) ECM1 exon4 partially excluded (ex4-) protein levels in MIApaca-2 and Panc-1 cells transfected with or without SRSF6 or without ECM1 (ex4-) vector detected by western blotting. (J) Migration and invasion of MIApaca-2 cells (upper) and Panc-1 cells (lower) transfected with or without SRSF6 or ECM1 (ex4-) vector detected by transwell migration and invasion assay. Scale bar, 100 μm. All data are shown as the mean ± SEM. ***P<0.001.
Figure 8
Figure 8
miR-193a-5p activates EMT process through down-regulating OGDHL (ex3+) and upregulating ECM1 (ex4-). (A) Protein levels of OGDHL (ex3+) and ECM1 (ex4-) in MIApaca-2 cells (upper) and Panc-1 cells (lower) transfected with pre-miR-NC, pre-miR-193a-5p, anti-miR-NC, or anti-miR-193a-5p. (B) IHC staining for SRSF6, OGDHL (ex3+) and ECM1 (ex4-) in the mouse livers. (C) The protein levels of EMT target genes in MIApaca-2 cells (left) and Panc-1 cells (right) transfected with control siRNA, SRSF6 siRNA, OGDHL (ex3+) siRNA, or ECM1 (ex4-). (D, E) The protein levels of EMT target genes (D), migrated and invaded cells (E) in MIApaca-2 cells transfected with anti-miR-NC plus control siRNA, anti-miR-193a-5p plus control siRNA, or anti-miR-193a-5p plus OGDHL (ex3+) siRNA, and Panc-1 cells transfected with anti-miR-NC plus control vector, anti-miR-193a-5p plus control vector, or anti-miR-193a-5p plus ECM1 (ex4-) vector. (F) miR-193a-5p levels in SW1990, MIApaca-2 and Panc-1 cells transfected with control vector, SRSF6 vector, control siRNA or SRSF6 siRNA. (G) A working model for the role of SRSF6-targeted miR-193a-5p in pancreatic cancer metastasis. During pancreatic tumorigenesis, upregulation of miR-133a-3p facilitated migration and invasion of pancreatic cancer cells through downregulating the expression of SRSF6, which regulated OGDHL and EMC1 alternative splicing thereby activated EMT process. All data are shown as the mean ± SEM. ***P<0.001.

References

    1. Bray F, Ferlay J, Soerjomataram I, Siegel RL, Torre LA, Jemal A. Global cancer statistics 2018: GLOBOCAN estimates of incidence and mortality worldwide for 36 cancers in 185 countries. CA Cancer J Clin. 2018;68:394–424. - PubMed
    1. Konstantinidis IT, Warshaw AL, Allen JN, Blaszkowsky LS, Castillo CF, Deshpande V, Hong TS, Kwak EL, Lauwers GY, Ryan DP, Wargo JA, Lillemoe KD, Ferrone CR. Pancreatic ductal adenocarcinoma: is there a survival difference for R1 resections versus locally advanced unresectable tumors? What is a “true” R0 resection? Ann Surg. 2013;257:731–6. - PubMed
    1. Yoshida BA, Sokoloff MM, Welch DR, Rinker-Schaeffer CW. Metastasis-suppressor genes: a review and perspective on an emerging field. J Natl Cancer Inst. 2000;92:1717–30. - PubMed
    1. Siegel RL, Miller KD, Jemal A. Cancer statistics, 2018. CA Cancer J Clin. 2018;68:7–30. - PubMed
    1. Lee JJ, Perera RM, Wang H, Wu DC, Liu XS, Han S, Fitamant J, Jones PD, Ghanta KS, Kawano S, Nagle JM, Deshpande V, Boucher Y, Kato T, Chen JK, Willmann JK, Bardeesy N, Beachy PA. Stromal response to Hedgehog signaling restrains pancreatic cancer progression. Proc Natl Acad Sci U S A. 2014;111:E3091–100. - PMC - PubMed

LinkOut - more resources