. 2020 Jan 22:2020:6047145.
doi: 10.1155/2020/6047145. eCollection 2020.

Enterotype Bacteroides Is Associated with a High Risk in Patients with Diabetes: A Pilot Study

Affiliations

Enterotype Bacteroides Is Associated with a High Risk in Patients with Diabetes: A Pilot Study

Jiajia Wang et al. J Diabetes Res. .

Abstract

Background: More and more studies focus on the relationship between the gastrointestinal microbiome and type 2 diabetes, but few of them have actually explored the relationship between enterotypes and type 2 diabetes. Materials and Methods. We enrolled 134 patients with type 2 diabetes and 37 nondiabetic controls. The anthropometric and clinical indices of each subject were measured. Fecal samples of each subject were also collected and were processed for 16S rDNA sequencing. Multiple logistic regression analysis was used to determine the associations of enterotypes with type 2 diabetes. Multiple linear regression analysis was used to explore the relationship between lipopolysaccharide levels and insulin sensitivity after adjusting for age, BMI, TG, HDL-C, DAO, and TNF-α. The correlation analysis between factors and microbiota was identified using Spearman correlation analysis. The correlation analysis between factors was identified using partial correlation analysis.

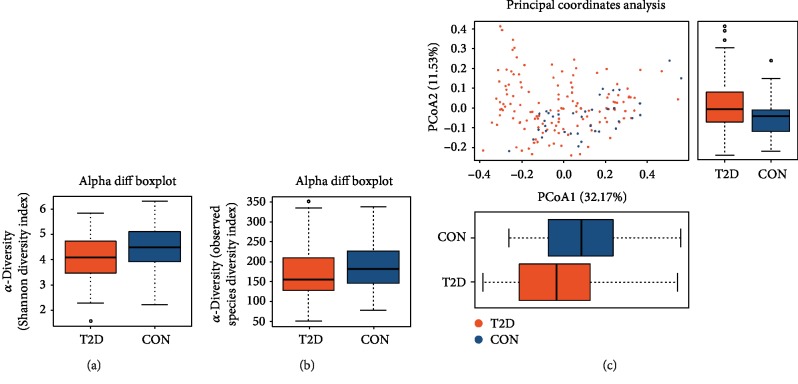
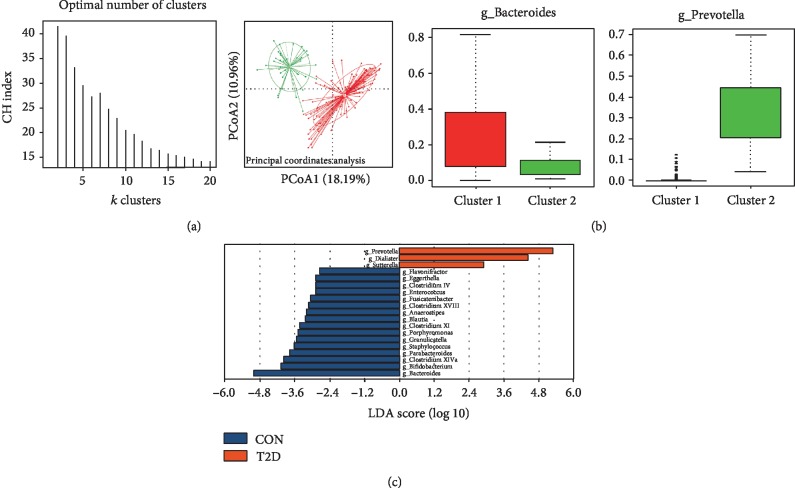
Results: Gut microbiota in type 2 diabetes group exhibited lower bacterial diversity compared with nondiabetic controls. The fecal communities from all subjects clustered into two enterotypes distinguished by the levels of Bacteroides and Prevotella. Logistic regression analysis showed that the Bacteroides and Bacteroides and Prevotella enterotype. Partial correlation analysis showed that lipopolysaccharide was closely associated with diamine oxidase, tumor necrosis factor-alpha, and Gutt insulin sensitivity index after adjusting for multiple covariates. Furthermore, the level of lipopolysaccharide was found to be an independent risk factor for insulin sensitivity.

Conclusions: We identified two enterotypes, Bacteroides and Prevotella, among all subjects. Our results showed that the Bacteroides enterotype was an independent risk factor for type 2 diabetes, which was due to increased levels of lipopolysaccharide causing decreased insulin sensitivity.Bacteroides and Prevotella enterotype. Partial correlation analysis showed that lipopolysaccharide was closely associated with diamine oxidase, tumor necrosis factor-alpha, and Gutt insulin sensitivity index after adjusting for multiple covariates. Furthermore, the level of lipopolysaccharide was found to be an independent risk factor for insulin sensitivity. Bacteroides and.


Conflict of interest statement

The authors declare that they have no conflict of interest.

Figures

Figure 1
Figure 1
The α-diversity and β-diversity analysis of the T2D and control groups. (a) The Shannon index difference between the T2D and control groups. P = 0.009. (b) The observed species index difference between the T2D and control groups. P = 0.040. The x-axes of both (a) and (b) show the two different groups. The y-axes show the α-diversity index value. Abnormal values are shown by “o.” (c) PCoA of the microbiota between the T2D and control groups. The x-axis represents the first principal coordinate, and the percentage represents the effect on the difference of the two groups. The y-axis represents the second principal coordinate, and the percentage represents the effect on the difference of the two groups. Px = 0.001, Py = 0.005. The bottom solid horizontal line represents the minimum value, the lower dotted vertical line represents the first quartile, the center solid horizontal line represents the median, the upper dotted vertical line represents the third quartile, and the top solid horizontal line represents the maximum value. The orange color represents the T2D group. The blue color represents the control group. CON: control group; PCoA: principal coordinates analysis.
Figure 2
Figure 2
Relative abundances of fecal taxa at different levels. (a) For differences in the fecal microbiota at the phylum level. (b) The F/B ratio in two groups. (c) For differences in the fecal microbiota at the genera level. Statistical analysis was performed by Mann–Whitney U test. P < 0.05, ∗∗P < 0.01. CON: nondiabetic control group; T2D: type 2 diabetes group.
Figure 3
Figure 3
Enterotypes identified in 171 participants using PCoA. (a) Panel (A) shows that the data are most naturally separated into two clusters via LefSe (LDA EffectSize) analysis. The x-axis shows the cluster number, and the y-axis shows the Calinski-Harabasz index, which is a measure of cluster separation. Panel (B) shows the clustering on the first two principal components. The red color represents enterotype 1 (Bacteroides), and the green color represents enterotype 2 (Prevotella). (b) Abundance index of Bacteroides and Prevotella in each enterotype. Boxes represent the interquartile range (IQR), and the line inside represents the median. PCoA: principal coordinates analysis. (c) LDA EffectSize analysis of two enterotypes. The x-axis shows the LDA score (log 10) after analysis and the y-axis shows the significantly differential genus between two enterotypes. The LDA threshold value is 2.

References

    1. Larsen N., Vogensen F. K., van den Berg F. W., et al. Gut microbiota in human adults with type 2 diabetes differs from non-diabetic adults. PLoS One. 2010;5(2, article e9085) doi: 10.1371/journal.pone.0009085. - DOI - PMC - PubMed
    1. Qin J., Li Y., Cai Z., et al. A metagenome-wide association study of gut microbiota in type 2 diabetes. Nature. 2012;490(7418):55–60. doi: 10.1038/nature11450. - DOI - PubMed
    1. Wang X., Xu X., Xia Y. Further analysis reveals new gut microbiome markers of type 2 diabetes mellitus. Antonie Van Leeuwenhoek. 2017;110(3):445–453. doi: 10.1007/s10482-016-0805-3. - DOI - PubMed
    1. Sohail M. U., Althani A., Anwar H., Rizzi R., Marei H. E. Role of the gastrointestinal tract microbiome in the pathophysiology of diabetes mellitus. Journal Diabetes Research. 2017;2017, article 9631435:9. doi: 10.1155/2017/9631435. - DOI - PMC - PubMed
    1. Yamaguchi Y., Adachi K., Sugiyama T., et al. Association of intestinal microbiota with metabolic markers and dietary habits in patients with type 2 diabetes. Digestion. 2016;94(2):66–72. doi: 10.1159/000447690. - DOI - PubMed

MeSH terms