. 2019 Aug 21;6(8):2149-2160.
doi: 10.1021/acsphotonics.9b00727. Epub 2019 Jul 21.

Quantitative Measurement of the Optical Cross Sections of Single Nano-objects by Correlative Transmission and Scattering Microspectroscopy

Affiliations

Quantitative Measurement of the Optical Cross Sections of Single Nano-objects by Correlative Transmission and Scattering Microspectroscopy

Attilio Zilli et al. ACS Photonics. .

Abstract

The scattering and absorption of light by nano-objects is a key physical property exploited in many applications, including biosensing and photovoltaics. Yet, its quantification at the single object level is challenging and often requires expensive and complicated techniques. We report a method based on a commercial transmission microscope to measure the optical scattering and absorption cross sections of individual nano-objects. The method applies to microspectroscopy and wide-field image analysis, offering fine spectral information and high throughput sample characterization. Accurate cross-section determination requires detailed modeling of the measurement, which we develop, accounting for the geometry of the illumination and detection as well as for the presence of a sample substrate. We demonstrate the method on three model systems (gold spheres, gold rods, and polystyrene spheres), which include metallic and dielectric particles, spherical and elongated, placed in a homogeneous medium or on a dielectric substrate. Furthermore, by comparing the measured cross sections with numerical simulations, we are able to determine structural parameters of the studied system, such as the particle diameter and aspect ratio. Our method therefore holds the potential to complement electron microscopy as a simpler and cost-effective tool for structural characterization of single nano-objects.


Conflict of interest statement

The authors declare no competing financial interest.

Figures

Figure 1
Figure 1
Schematics of the experimental setup for bright-field (BF, left) and dark-field (DF, right) illumination; a detailed description is provided in the text. The illumination angles depicted correspond to NAiBF ∈ [0, 0.8] and NAiDF ∈ [0.9, 1.1]; as a consequence, part of the DF illumination undergoes total internal reflection. The scattering distribution, formula image, is computed in the electrostatic approximation for an elongated NanO placed on a glass/air interface (n1 = 1.52, n2 = 1.00) oriented as in the enlarged image. The image on the bottom left is an example of BF transmission with the NanO appearing dark on a bright background. The image on the bottom right is an example of DF contrast, with the NanO appearing bright on a dark background. The plot in the bottom middle exemplifies a cross-section spectrum obtained from the BF and DF images.
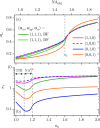
Figure 2
Figure 2
Scattering parameters (a) ηl and (b) ζ against n2 for several forms of the polarizability α of the resonant mode. As illustrated in Figure 1, the NanO is deposited on a glass substrate (n1 = 1.52) and immersed in medium 2. The illumination comes from medium 1 and is polarized along x in the BFP of the condenser. The illumination ranges are NAiBF ∈ [0, 0.95] and NAiDF ∈ [1.1, 1.2]. The illumination undergoes complete TIR for formula image and no TIR for formula image. The collection angle, θobj = 108° has been kept fixed, resulting in a variable NAobjn2 sin θobj.
Figure 3
Figure 3
(a) Representative TEM micrograph of gold spheres of the measured batch. (b) Absorption and (c) scattering cross-section spectra of a single sphere (identified by the symbol ● in panels d and e) in a homogeneous n = 1.52 optical environment. The experimental data (solid lines) are fitted by numerical simulations (○) using the sphere diameter D as a free parameter. (d) LSPR peak position λLSPR and σ for the 5 measured spheres, identified by different full symbols. The hollow symbols are corresponding simulations for a sphere of diameter D = 58 nm and ε(λ) after JC, Mc, and Ol, and the same with damping added (+d) as described in the text. (e) Number distribution of D measured with TEM over 37 spheres. The vertical lines are estimates of D obtained by fitting the spectra in panels b and c with ε(λ) after JC+d; different symbols identify the same individual spheres as in panel d.
Figure 4
Figure 4
(a) Representative TEM micrograph of a gold rod of the measured batch. (b) Higher resolution micrograph of the framed region in panel a. (c) Absorption and (d) scattering cross-section spectra of a single rod (identified by the symbol ● in the panels e and f) deposited on a glass substrate (n1 = 1.52) and immersed in air (n2 = 1.00) or index-matching oil (n2 = n1) (short and long wavelength peak, respectively). The illumination was polarized along the rod long axis in the BFP of the condenser. The experimental data (solid lines) are fitted by numerical simulations (hollow circles) using the rod aspect ratio, AR, and width, W, as free parameters. (e) LSPR peak position, λLSPR, and absolute amplitude, σ, for the 7 measured rods, identified by different full symbols. The hollow symbols are simulations for a rod of AR = 2.4 and W = 28 nm, and ε(λ) after JC or Mc with added damping (Mc+d), or Ol. Color coding in panels c–f refers to the legend above panel e. (f) AR and W deduced from independent fits of the four spectra; the symbols identify the same individual rods as in panel e. (g) AR and W measured from TEM micrographs of the measured batch. Crosses (80 rods, a few falling outside the plotted range) refer to images provided by the manufacturer, while circles (9 rods) refer to images taken in house.
Figure 5
Figure 5
(a) Number distribution of the scattering cross-section of about 1000 individual polystyrene spheres deposited on a glass/air interface (n1 = 1.52, n2 = 1.00). The three panels refer to different average excitation wavelengths, ⟨λ⟩. (b) Number distribution of the sphere diameter, D, deduced by comparison of data in panel a with numerical simulations of, σscaDF(D). The mean diameter and the standard deviation of each distribution are reported in the frames. The dashed lines indicate D measured by DLS in panel b, and the corresponding computed σscaDF(D) in panel a.

References

    1. Bohren C. F.; Huffman D. R.. Absorption and Scattering of Light by Small Particles; Wiley-VCH Verlag, 1998.
    1. Ringe E.; Sharma B.; Henry A.-I.; Marks L. D.; Van Duyne R. P. Single nanoparticle plasmonics. Phys. Chem. Chem. Phys. 2013, 15, 4110.10.1039/c3cp44574g. - DOI - PubMed
    1. Dreaden E. C.; Alkilany A. M.; Huang X.; Murphy C. J.; El-Sayed M. A. The golden age: Gold nanoparticles for biomedicine. Chem. Soc. Rev. 2012, 41, 2740–2779. 10.1039/C1CS15237H. - DOI - PMC - PubMed
    1. Mayer K. M.; Hafner J. H. Localized Surface Plasmon Resonance Sensors. Chem. Rev. 2011, 111, 3828–3857. 10.1021/cr100313v. - DOI - PubMed
    1. Atwater H. A.; Polman A. Plasmonics for improved photovoltaic devices. Nat. Mater. 2010, 9, 205–213. 10.1038/nmat2629. - DOI - PubMed