. 2020 Jan 29;6(5):eaay2939.
doi: 10.1126/sciadv.aay2939. eCollection 2020 Jan.

Retinoid X receptor alpha is a spatiotemporally predominant therapeutic target for anthracycline-induced cardiotoxicity

Affiliations

Retinoid X receptor alpha is a spatiotemporally predominant therapeutic target for anthracycline-induced cardiotoxicity

Xiao Ma et al. Sci Adv. .

Abstract

To uncover the genetic basis of anthracycline-induced cardiotoxicity (AIC), we recently established a genetic suppressor screening strategy in zebrafish. Here, we report the molecular and cellular nature of GBT0419, a salutary modifier mutant that affects retinoid x receptor alpha a (rxraa). We showed that endothelial, but not myocardial or epicardial, RXRA activation confers AIC protection. We then identified isotretinoin and bexarotene, two FDA-approved RXRA agonists, which exert cardioprotective effects. The therapeutic effects of these drugs only occur when administered during early, but not late, phase of AIC or as pretreatment. Mechanistically, these spatially- and temporally-predominant benefits of RXRA activation can be ascribed to repair of damaged endothelial cell-barrier via regulating tight-junction protein Zonula occludens-1. Together, our study provides the first in vivo genetic evidence supporting RXRA as the therapeutic target for AIC, and uncovers a previously unrecognized spatiotemporally-predominant mechanism that shall inform future translational efforts.


Figures

Fig. 1
Fig. 1. Endothelial RP2 reversion in GBT0419/0419 abolishes its cardioprotective effects on AIC.
(A) The schematic shows the Tg(kdrl:CreER), Tg(cmlc2:CreER), and Tg(tcf21:CreER) transgenic lines that were crossed into GBT0419/0419, respectively. CreER and loxP elements are highlighted in blue. (B) Kaplan-Meier survival curves indicate reduced survival of GBT0419/0419 adult fish with endothelial RP2 reversion after DOX stress. (C) The ventricular EF of GBT0419/0419 adult fish was reduced with endothelial RP2 reversion after DOX stress. Each dot represents the EF value of a single ventricle. WT, wild type; EtOH, ethanol. (D) Swimming capacity of GBT0419/0419 adult fish remains reduced with endothelial RP2 reversion after DOX stress. BL, body length; Ucrit, critical swimming speed. (E) Kaplan-Meier survival curves indicate unchanged survival of GBT0419/0419 adult fish with myocardial RP2 reversion after DOX stress. (F) Kaplan-Meier survival curves indicate unchanged survival of GBT0419/0419 adult fish with epicardial RP2 reversion after DOX stress. Error bars represent SD. *P < 0.05 and **P < 0.01; log-rank test in (B), (E), and (F) for comparison with the WT group; unpaired Student’s t test in (C); Kruskal-Wallis test was used followed by Tukey’s post hoc test in (D).
Fig. 2
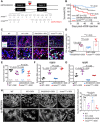
Fig. 2. While GBT0419 exerts salutary effects, an rxraa TALEN allele exerts deleterious effects on AIC in adult zebrafish.
(A) Schematic comparison of genomic lesions in GBT0419/0419 and an rxraa TALEN mutant (rxraae2/e2). Dashed lines indicate an eight-nucleotide deletion. fs, frameshift; aa, amino acid. (B) Kaplan-Meier survival curves show survival of WT, GBT0419/0419, and rxraae2/e2 adult fish after DOX stress. (C) Representative images of cardiomyocyte apoptosis in the ventricular tissues of WT, GBT0419/0419, and rxraae2/e2 after DOX stress at 10 wpi. The bottom panels show a higher-magnification view of the corresponding dotted box area. Arrows indicate cardiomyocytes (Mef2+) with positive terminal deoxynucleotidyl transferase–mediated deoxyuridine triphosphate nick end labeling (TUNEL) staining. Mef2, myocyte enhancer factor 2; DAPI, 4′,6-diamidino-2-phenylindole. Scale bar, 50 μm. (D) Quantification of the cardiomyocyte apoptosis index in (C). Each dot represents a single fish ventricle. Approximately 500 to 1000 cardiomyocytes were counted in sections per ventricle. CM, cardiomyocyte. (E) Ventricular EF of WT, GBT0419/0419, and rxraae2/e2 after DOX stress at 10 wpi. (F and G) The expression of nppa (F) and nppb (G) transcripts in WT, GBT0419/0419, and rxraae2/e2 after DOX stress at 10 wpi is shown. RNA was extracted from a pool of three ventricles as a single biological replicate. n = 3 in each group. (H) Images of α-actinin antibody staining show myofibril disarray in ventricular tissues of WT, GBT0419/0419, and rxraae2/e2 after DOX stress at 12 wpi. Bottom panels are higher-magnification views of the dotted box areas. n > 3 for each group. Quantification on the right shows the number of intact Z disc/10 μm. Scale bar, 50 μm. Error bars represent SD. *P < 0.05 and **P < 0.01; log-rank test in (B) for comparisons with the WT group; one-way analysis of variance (ANOVA) followed by Tukey’s post hoc test in (D) to (G).
Fig. 3
Fig. 3. Activation of RA signaling is responsible for the cardioprotective effects associated with GBT0419.
(A) Schematics showing locations of rxraa primers for quantitative reverse transcription PCR. Primer pair 1 (F1R1) targets exon 1 and exon 2 flanking the RP2 insertion locus. Primer pair 2 (F2R2) targets exon 2 and exon 4, which amplify rxraa transcripts containing C-terminal exons. (B) Relative degree of exon 1–exon 2 splicing rxraa, as measured by primer pair 1, in GBT0419/0419 and rxraae2/e2. (C) Relative expression of rxraa transcripts, as measured by primer pair 2, in GBT0419/0419 and rxraae2/e2. (D) Heat map of the relative mRNA expression levels of genes regulated by RA signaling in GBT0419/0419 and rxraae2/e2. Values are shown as the log2 transformation of relative mRNA expression normalized to the mean value of WT. actb2 was used as an internal control. In (B) to (D), RNA was extracted from a pool of 20 fish embryos at 2 dpf, which was considered a single biological replicate (represented as a single dot). Samples were collected in triplicate. (E) hoxb5a and hoxb5b expression detected by in situ hybridization on adult hearts at 24 hours after DOX stress. The bottom panels show a higher-magnification view of the dotted box area in the top panels. Arrowheads indicate endocardial expression. n = 3 for each group. Scale bars, 100 μm (top panel) and 20 μm (bottom panel). (F) Schematic of the schedule for DEAB administration and DOX injection. (G) Ventricular fractional shortening of GBT0419/0419 adult fish with or without DEAB treatment upon DOX stress at 8 wpi. (H) Ventricular fractional area change in GBT0419/0419 adult fish with or without DEAB treatment upon DOX stress at 8 wpi. Each dot represents an individual ventricle. Error bars indicate SD. *P < 0.05 and **P < 0.01; one-way ANOVA followed by Tukey’s post hoc test was used.
Fig. 4
Fig. 4. Endothelial-specific overexpression of rxraa protects against AIC in vivo.
(A) Schematic of the rxraa conditional transgenic line. (B) The green channel shows cardiomyocyte-specific rxraa overexpression at 6 dpf. A, atrium; V, ventricle; OFT, outflow tract. (B′) The red channel of the same view as (B) shows the original mCherry expression. Insets show the same heart after dissection. (C) Heart from a 3-month-old fish showing cardiomyocyte-specific rxraa overexpression. Scale bar, 500 μm. (D) The green channel shows endothelial-specific rxraa overexpression at 6 dpf. Y, yolk with autofluorescence. (D′) The merged channel with the same view as (D) shows mCherry and Rxraa-EGFP expression. The inset shows a higher-magnification view of the dotted area. The triangle indicates the endothelial layer; the arrowhead indicates the nonendothelial layer. Scale bar, 100 μm. (E) Heart from a 3-month-old fish showing endothelial-specific rxraa overexpression. Scale bar, 500 μm. (F) Western blot of adult ventricles. The predicted size of the induced Rxraa-EGFP fusion protein is 75 kDa (indicated by an asterisk). Actin was used as an internal control. Lane 1, Tg(βact2:RSRxraa); lane 2, Tg(βact2:RSRxraa);Tg(kdrl:CreER) + 4HT; lane 3, Tg(βact2:RSRxraa);Tg(cmlc2:CreER) + 4HT. (G and H) Kaplan-Meier survival curves showing the survival of DOX-stressed adult fish with endothelial-specific (G) or cardiomyocyte-specific (H) rxraa overexpression. (I and J) Ventricular EF of adult hearts with endothelial-specific (I) or cardiomyocyte-specific (J) rxraa overexpression at 8 wpi. (K) Swimming capacity of fish, with or without endothelial-specific rxraa overexpression. Error bars indicate SD. *P < 0.05 and **P < 0.01; log-rank test in (G) and (H); unpaired Student’s t test in (I) and (J); Kruskal-Wallis test followed by Tukey’s post hoc test in (K).
Fig. 5
Fig. 5. RXRA agonists exert stage-dependent cardioprotective effects on AIC.
(A, D, and G) Schematics of the schedules for RXRA agonist treatment at the early (1 to 4 wpi) or late (4 to 8 wpi) phase or as pretreatment (1 week before DOX) in the adult fish AIC model. A single bolus of DOX was injected as indicated in red. RXRA agonists were delivered daily by oral gavage. Isotretinoin (ISO) and bexarotene (BEX) were administered at clinically relevant doses, as listed in table S2B. High-frequency echocardiography was performed at the indicated time points to quantify cardiac functions. Saline was used as a control. (B and C) Indices of treatment with RXRA agonists during the early phase. (E and F) Indices of treatment with RXRA agonists during the late phase. (H) Indices of treatment with RXRA agonists during the pretreatment phase. (B and E) Kaplan-Meier survival curves show the survival of adult fish after DOX stress. (C, F, and H) Fractional shortening and fractional area change of adult ventricles at the respective time of echo after DOX stress. Error bars represent SDs. *P < 0.05 and **P < 0.01; log-rank test was used in (B) and (E) for comparisons with the saline group; one-way ANOVA followed by Tukey’s post hoc test was used in (C), (F), and (H).
Fig. 6
Fig. 6. Treatment of RXRA agonists reduces endothelial cell permeability by regulating ZO-1 functions during the early stage of AIC.
(A) Western blot of ZO-1 expression in cultured HCAECs. Glyceraldehyde 3-phosphate dehydrogenase (GAPDH) was used as an internal control. The control group received no treatment. (B) Separation of the endothelial cell population from Tg(fli1a:EGFP) adult zebrafish ventricular tissues. A fluorescence-activated cell sorting was conducted at 24 hours post–DOX injection with or without oral gavage of RXRA agonists. The red area shows the cell distribution of the WT control (no fluorescence). (C) Real-time quantitative PCR shows tjp1a and tjp1b mRNA expression in separated adult zebrafish endothelial cells. actb2 was used as an internal control. (D) Representative Zo-1 structure in endothelial cells in Tg(fli1a:EGFP) adult zebrafish heart at 5 days postinjection. The middle panels show higher magnification of the boxed area on the left; the far right panels show higher magnification of the boxed area in the middle. Arrowhead indicates endothelial cells. DOX and RXRA agonists were delivered via intraperitoneal injection or oral gavage, respectively. The control group was injected with saline and gavaged with dimethyl sulfoxide (DMSO). n > 3 for each group. Scale bars, 500, 40, and 5 μm, from left to right. (E) Immunostaining shows the ZO-1 structure in HCAECs upon DOX stress and treatment with RXRA agonists. DOX (0.1 μM), 100 nM ISO, and 10 nM BEX were used. The control was treated with DMSO. n = 3 for each group. Scale bar, 20 μm. (F) Top: A schematic showing the design of the HCAEC permeability assay. Lower FITC concentrations were detected in the outer well after FITC (1 μg/μl) was added to the inner well for 30 min of incubation. The blank group had no HCAECs, and the control was treated with DMSO. DOX (0.1 μM), 100 nM ISO, and 10 nM BEX were used. *P < 0.05 and **P < 0.01; one-way ANOVA followed by Tukey’s post hoc test was used in (C) and (F).

Similar articles

Cited by

References

    1. McGowan J. V., Chung R., Maulik A., Piotrowska I., Walker J. M., Yellon D. M., Anthracycline chemotherapy and cardiotoxicity. Cardiovasc. Drugs Ther. 31, 63–75 (2017). - PMC - PubMed
    1. Minotti G., Menna P., Salvatorelli E., Cairo G., Gianni L., Anthracyclines: Molecular advances and pharmacologic developments in antitumor activity and cardiotoxicity. Pharmacol. Rev. 56, 185–229 (2004). - PubMed
    1. Zhang S., Liu X., Bawa-Khalfe T., Lu L.-S., Lyu Y. L., Liu L. F., Yeh E. T. H., Identification of the molecular basis of doxorubicin-induced cardiotoxicity. Nat. Med. 18, 1639–1642 (2012). - PubMed
    1. Chatterjee K., Zhang J., Honbo N., Karliner J. S., Doxorubicin cardiomyopathy. Cardiology 115, 155–162 (2010). - PMC - PubMed
    1. Wilkinson E. L., Sidaway J. E., Cross M. J., Cardiotoxic drugs herceptin and doxorubicin inhibit cardiac microvascular endothelial cell barrier formation resulting in increased drug permeability. Biol. Open 5, 1362–1370 (2016). - PMC - PubMed

Publication types

MeSH terms

LinkOut - more resources