. 2020 Jan 31;6(5):eaay4458.
doi: 10.1126/sciadv.aay4458. eCollection 2020 Jan.

Molecular mechanism of SHP2 activation by PD-1 stimulation

Affiliations

Molecular mechanism of SHP2 activation by PD-1 stimulation

M Marasco et al. Sci Adv. .

Abstract

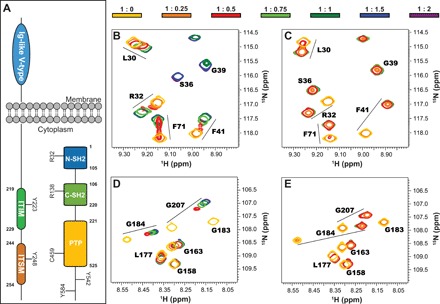
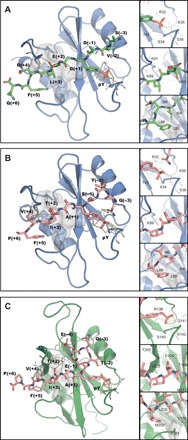
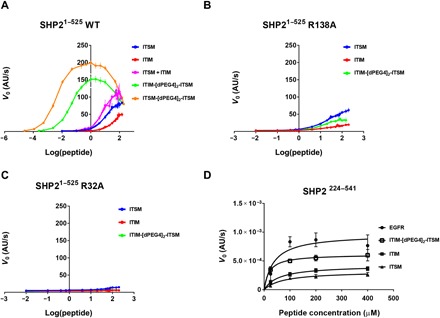
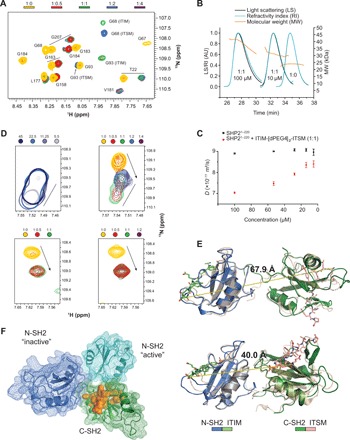
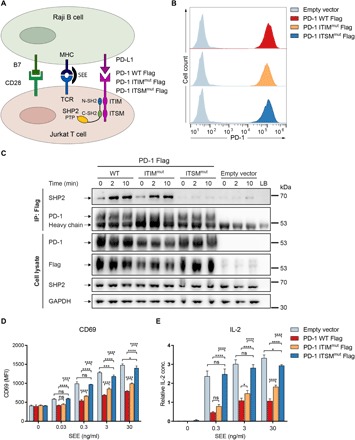
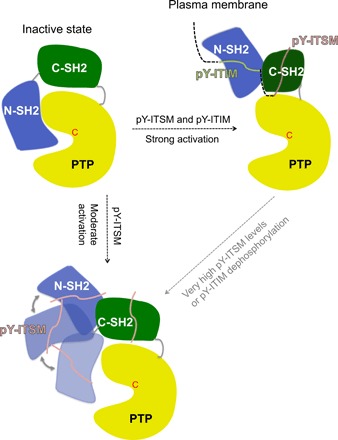
In cancer, the programmed death-1 (PD-1) pathway suppresses T cell stimulation and mediates immune escape. Upon stimulation, PD-1 becomes phosphorylated at its immune receptor tyrosine-based inhibitory motif (ITIM) and immune receptor tyrosine-based switch motif (ITSM), which then bind the Src homology 2 (SH2) domains of SH2-containing phosphatase 2 (SHP2), initiating T cell inactivation. The SHP2-PD-1 complex structure and the exact functions of the two SH2 domains and phosphorylated motifs remain unknown. Here, we explain the structural basis and provide functional evidence for the mechanism of PD-1-mediated SHP2 activation. We demonstrate that full activation is obtained only upon phosphorylation of both ITIM and ITSM: ITSM binds C-SH2 with strong affinity, recruiting SHP2 to PD-1, while ITIM binds N-SH2, displacing it from the catalytic pocket and activating SHP2. This binding event requires the formation of a new inter-domain interface, offering opportunities for the development of novel immunotherapeutic approaches.


Figures

Fig. 1
Fig. 1. Interaction of the N-SH2 and C-SH2 domains with ITIM and ITSM.
(A) Domain composition of SHP2 and PD-1. Highlighted are the conserved R32 and R138 required for binding phosphopeptides, the catalytic C459, and the putative phosphorylation sites Y542 and Y584 on SHP2, as well as the phosphorylation sites on the PD-1 cytoplasmic domain. (B and C) Excerpts from 1H-15N heteronuclear single-quantum coherence (HSQC) spectra of N-SH2 upon addition of ITIM (B) and ITSM (C). ppm, parts per million. (D and E) Excerpts from 1H-15N HSQC spectra of C-SH2 upon addition of ITIM (D) and ITSM (E). The protein concentration was 200 μM; the color code (top) indicates the protein:peptide molar ratios. All spectra were recorded at 298 K and 600 MHz.
Fig. 2
Fig. 2. Structure of SH2 domains in complex with ITIM and ITSM.
(A) Crystallographic structure of N-SH2–ITIM. N-SH2, blue; ITIM, green. (B) Crystallographic structure of N-SH2–ITSM. N-SH2, blue; ITSM, pink. (C) Lowest energy structure of the NMR ensemble of C-SH2–ITSM. C-SH2, green; ITSM, pink. In each panel, an overview of the complete structure is shown on the left (with protein hydrophobic patches interacting with the peptide C-terminal region shown as gray surfaces). Insets on the right show the interactions of the phosphate group (top), H bonds formed between the peptide and the BG loop of the protein (middle), and hydrophobic interactions of the peptide C-terminal region (bottom). The peptide residues are numbered starting from the pY residue (zero) as positive and negative numbers in the direction of the C and N terminus, respectively.
Fig. 3
Fig. 3. SHP2 activation in vitro by different PD-1–derived phosphopeptides.
(A) DiFMUP-based activation assays of WT SHP2 with increasing concentrations of ITIM, ITSM, ITIM-[dPEG4]2-ITSM, and ITSM-[dPEG4]2-ITSM peptides. (B and C) DiFMUP-based activation assay of the SHP2-R32A (B) or the SHP2-R138A mutant (C) with increasing concentrations of ITIM, ITSM, and ITIM-[dPEG4]2-ITSM. In (A) to (C), the individual data points represent mean values with the error bars corresponding to the SEM of three independent experiments, each performed in triplicate. (D) EnzChek-based phosphatase activity assay of SHP2224–541 with peptides at concentrations of 25, 100, 200, and 400 μM. The slope values from the linear range of the kinetic curves are plotted as initial velocities. The individual data points represent mean values with error bars corresponding to the SEMs of three independent experiments (each performed in duplicate) for all cases except for ITIM-[dPEG4]2-ITSM, where only two independent experiments were performed. AU, arbitrary units; V0, initial velocity.
Fig. 4
Fig. 4. A new N-SH2:C-SH2 interface forms upon simultaneous binding of ITIM-[dPEG4]2-ITSM to both SH2 domains of SHP21–220.
(A) Excerpt from the 1H-15N NMR spectrum of SHP21–220 in the presence of different stoichiometric ratios of ITIM-[dPEG4]2-ITSM shows two sets of peaks for amino acids 1 to 110, matching those of the N-SH2–ITIM and N-SH2–ITSM complexes. With excess peptide, the ITSM-bound peak becomes dominant. Colors represent protein:peptide molar equivalents. (B) Size-exclusion chromatography (SEC)–multiangle light scattering (MALS) profiles of equimolar SHP21–220:ITSM-[dPEG4]2-ITSM mixtures at either 10 or 100 μM, together with the profile of the unbound protein. (C) Translation diffusion coefficients measured by NMR DOSY (diffusion-ordered spectroscopy) for equimolar SHP21–220:ITIM-[dPEG4]2-ITSM mixtures at concentrations in the 5 to 100 μM range. (D) Top left: S189 CSPs upon dilution of a 1:1.2 SHP21–220:ITIM-[dPEG4]2-ITSM mixture. Shades of blue represent different concentrations. Top right: S189 CSPs upon titration of increasing molar ratios of ITIM-[dPEG4]2-ITSM ([SHP21–220] = 100 μM). The straight lines and arrows indicate concentration-dependent CSPs and CSPs from the unbound to the bound state, respectively. The peak indicative of the new interdomain interface reaches its maximum intensity at equimolar SHP21–220:ITIM-[dPEG4]2-ITSM and disappears with excess peptide. Bottom left and right: Titration of a mixture of isolated N-SH2 and C-SH2 at 200 μM each (left) or C-SH2 alone (right) with ITIM-[dPEG4]2-ITSM. The S189 peak corresponding to the new interdomain interface is not visible. (E) Homology models of SHP1–220 with ITIM and ITSM bound to the N-SH2 and C-SH2 domain, respectively, obtained by superposition of the N-SH2–ITIM and C-SH2–ITSM structures on the respective SH2 domains of PDB entry 2SHP (top, autoinhibited state of SHP2) and PDB entry 3PS5 (bottom, open state of SHP1). The dashed lines represent the distance between the ITIM C terminus and the ITSM N terminus. The length of the extended connecting linker in PD-1 is ~40 Å. (F) Superposition of the SHP21–220 models of (E) aligned on the C-SH2 domain (green). The N-SH2 domains from PDB entries 2SHP and 3PS5 are in blue and cyan, respectively. Residues in orange show CSPs upon dilution of the equimolar SHP21–220:ITIM-[dPEG4]2-ITSM mixture (D) and are located at the N-SH2:C-SH2 interface in either structure.
Fig. 5
Fig. 5. Effect of PD-1 mutants on SHP2 binding and TCR-induced T cell activation.
(A) Experimental setup for quantifying the inhibitory effect of PD-1 on TCR-mediated T cell activation. Raji B cells were lentivirally transduced with PD-L1 and used as antigen-presenting cells. Jurkat T cells were transduced with either WT PD-1, PD-1 ITIMmut, PD-1 ITSMmut, or an empty vector. For TCR stimulation, the B cells were incubated with superantigen [staphylococcal enterotoxin E (SEE)] and cocultured with the T cells. Upon activation of PD-1, ITIM and ITSM become phosphorylated and recruit SHP2. (B) Quantification of the surface expression of WT PD-1 (red), PD-1 ITIMmut (orange), and PD-1 ITSMmut (blue) in the different Jurkat cell lines. Cells containing an empty vector are used as negative control. (C) Coimmunoprecipitation (IP) experiment demonstrating SHP2 binding to the PD-1 variants after incubation of T cells with SEE-loaded B cells (30 ng/ml) for the indicated time points. PD-1, Flag, and SHP2 protein levels were analyzed; glyceraldehyde-3-phosphate dehydrogenase (GAPDH) was used as a loading control. (D) CD69 expression levels of the Jurkat T cell lines (WT PD-1, PD-1 ITIMmut, and PD-1 ITSMmut) were measured by flow cytometry after 5 hours of stimulation with B cells preincubated with different SEE concentrations. The mean fluorescence intensity (MFI) is shown. (E) Relative interleukin-2 (IL-2) levels in the supernatant of the Jurkat cell cultures (WT PD-1, PD-1 ITIMmut, and PD-1 ITSMmut) were measured by enzyme-linked immunosorbent assay (ELISA) after 24 hours of stimulation with SEE-loaded B cells. Statistics are based on two-way analysis of variance (ANOVA) and Bonferroni multiple comparison test. Data points represent one of three independent experiments, each performed in triplicate. ns, P > 0.05,*P < 0.05, ***P < 0.001, ****P < 0.0001; n = 3.
Fig. 6
Fig. 6. Two activation mechanisms of SHP2 by PD-1.
Binding of phosphoproteins activates the autoinhibited form of SHP2 (left) by acting to remove the N-SH2 domain from the PTP binding site. Activation can occur in two ways. Top right: When the doubly phosphorylated PD-1 tail binds simultaneously to both SH2 domains of SHP2, the phosphatase adopts a stable open conformation, where the N-SH2 is locked behind the C-SH2 due to the restraint imposed by the linker connecting ITIM and ITSM. Bottom left: When ITIM is dephosphorylated or ITSM is present in large excess, ITSM binds to the N-SH2 domain, thereby weakening its interaction with the PTP domain. However, in the absence of the divalent binding event, the N-SH2 domain is not locked behind the C-SH2 domain and may adopt many orientations (depicted schematically by three representative orientations connected by the gray double-headed arrows). In some of these orientations, the N-SH2 domain may occupy the space close to the PTP domain, partially occluding access to its active site. The switch between the two mechanisms may represent a way to regulate the efficiency of SHP2 activation depending on the concentration of the activating phosphorylated motifs.

References

    1. Dance M., Montagner A., Salles J.-P., Yart A., Raynal P., The molecular functions of Shp2 in the Ras/mitogen-activated protein kinase (ERK1/2) pathway. Cell. Signal. 20, 453–459 (2008). - PubMed
    1. Hof P., Pluskey S., Dhe-Paganon S., Eck M. J., Shoelson S. E., Crystal structure of the tyrosine phosphatase SHP-2. Cell 92, 441–450 (1998). - PubMed
    1. Neel B. G., Gu H., Pao L., The 'Shp'ing news: SH2 domain-containing tyrosine phosphatases in cell signaling. Trends Biochem. Sci. 28, 284–293 (2003). - PubMed
    1. Pluskey S., Wandless T. J., Walsch C. T., Schoelson S. E., Potent stimulation of SH-PTP2 phosphatase activity by simultaneous occupancy of both SH2 domains. J. Biol. Chem. 270, 2897–2900 (1995). - PubMed
    1. Li S., Hsu D. D., Wang H., Feng G.-S., Dual faces of SH2-containing protein-tyrosine phosphatase Shp2/PTPN11 in tumorigenesis. Front. Med. 6, 275–279 (2012). - PubMed

Publication types

MeSH terms

Substances