. 2020 Jan 28;5(5):2169-2179.
doi: 10.1021/acsomega.9b03084. eCollection 2020 Feb 11.

Toxicological Risks of Renqingchangjue in Rats Evaluated by 1H NMR-Based Serum and Urine Metabolomics Analysis

Affiliations

Toxicological Risks of Renqingchangjue in Rats Evaluated by 1H NMR-Based Serum and Urine Metabolomics Analysis

Xia Wang et al. ACS Omega. .

Abstract

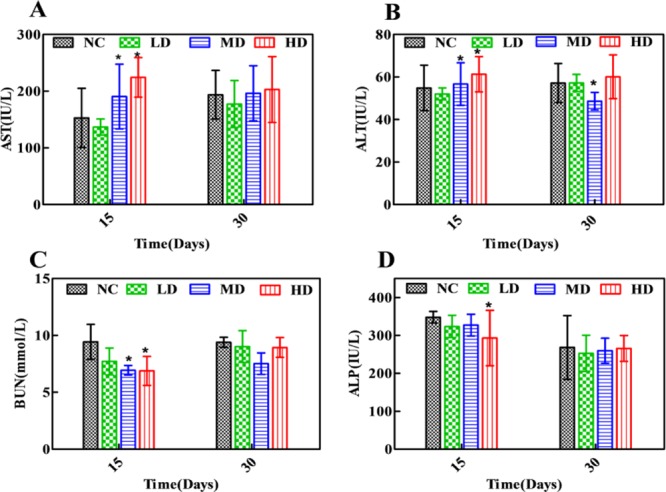
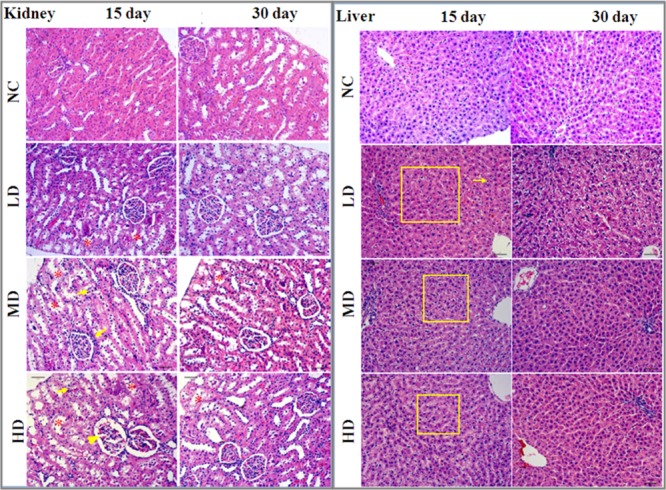
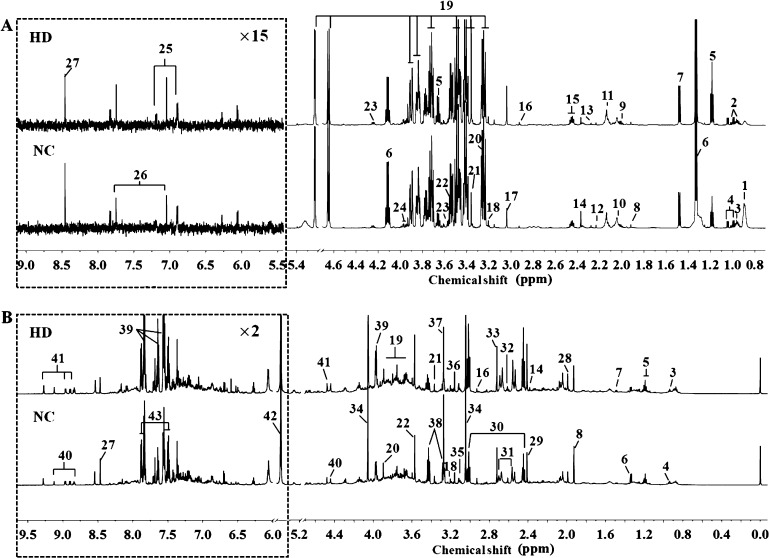
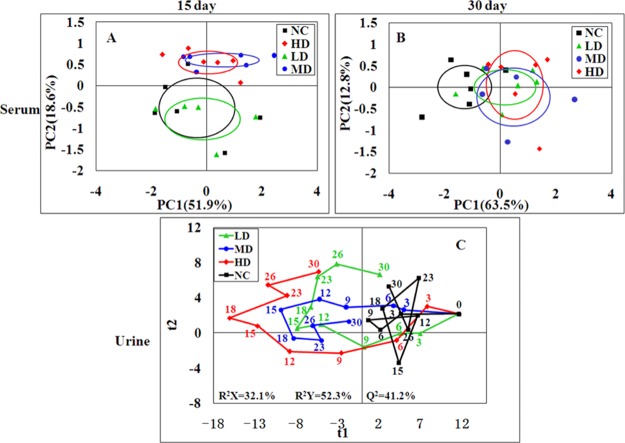
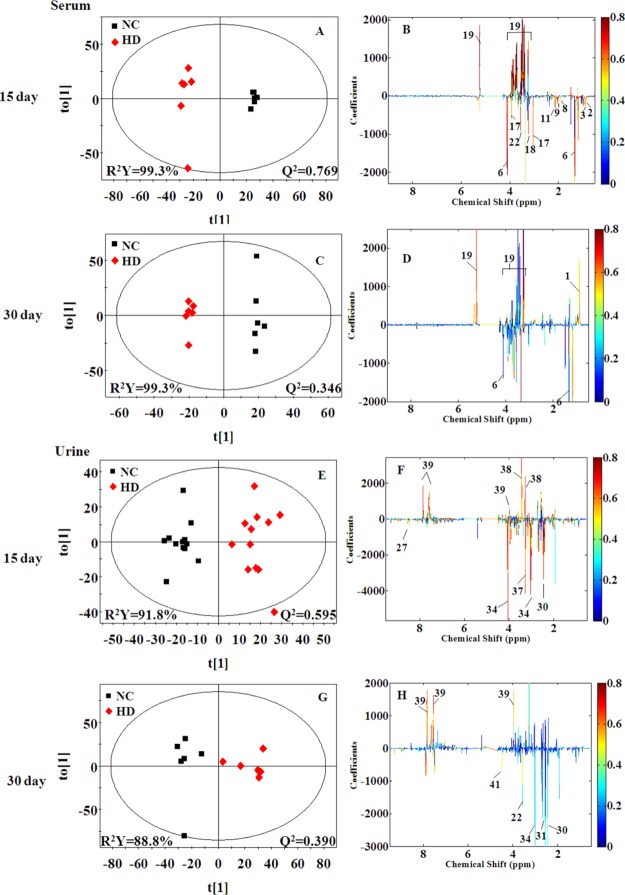
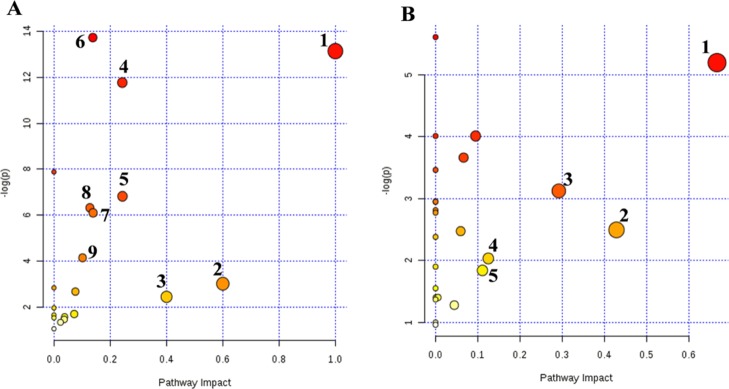
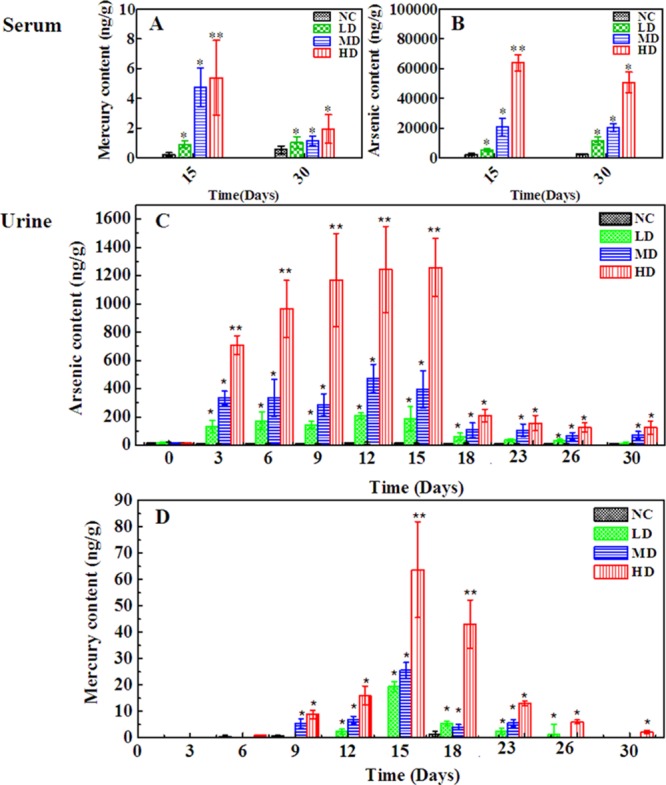
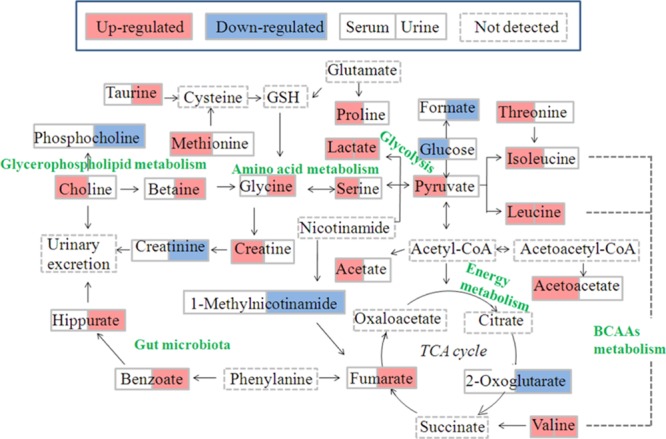
Renqingchangjue (RQCJ), a kind of Traditional Tibetan Medicine, has been widely utilized to treat various gastroenteritis diseases. However, the biosafety and toxicity of RQCJ was still indefinite because of toxic components in RQCJ, which included a variety of heavy metals. Thus, this study was aimed to evaluate the toxicity and expound the toxicological mechanism of RQCJ. In this study, rats were intragastrically administered with different doses of RQCJ for 15 days, and then, the restorative observation period lasted for 15 days. Liver and kidney tissues were collected for histopathological examination, and simultaneously serum and urine samples were collected for 1H nuclear magnetic resonance (1H NMR) spectroscopy analysis and biochemical analysis combined with inductively coupled plasma mass spectrometry (ICP-MS) measurement. The 1H NMR-based metabolomics analysis revealed that the administration of RQCJ significantly altered the concentrations of 14 serum metabolites and 14 urine metabolites, which implied disturbances in energy metabolism, amino acid metabolism, intestinal flora environment, and membrane damage. Besides, the biochemical analysis of serum samples was consistent with the histopathological results, which indicated slight hepatotoxicity and nephrotoxicity. The quantification of As and Hg in urine and serum samples by ICP-MS provided more evidence about the toxicity of RQCJ. This work provided an effective method to systematically and dynamically evaluate the toxicity of RQCJ and suggested that precautions should be taken in the clinic to monitor the potential toxicity of RQCJ.


Conflict of interest statement

The authors declare no competing financial interest.

Figures

Figure 1
Figure 1
Distribution of AST (A), ALT (B), BUN (C), and ALP (D) in serum of rats. *p < 0.05 vs NC group. NC: normal control group, LD: low-dose group, MD: middle-dose group, HD: high-dose group.
Figure 2
Figure 2
Histopathological examination of liver and kidney tissues of rats among the four groups by H&E staining (10×). Renal tubular lesions (*), inflammatory cell infiltration (↓), and necrosis of hepatocytes (□). NC: normal control group, LD: low-dose group, MD: middle-dose group, HD: high-dose group.
Figure 3
Figure 3
Representative 600 MHz 1H NMR spectra of serum (A) and urine (B) samples obtained from NC and HD groups on 15th day. Metabolites: (1) LDL&VLDL; (2) isoleucine; (3) leucine; (4) valine; (5) ethanol; (6) lactate; (7) alanine; (8) acetate; (9) proline; (10) N-acetylglycoprotein; (11) methionine; (12) acetone; (13) acetoacetate; (14) pyruvate; (15) glutamine; (16) N,N-dimethylglycine; (17) creatine; (18) choline; (19) glucose; (20) betaine; (21) methanol; (22) glycine; (23) threonine; (24) serine; (25) tyrosine; (26) methylhistidine; (27) formate; (28) acetamide; (29) succinate; (30) 2-oxoglutarate; (31) citrate; (32) methylamine; (33) dimethylamine; (34) creatinine; (35) cis-aconitate; (36) malonate; (37) trimethylamine N-oxide (TMAO); (38) taurine; (39) hippurate; (40) trigonelline; (41) 1-methylnicotinamide; (42) allantoin; (43) benzoate. NC: normal control group, HD: high-dose group. (Dotted square) ×15 magnification in serum spectra and ×2 magnification in urine spectra.
Figure 4
Figure 4
PCA score plot of serum (A,B) samples from the four groups at day 15 and day 30 and PLS-DA score trajectory plots of urine (C) samples from the four groups at days 0, 3, 6, 9, 12, 15, 18, 23, 26, and 30. Day 0: one day before treatment, days 3–15: the time points of administration, days 18–30: the time points of stop administration. In PLS-DA score trajectory plots, each point represented the mean position of a group (n = 12). NC: normal control group, LD: low-dose group, MD: middle-dose group, HD: high-dose group.
Figure 5
Figure 5
OPLS-DA score plots (A,C,E, and G) and color-coded coefficient plots (B,D,F, and H) of serum (A–D) and urine (E–H) samples from the NC and HD groups on days 15 and day 30. Metabolite variation could be visualized by the color-coded coefficient plots. The alteration of metabolites between groups were identified according to the first principal component [t(1)]. The upper section of the coefficient plots indicated the increased metabolites of the group in the positive direction of [t(1)], and vice versa. NC: normal control group, HD: high-dose group.
Figure 6
Figure 6
Metabolic pathway analysis of potential biomarkers in serum (A) and urine (B) serum: (1) valine, leucine and isoleucine biosynthesis; (2) synthesis and degradation of ketone bodies; (3) methane metabolism; (4) glycine, serine and threonine metabolism; (5) pyruvate metabolism; (6) aminoacyl-tRNA biosynthesis; (7) cysteine and methionine metabolism; (8) glycolysis or gluconeogenesis; (9) butanoate metabolism. Urine: (1) valine, leucine and isoleucine biosynthesis; (2) taurine and hypotaurine metabolism; (3) glycine, serine and threonine metabolism; (4) nicotinate and nicotinamide metabolism; (5) glyoxylate and dicarboxylate metabolism.
Figure 7
Figure 7
Content of As and Hg in rats serum (A,B) and urine samples (C,D) from the four groups. *p < 0.05, **p < 0.01 vs control group. NC: normal control group, LD: low-dose group, MD: middle-dose group, HD: high-dose group.
Figure 8
Figure 8
Schematic diagram of the disturbed metabolic pathways related to toxicity induced by RQCJ, showing the interrelationship of the identified metabolic pathways.

References

    1. Liu M.; He Y.; Ge S.; Cheng M.; Xie H.; Yu C.; Wang X. Chemical Form and Bioaccessibility of Mercury in Traditional Tibetan Medicines. Environ. Sci. Technol. Lett. 2018, 5, 552–557. 10.1021/acs.estlett.8b00371. - DOI
    1. Cesnek M.; Štefánik M.; Miglierini M.; Kmječ T.; Sklenka L. U. Analysis of traditional Tibetan pills. Hyperfine Interact. 2017, 238, 93.10.1007/s10751-017-1469-8. - DOI
    1. Zhou L.-L.; Chen H.-J.; He Q.-Q.; Li C.; Wei L.-X.; Shang J. Evaluation of hepatotoxicity potential of a potent traditional Tibetan medicine Zuotai. J. Ethnopharmacol. 2019, 234, 112–118. 10.1016/j.jep.2018.12.028. - DOI - PubMed
    1. Sallon S.; Dory Y.; Barghouthy Y.; Tamdin T.; Sangmo R.; Tashi J.; Yangdon S.; Yeshi T.; Sadutshang T.; Rotenberg M.; Cohen E.; Harlavan Y.; Sharabi G.; Bdolah-Abram T. Is mercury in Tibetan Medicine toxic? Clinical, neurocognitive and biochemical results of an initial cross-sectional study. Exp. Biol. Med. 2017, 242, 316–332. 10.1177/1535370216672748. - DOI - PMC - PubMed
    1. Li C.; Xu W.; Chu S.; Zheng Z.; Xiao Y.; Li L.; Bi H.; Wei L. The chemical speciation, spatial distribution and toxicity of mercury from Tibetan medicine Zuotai,β-HgS and HgCl2 in mouse kidney. J. Trace Elem. Med. Biol. 2018, 45, 104–113. 10.1016/j.jtemb.2017.08.010. - DOI - PubMed

LinkOut - more resources