. 2020 May;160(1):64-77.
doi: 10.1111/imm.13182. Epub 2020 Mar 18.

CpG-ODN-mediated TLR9 innate immune signalling and calcium dyshomeostasis converge on the NFκB inhibitory protein IκBβ to drive IL1α and IL1β expression

Affiliations

CpG-ODN-mediated TLR9 innate immune signalling and calcium dyshomeostasis converge on the NFκB inhibitory protein IκBβ to drive IL1α and IL1β expression

Robyn De Dios et al. Immunology. 2020 May.

Abstract

Sterile inflammation contributes to many pathological states associated with mitochondrial injury. Mitochondrial injury disrupts calcium homeostasis and results in the release of CpG-rich mitochondrial DNA. The role of CpG-stimulated TLR9 innate immune signalling and sterile inflammation is well studied; however, how calcium dyshomeostasis affects this signalling is unknown. Therefore, we interrogated the relationship beτween intracellular calcium and CpG-induced TLR9 signalling in murine macrophages. We found that CpG-ODN-induced NFκB-dependent IL1α and IL1β expression was significantly attenuated by both calcium chelation and calcineurin inhibition, a finding mediated by inhibition of degradation of the NFκB inhibitory protein IκBβ. In contrast, calcium ionophore exposure increased CpG-induced IκBβ degradation and IL1α and IL1β expression. These results demonstrate that through its effect on IκBβ degradation, increased intracellular Ca2+ drives a pro-inflammatory TLR9-mediated innate immune response. These results have implications for the study of innate immune signalling downstream of mitochondrial stress and injury.

Keywords: cytokines; inflammation; monocytes/macrophages; rodent; transcription factors; transgenic/knockout mice.


Conflict of interest statement

The authors declare no potential financial or ethical conflicts of interest.

Figures

Figure 1
Figure 1
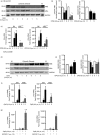
Exposure to CpG‐ODN causes dose‐ and time‐dependent IκBβ and IκB⍺ degradation. (a) Representative Western blot of whole‐cell lysates from RAW 264.7 exposed to CpG‐ODN (0·3–3 µm, 1 hr). Whole‐cell lysate from RAW 264.7 exposed to lipopolysaccharide (LPS; 1 μg/ml, 1 hr) as the positive control and calnexin shown as the loading control. Densitometric values normalized to calnexin for individual lanes are provided below each lane. (b) Representative Western blot of cytosolic extracts from RAW 264.7 exposed to CpG‐ODN (3 µm, 0–8 hr) with calnexin shown as the loading control. (c) Densitometry ratio to control of IκB⍺ and IκBβ in cytosolic extracts from RAW 264.7 exposed to CpG‐ODN. Values shown as means ± SEM; n = 6/time point. *P < 0·05 versus unexposed control. (d) Representative Western blot of cytosolic extracts from bone marrow‐derived macrophages (BMDMs) exposed to CpG‐ODN (0·3 µm, 0–5 hr) with GAPDH shown as the loading control. (e) Densitometry ratio to control of IκB⍺ and IκBβ in cytosolic extracts from BMDMs exposed to CpG‐ODN. Values shown as means ± SEM; n = 3/time point. *P < 0·05 versus unexposed control.
Figure 2
Figure 2
Exposure to CpG‐ODN leads to nuclear translocation of the NFκB subunits cREL, p65 and p50. (a) Representative Western blot of nuclear extracts from RAW 264.7 exposed to CpG‐ODN (3 µm, 0–8 hr) with lamin B shown as the loading control. (b) Densitometry ratio to control of p65, p50, cREL in nuclear extracts from RAW 264.7 exposed to CpG‐ODN. Values shown as means ± SEM; n = 6/time point. *P < 0·05 versus unexposed control. (c) Representative Western blot of nuclear extracts from RAW 264.7 exposed to CpG‐ODN (3 µm, 0–24 hr) with lamin B shown as the loading control. (d) Densitometry ratio to control of p65, p50, cREL in nuclear extracts from RAW 264.7 exposed to CpG‐ODN. Values shown as means ± SEM; n = 6/time point. *P < 0·05 versus unexposed control. (e) Representative Western blot of nuclear extracts from bone marrow‐derived macrophages (BMDMs) exposed to CpG‐ODN (0·3 µm, 0–5 hr) with HDAC shown as the loading control. (f) Densitometry ratio to control of p65 and p50 in nuclear extracts from BMDMs exposed to CpG‐ODN. Values shown as means ± SEM; n = 3/time point. *P < 0·05 versus unexposed control.
Figure 3
Figure 3
CpG‐ODN‐induced expression of IL1⍺ and IL1β is attenuated by the NFκB inhibitor Bay 11‐7085. (a) Fold‐increase in IL1⍺ and IL1β mRNA expression in RAW 264.7 following CpG‐ODN exposure (3 µm, 0–5 hr). n = 6/time point. *P < 0·05 versus unexposed control. (b) Fold‐increase in IL1⍺ and IL1β mRNA expression in RAW 264.7 following CpG‐ODN exposure (3 µm, 24 hr). n = 6/time point. *P < 0·05 versus unexposed control. (c) Fold‐increase in IL1⍺ and IL1β mRNA expression in bone marrow‐derived macrophages (BMDMs) following CpG‐ODN exposure (0·3 µm, 0–5 hr). n = 3/time point. *P < 0·05 versus unexposed control. (d) Representative Western blot of whole‐cell lysates from RAW 264.7 pre‐treated with the NFκB pharmacological inhibitor BAY 11‐7085 (0–10 µm, 1 hr) followed by CpG‐ODN exposure (3 µm, 0–1 hr) with calnexin shown as the loading control. (e) Representative Western blot of cytosolic extracts from RAW 264.7 pre‐treated with the NFκB pharmacological inhibitor Bay 11‐7085 (10 µm, 1 hr) followed by CpG‐ODN exposure (3 µm, 0–4 hr). Calnexin shown as the loading control. (f) Representative Western blot of nuclear extracts from RAW 264.7 pre‐treated with the NFκB pharmacological inhibitor Bay 11‐7085 (10 µm; 1 hr) followed by CpG‐ODN exposure (3 µm, 0–5 hr). HDAC shown as the loading control. (g) Fold‐change in IL1⍺ and IL1β mRNA expression in RAW 264.7 pre‐treated with the NFκB pharmacological inhibitor BAY 11‐7085 (1–10 µm, 1 hr) followed by CpG‐ODN exposure (3 µm, 5 hr). n = 5/time point. *P < 0·05 versus unexposed control. P < 0·05 versus CpG‐ODN exposed.
Figure 4
Figure 4
Lipopolysaccharide (LPS)‐induced TLR4 mediated IκBβ degradation is responsive to alterations in intracellular calcium. (a) Representative Western blot of whole‐cell lysates from RAW 264.7 pre‐treated with calcium chelator EGTA‐AM (250 µm, 0·5 hr) followed by LPS exposure (100 ng/ml, 0–4 hr) with calnexin shown as the loading control. (b) Densitometry ratio to control of IκBβ in whole‐cell lysates from RAW 264.7 following pre‐treatment with the cell‐permeable calcium chelator EGTA‐AM followed by LPS exposure. Values shown as means ± SEM; n = 5/time point. *P < 0·05 versus unexposed control. (c) Representative Western blot of whole‐cell lysates from RAW 264.7 pre‐treated with calcineurin inhibitor FK‐506 (0·1–10 µm, 24 hr) followed by LPS exposure (100 ng/ml, 5 hr) with calnexin shown as the loading control. (d) Densitometry ratio to control of IκBβ in whole‐cell lysates from RAW 264.7 following pre‐treatment with calcineurin inhibitor FK‐506 followed by LPS exposure. Values shown as means ± SEM; n = 5/time point. *P < 0·05 versus unexposed control. P < 0·05 versus LPS exposed. (e) Representative Western blot of whole‐cell lysates from RAW 264.7 exposed to calcium ionophore A23187 (10 µm, 0–2 hr) with calnexin shown as the loading control. (f) Densitometry ratio to control of cytosolic IκBβ in RAW 264.7 lysates following exposure to calcium ionophore A23187. Values shown as means ± SEM; n = 3/time point. *P < 0·05 versus unexposed control.
Figure 5
Figure 5
Treatment with EGTA‐AM or FK‐506 prior to CpG exposure reduced IκBβ degradation as well as IL1⍺ and IL1β expression. Representative immunofluorescence staining of (a) control and (b) CpG‐ODN exposed (3 µm, 1 hr) RAW 264.7 macrophages pre‐treated with the cell‐permeable calcium‐sensitive fluorescent indicator Fluo‐4, AM. Images were captured with the same settings. Internal scale bar: 50 μm. (c) Representative Western blot of whole‐cell lysates from RAW 264.7 pre‐treated with calcium chelator EGTA‐AM (250 µm, 0·5 hr) or calcineurin inhibitor FK‐506 (10 µm, 24 hr) followed by CpG‐ODN exposure (3 µm, 0–4 hr) with calnexin shown as the loading control. (d) Densitometry ratio to control of IκBβ in whole‐cell lysates from RAW 264.7 lysates following pre‐treatment with the cell‐permeable calcium chelator EGTA‐AM or calcineurin inhibitor FK‐506 followed by CpG‐ODN exposure. Values shown as means ± SEM; n = 5/time point. *P < 0·05 versus unexposed control. P < 0·05 versus CpG‐ODN exposed. (e) Fold‐change in IL1⍺ and IL1β mRNA expression in RAW 264.7 pre‐treated with calcium chelator EGTA‐AM (250 µm, 0·5 hr) followed by CpG‐ODN exposure (3 µm, 0–4 hr). n = 5/time point. *P < 0·05 versus unexposed control. P < 0·05 versus CpG‐ODN exposed. (f) Fold‐change in IL1⍺ and IL1β expression in RAW 264.7 pre‐treated with calcineurin inhibitor FK‐506 (10 µm, 24 hr) followed by CpG‐ODN exposure (3 µm, 0–5 hr). n = 5/time point. *P < 0·05 versus unexposed control. P < 0·05 versus CpG‐ODN exposed.
Figure 6
Figure 6
Concurrent exposure to CpG‐ODN and A23187 accelerates IκBβ degradation, and increases IL1⍺ and IL1β expression. (a) Representative Western blot of whole‐cell lysates from RAW 264.7 lysates exposed concurrently to calcium ionophore A23187 (10 µm, 0–4 hr) and CpG‐ODN (3 µm, 0–4 hr) with calnexin shown as the loading control. (b) Densitometry ratio to control of IκBβ in whole‐cell lysates from RAW 264.7 following concurrent exposure to calcium ionophore A23187 and CpG‐ODN. Values shown as means ± SEM; n = 6/time point. *P < 0·05 versus unexposed control. P < 0·05 versus CpG‐ODN exposed. (c) Fold‐change in IL1⍺ and IL1β mRNA expression in RAW 264.7 following concurrent exposure to calcium ionophore A23817 (10 µm, 4 hr) and CpG‐ODN (3 µm, 0–4 hr). Values shown as means ± SEM; n = 6/time point. *P < 0·05 versus unexposed control. P < 0·05 versus CpG‐ODN exposed. (d) Fold‐change in IL1⍺ and IL1β mRNA expression in bone marrow‐derived macrophages (BMDMs) following concurrent exposure to calcium ionophore A23817 (0·5 µm, 4 hr) and CpG‐ODN (0·3 µm, 0–4 hr). Values shown as means ± SEM; n = 6/time point. *P < 0·05 versus unexposed control. P < 0·05 versus CpG‐ODN exposed.
Figure 7
Figure 7
IκBβ/NFκB signalling mediates CpG‐ODN‐induced IL1⍺ and IL1β expression. (a) Representative Western blot of cytosolic extracts from WT and IκBβ−/− bone marrow‐derived macrophages (BMDMs) exposed to CpG‐ODN (0·3 µm, 0–5 hr) with GAPDH shown as the loading control. (b) Densitometry ratio to control of IκB⍺ and IκBβ in cytosolic extracts from WT and IκBβ‐/‐ BMDMs following exposure to CpG‐ODN. Values shown as means ± SEM; n = 4/time point. *P < 0·05 versus unexposed control. P < 0·05 versus WT CpG‐ODN exposed. (c) Fold change in IL1⍺ and IL1β mRNA expression in WT and IκBβ−/− BMDMs following CpG‐ODN exposure (0·3 µm, 0–5 hr). Values shown as means ± SEM; n = 4/time point. *P < 0·05 versus unexposed control. P < 0·05 versus WT CpG‐ODN exposed. (d) Representative Western blot of cytosolic extracts from WT and AKBI BMDMs exposed to CpG‐ODN (0·3 µm, 0–5 hr) with GAPDH shown as the loading control. (e) Densitometry ratio to control of cytosolic IκB⍺ and IκBβ in cytosolic extracts from WT and AKBI BMDMs following exposure to CpG‐ODN. Values shown as means ± SEM; n = 4/time point. *P < 0·05 versus unexposed control. P < 0·05 versus WT CpG‐ODN exposed. (f) Fold‐change in IL1⍺ and IL1β mRNA expression in WT and AKBI BMDMs following CpG‐ODN exposure (0·3 µm, 0–5 hr). Values shown as means ± SEM; n = 4/time point. *P < 0·05 versus unexposed control. P < 0·05 versus WT CpG‐ODN exposed. (g) Fold‐change in IL1⍺ and IL1β mRNA expression in AKBI BMDMs following concurrent exposure to calcium ionophore A23187 (1 µm, 4 hr) and CpG‐ODN (0·3 µm, 4 hr). Values shown as means ± SEM; n = 3/time point. *P < 0·05 versus unexposed control. P < 0·05 versus AKBI CpG‐ODN exposed. # P < 0·05 versus AKBI A23187 exposed.

Similar articles

Cited by

References

    1. Rock KL, Latz E, Ontiveros F, Kono H. The sterile inflammatory response. Annu Rev Immunol 2010; 28:321–42. - PMC - PubMed
    1. Chen GY, Nunez G. Sterile inflammation: sensing and reacting to damage. Nat Rev Immunol 2010; 10:826–37. - PMC - PubMed
    1. Grazioli S, Pugin J. Mitochondrial damage‐associated molecular patterns: from inflammatory signaling to human diseases. Front Immunol 2018; 9:832. - PMC - PubMed
    1. Fang C, Wei X, Wei Y. Mitochondrial DNA in the regulation of innate immune responses. Protein Cell 2016; 7:11–6. - PMC - PubMed
    1. Shen H, Kreisel D, Goldstein DR. Processes of sterile inflammation. J Immunol 2013; 191:2857–63. - PMC - PubMed

Publication types

MeSH terms