. 2020 Sep 15;147(6):1694-1706.
doi: 10.1002/ijc.32925. Epub 2020 Feb 25.

Extracellular vesicles from human liver stem cells inhibit renal cancer stem cell-derived tumor growth in vitro and in vivo

Affiliations

Extracellular vesicles from human liver stem cells inhibit renal cancer stem cell-derived tumor growth in vitro and in vivo

Alessia Brossa et al. Int J Cancer. .

Abstract

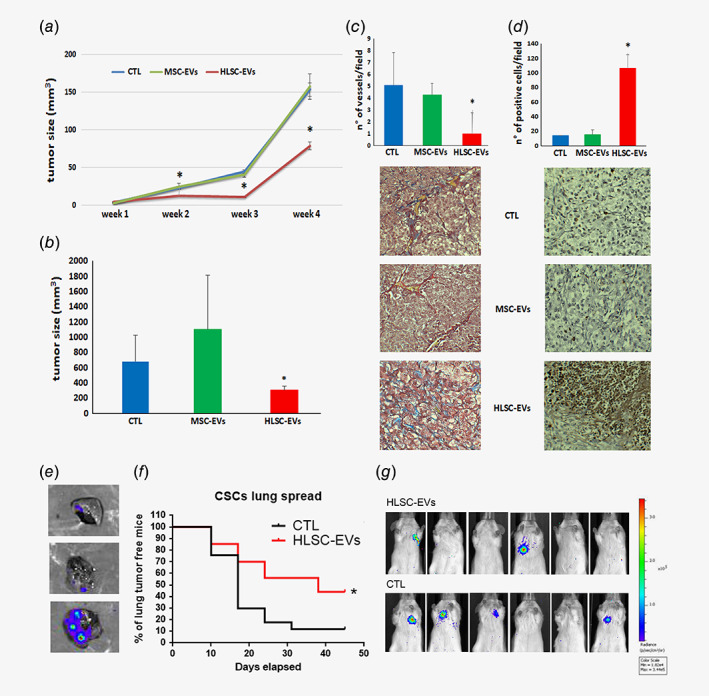
Cancer stem cells (CSCs) are considered as responsible for initiation, maintenance and recurrence of solid tumors, thus representing the key for tumor eradication. The antitumor activity of extracellular vesicles (EVs) derived from different stem cell sources has been investigated with conflicting results. In our study, we evaluated, both in vitro and in vivo, the effect of EVs derived from human bone marrow mesenchymal stromal cells (MSCs) and from a population of human liver stem cells (HLSCs) of mesenchymal origin on renal CSCs. In vitro, both EV sources displayed pro-apoptotic, anti-proliferative and anti-invasive effects on renal CSCs, but not on differentiated tumor cells. Pre-treatment of renal CSCs with EVs, before subcutaneous injection in SCID mice, delayed tumor onset. We subsequently investigated the in vivo effect of MSC- and HLSC-EVs systemic administration on progression of CSC-generated renal tumors. Tumor bio-distribution analysis identified intravenous treatment as best route of administration. HLSC-EVs, but not MSC-EVs, significantly impaired subcutaneous tumor growth by reducing tumor vascularization and inducing tumor cell apoptosis. Moreover, intravenous treatment with HLSC-EVs improved metastasis-free survival. In EV treated tumor explants, we observed both the transfer and the induction of miR-145 and of miR-200 family members. In transfected CSCs, the same miRNAs affected cell growth, invasion and survival. In conclusion, our results showed a specific antitumor effect of HLSC-EVs on CSC-derived renal tumors in vivo, possibly ascribed to the transfer and induction of specific antitumor miRNAs. Our study provides further evidence for a possible clinical application of stem cell-EVs in tumor treatment.

Keywords: antitumor therapy; exRNA; exosomes; microRNA; renal cell carcinoma.


Conflict of interest statement

V.F. and G.C. are inventors in a related patent application. G.C. is a member of the scientific advisory board of Unicyte AG.

Figures

Figure 1
Figure 1
In vitro effect of EVs on renal CSCs. (a) Proliferation levels, expressed as percentage, of two different renal CSCs clones (G7 and D2) incubated with different doses (ranging from 5 (5k) to 50 (50k) × 103 EVs/target cells) of MSC‐ or HLSC‐EVs. (b) Quantification of sphere formation ability of renal CSCs stimulated with two different doses of MSC‐ and HLSC‐EVs (10k and 50k EVs/target cell). (c) Representative micrographs showing the reduction of renal CSCs invasion capacity induced by MSC‐ and HLSC‐EVs treatment (50k/target cell). Original magnification: 200×. (d) Quantification of EVs effect (5, 10 and 50k EVs/target cell) on renal CSCs invasion, represented as percentage of invaded area. Data (a, b and c) are expressed as mean ± SD of three different experiments, normalized to untreated renal CSCs (CTL). *# p < 0.05 vs. CTL.
Figure 2
Figure 2
Effect of MSC‐ and HLSC‐EVs on differentiated RCC cells. (a) Representative micrographs showing hematoxylin and eosin (EE) and Periodic Acid Schiff (PAS) staining, and immunohistochemistry for Pan Cytokeratin (PanCK) and Vimentin of the isolated cells (CELLS) compared to the tissue of origin (TISSUE). (b) Summary of the different RCC types used for cell isolation, and expression of the epithelial marker EPCAM and of the endothelial marker CD31 evaluated by cytofluorimetric analysis (Score: +++ = >90%; ++ = >60%; + = >30%; +/− = <10% positive cells; − = No detected expression). (c–e) Quantification of proliferation (C), apoptosis (D) and invasion (E) of RCC‐derived cells treated or not with different doses of EVs (1–50k = 1–50 × 103 EVs/target cell). Data are represented as mean ± SD of at least two experiments performed at least on two RCC/type, normalized to untreated cells (CTL). *p < 0.05 and **p < 0.001 vs. CTL. (f) Representative micrographs of invasion assay performed on two RCC/type. Original magnification: 200×.
Figure 3
Figure 3
In vivo tumor growth after CSCs pretreatment with EVs and EV tumor targeting. (a) Percentage of mice that did not develop tumor after subcutaneous injection of renal CSCs pretreated with MSC‐ or HLSC‐EVs, calculated with Kaplan–Meier curve. Data are expressed as mean ± SD of 12 tumors for each group (CTL, MSC‐EVs and HLSC‐EVs). (b) Graph showing tumor size (mm3) of recovered plugs. (c) Representative images of tumors stained with Masson's trichromic reaction. (d) Representative images by Optical Imaging of tumors collected at 5 and 24 hr post‐EV injection. IV: intravenous, IP: intraperitoneal. (e) Fluorescence intensity of dissected tumors measured as Average Radiance ± SD at 5, 24 and 48 hr of mice treated with MSC‐EVs and HLSC‐EVs. Background signal derived from tumors of untreated mouse (n = 3) was subtracted; **p < 0.01 intravenous versus intraperitoneal injection.
Figure 4
Figure 4
Intravenous injection of HLSC‐EVs reduced tumor growth and delayed CSCs lung spread. (a) Tumor size (mm3) of untreated mice (CTL), and of mice i.v. treated with MSC‐ or HLSC‐EVs during the experiment. (b) Tumor size (mm3) of recovered plugs after sacrifice. (c) Evaluation of angiogenesis within plugs, expressed as number of vessels connected to mouse vasculature/field, and representative images of vessels stained with Masson's trichromic reaction. (d) Tumor apoptosis evaluation by Tunel assay, expressed as number of TUNEL positive cells/field, and representative micrographs showing apoptosis within tumors. (ad) Data are expressed as mean ± SEM of n = 20 tumors for control group (CTL), n = 18 for HLSC‐EVs group and n = 14 for MSC‐EVs group. *p > 0.05 vs. CTL. (e) Representative micrographs showing IVIS analysis of lung CSCs foci after 10 days from i.v. injection of renal CSCs; (f) Kaplan–Meier curve showing the percentage of mice that did not develop lung tumors during the time of experiment. Data are expressed as mean ± SEM of 24 HLSC‐EVs and 24 PBS treated mice. *p = 0.0016. (g) Representative micrographs showing IVIS analysis of lungs at Week 3.
Figure 5
Figure 5
HLSC‐EVs induce antitumor miRNA expression both in vivo and in vitro. (a) Antitumor miRNAs expression on renal CSCs‐derived tumors, evaluated by real‐time PCR, after 4 weeks of EV‐treatment. Data are expressed as mean ± SD of Relative Quantification (RQ) normalized to PBS‐treated tumors (CTL) and to RNU6B of 10 CTL, 10 MSC‐ and 10 HLSC‐EV treated tumors. **p < 0.001 vs. CTL. (b) Real‐time PCR analysis of antitumor miRNA targets in renal CSC‐derived tumors i.v. treated for 4 weeks with HLSC‐EVs (n = 10). Data are expressed as mean ± SD of Relative Quantification (RQ) normalized to PBS‐treated tumors (CTL) and to TBP. **p < 0.001 vs. CTL. (c and d) Real‐time PCR analysis of renal CSCs treated with HLSC‐EVs alone or in the presence of α‐Amanitin for 1, 3 and 6 hr, showing the expression of miR‐Let7b, miR200b, miR‐200c and miR‐145 (c) and of their targets C‐MYC, EGFR, ZEB2 and MMP1 (d). Data (c and d) are expressed as Relative Quantification (RQ) of three different experiments, normalized to RNU6B or TBP and to untreated cells (CTL). *p < 0.05 and **p < 0.001 vs. CTL; $ p < 0.05 and $$ p < 0.05 vs. HLSC‐EVs.
Figure 6
Figure 6
Transfection of renal CSCs with antitumor miRNAs. (ac) Functional assays performed on transfected renal CSCs, showing the effect of selected mimics on proliferation (a), apoptosis (b) and invasion (c) 72 hr after transfection. Data are expressed as mean ± SD of three independent experiments. *p < 0.05 and **p < 0.001 vs. CSCs transfection with scrambled sequences (SCR). (d) Schematic representation of the functional effect of specific mimics.

References

    1. Znaor A, Lortet‐Tieulent J, Laversanne M, et al. International variations and trends in renal cell carcinoma incidence and mortality. Eur Urol 2015;67:519–30. - PubMed
    1. Williamson SR, Taneja K, Cheng L. Renal cell carcinoma staging: pitfalls, challenges, and updates. Histopathology 2019;74:18–30. - PubMed
    1. Makhov P, Joshi S, Ghatalia P, et al. Resistance to systemic therapies in clear cell renal cell carcinoma: mechanisms and management strategies. Mol Cancer Ther 2018;17:1355–64. - PMC - PubMed
    1. Cabarcas SM, Mathews LA, Farrar WL. The cancer stem cell niche—there goes the neighborhood? Int J Cancer 2011;129:2315–27. - PMC - PubMed
    1. Bussolati B, Dekel B, Azzarone B, et al. Human renal cancer stem cells. Cancer Lett 2013;338:141–6. - PubMed

Publication types

MeSH terms