. 2020 Apr 10;126(8):988-1003.
doi: 10.1161/CIRCRESAHA.119.315428. Epub 2020 Feb 17.

T-Cell-Derived miRNA-214 Mediates Perivascular Fibrosis in Hypertension

Affiliations

T-Cell-Derived miRNA-214 Mediates Perivascular Fibrosis in Hypertension

Ryszard Nosalski et al. Circ Res. .

Abstract

Rationale: Despite increasing understanding of the prognostic importance of vascular stiffening linked to perivascular fibrosis in hypertension, the molecular and cellular regulation of this process is poorly understood.

Objectives: To study the functional role of microRNA-214 (miR-214) in the induction of perivascular fibrosis and endothelial dysfunction driving vascular stiffening.

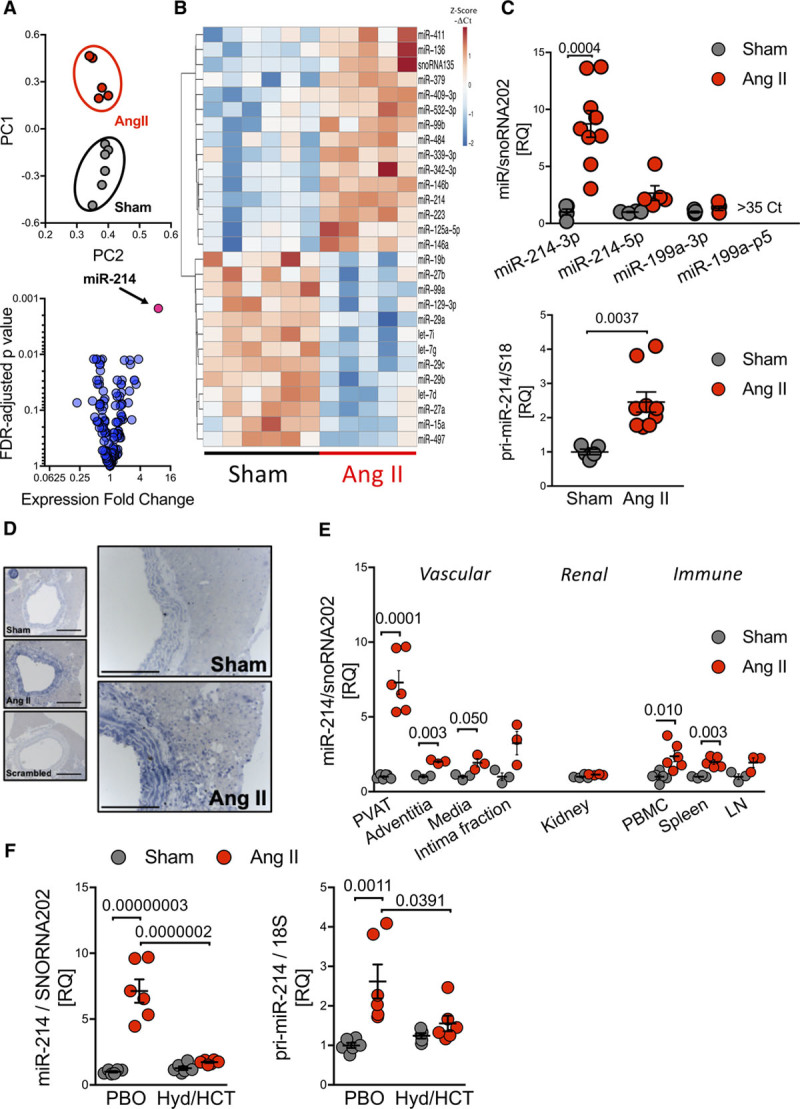
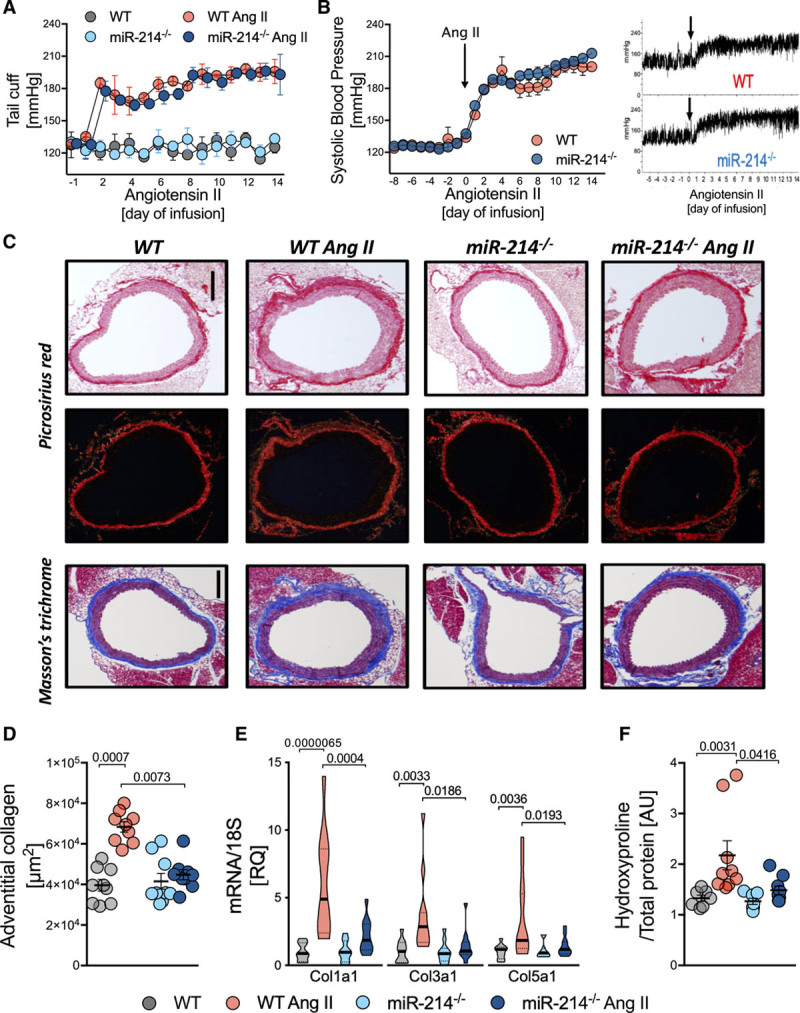
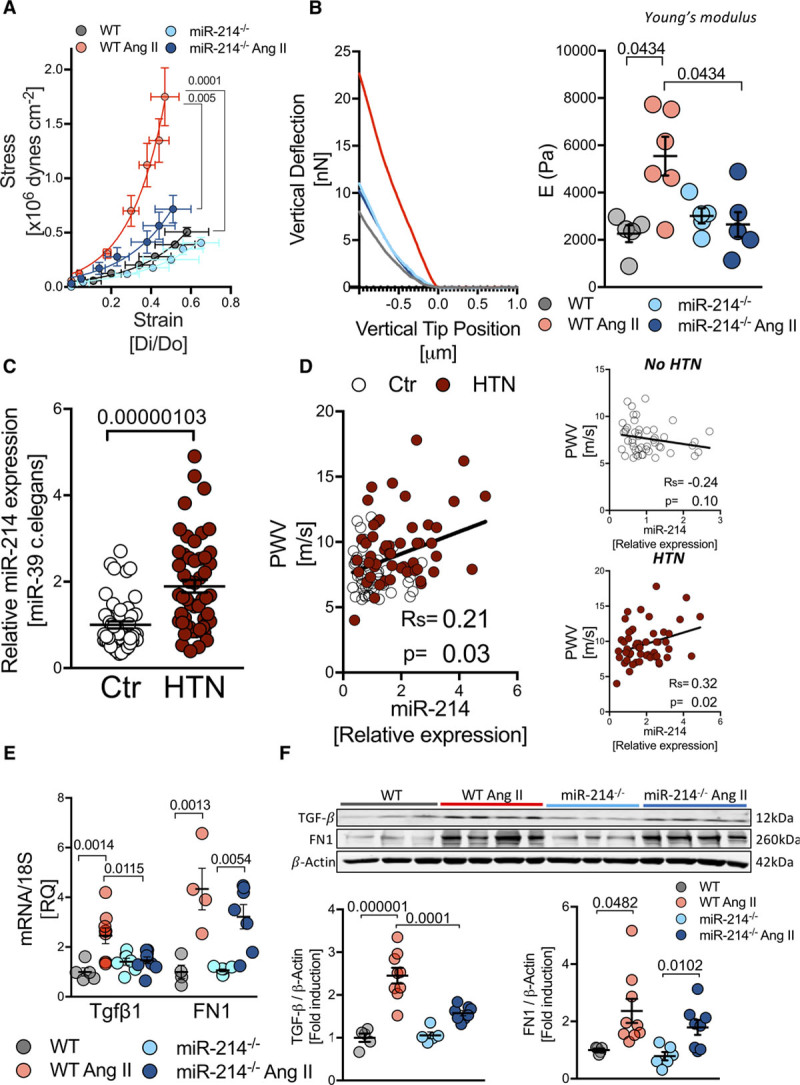
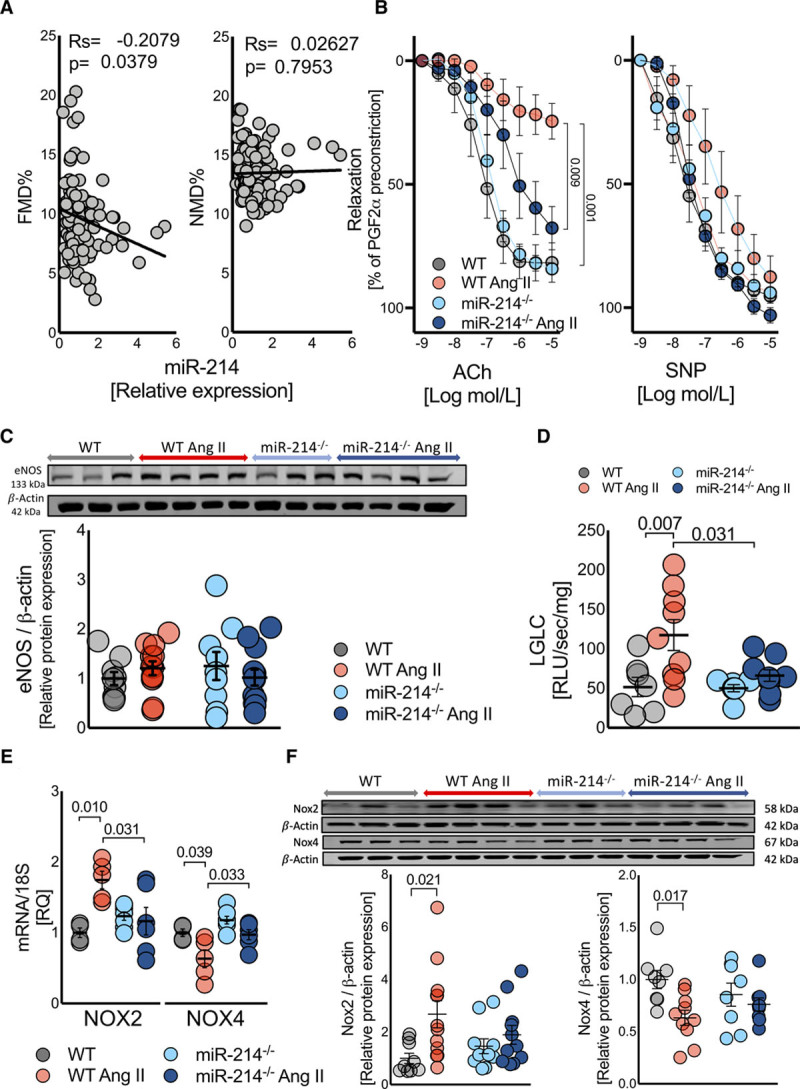
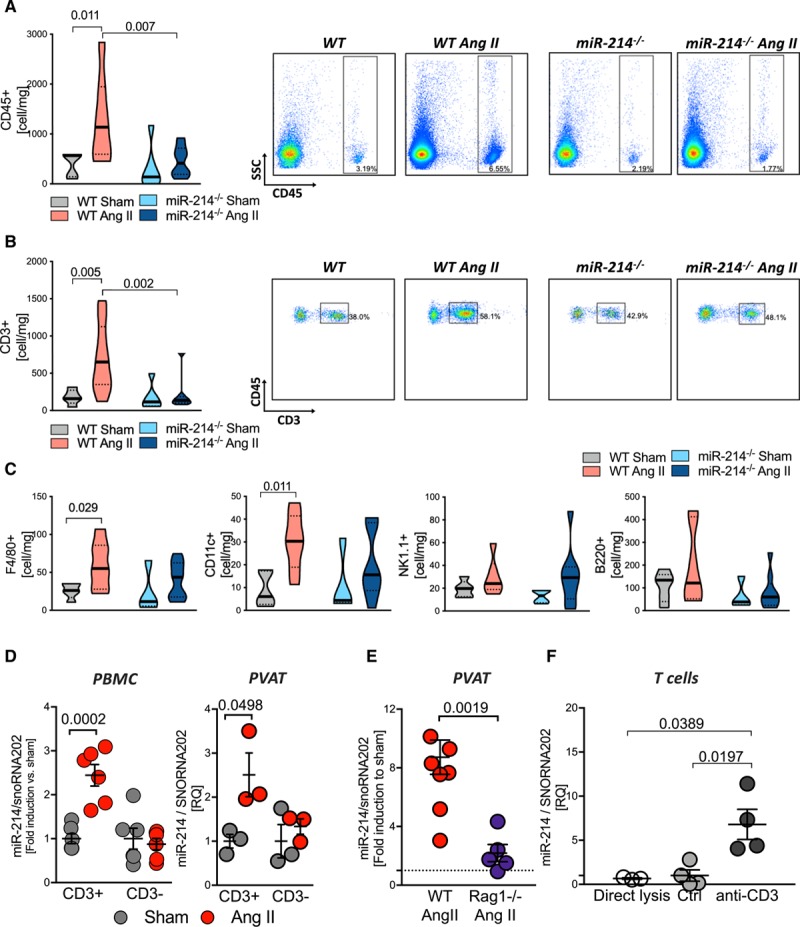
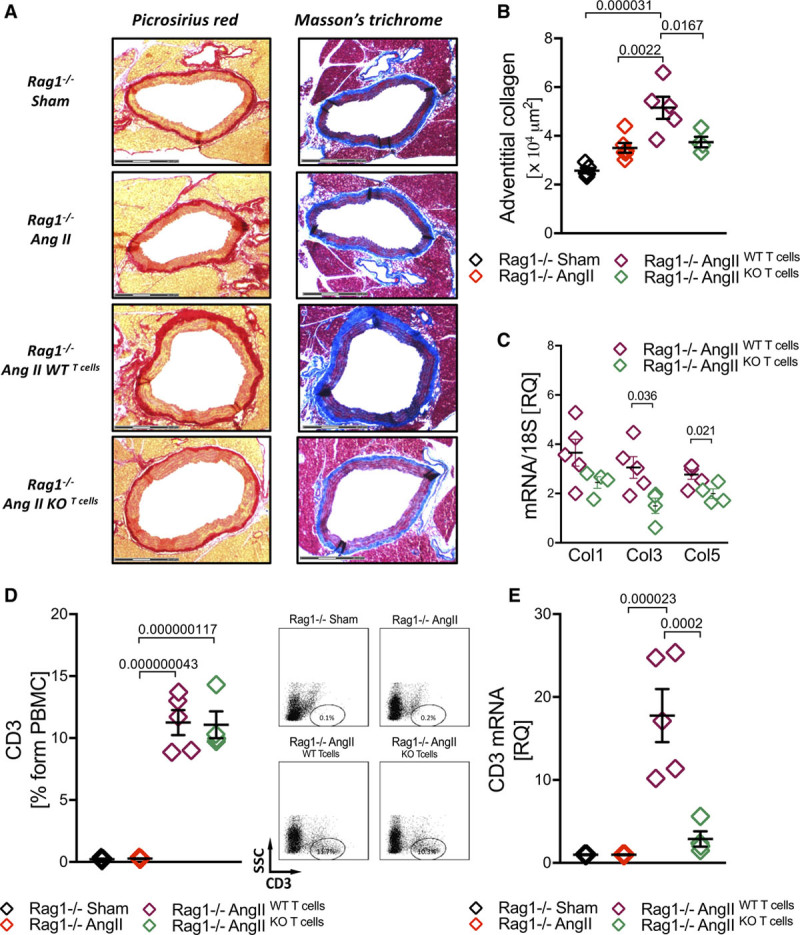
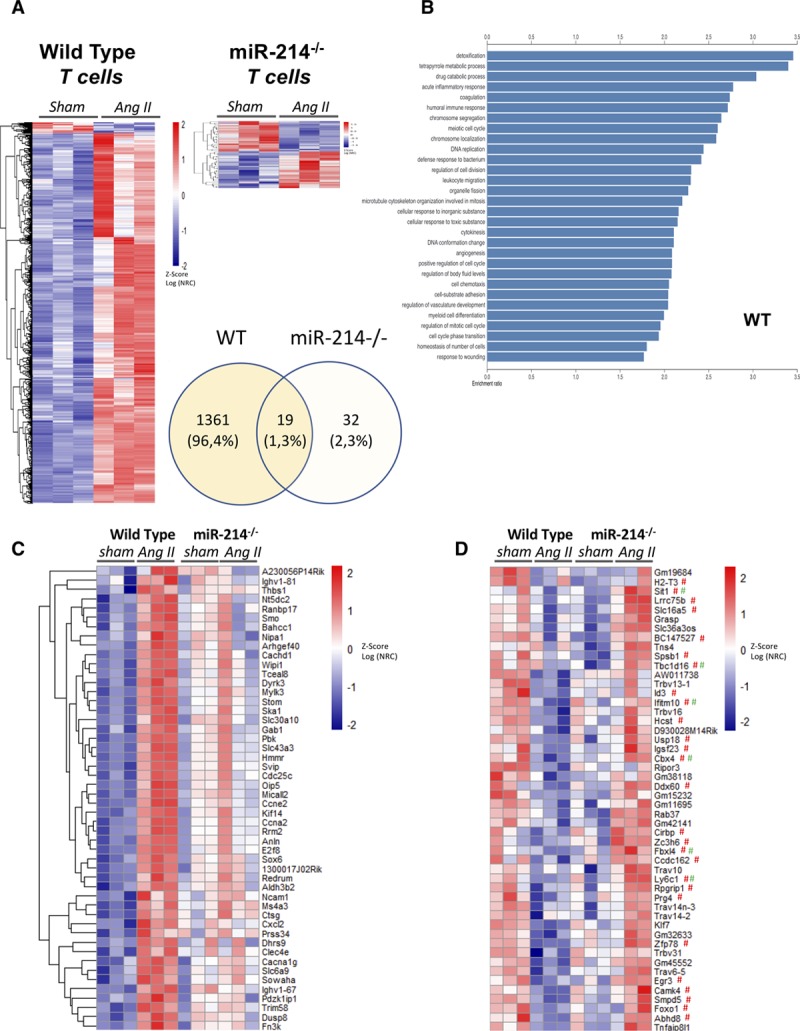
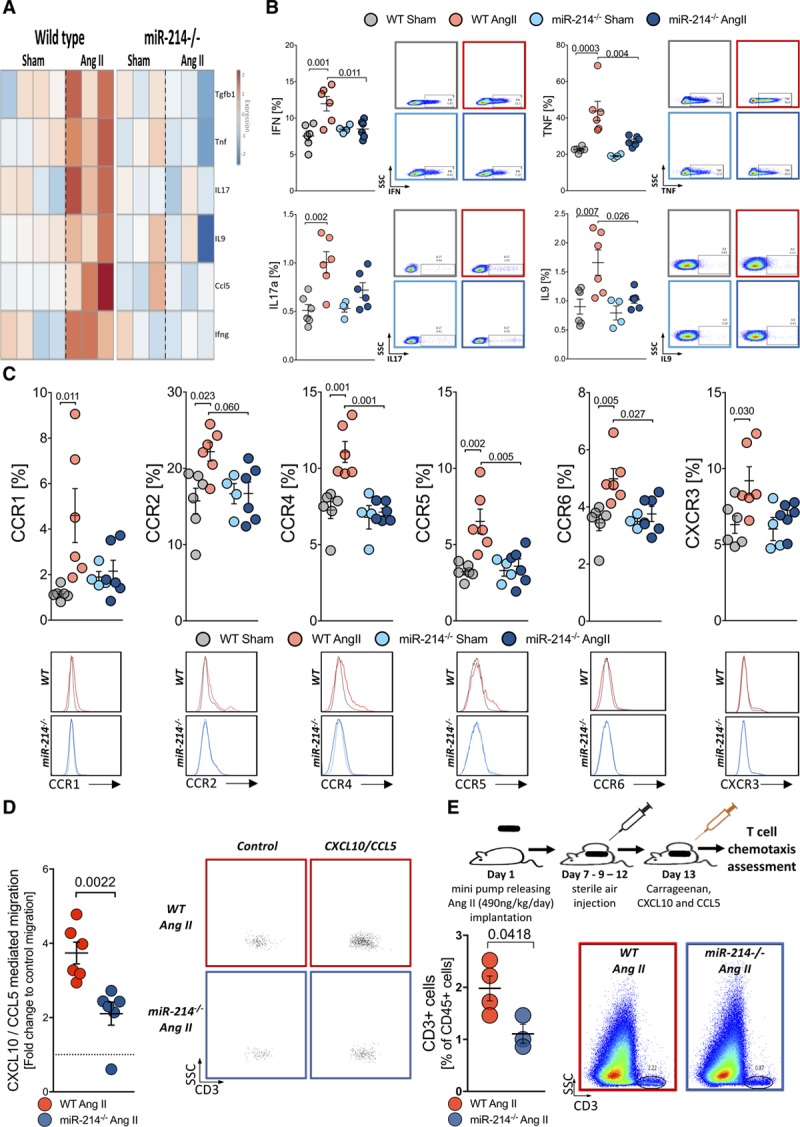
Methods and results: Out of 381 miRs screened in the perivascular tissues in response to Ang II (angiotensin II)-mediated hypertension, miR-214 showed the highest induction (8-fold, P=0.0001). MiR-214 induction was pronounced in perivascular and circulating T cells, but not in perivascular adipose tissue adipocytes. Global deletion of miR-214-/- prevented Ang II-induced periaortic fibrosis, Col1a1, Col3a1, Col5a1, and Tgfb1 expression, hydroxyproline accumulation, and vascular stiffening, without difference in blood pressure. Mechanistic studies revealed that miR-214-/- mice were protected against endothelial dysfunction, oxidative stress, and increased Nox2, all of which were induced by Ang II in WT mice. Ang II-induced recruitment of T cells into perivascular adipose tissue was abolished in miR-214-/- mice. Adoptive transfer of miR-214-/- T cells into RAG1-/- mice resulted in reduced perivascular fibrosis compared with the effect of WT T cells. Ang II induced hypertension caused significant change in the expression of 1380 T cell genes in WT, but only 51 in miR-214-/-. T cell activation, proliferation and chemotaxis pathways were differentially affected. MiR-214-/- prevented Ang II-induction of profibrotic T cell cytokines (IL-17, TNF-α, IL-9, and IFN-γ) and chemokine receptors (CCR1, CCR2, CCR4, CCR5, CCR6, and CXCR3). This manifested in reduced in vitro and in vivo T cell chemotaxis resulting in attenuation of profibrotic perivascular inflammation. Translationally, we show that miR-214 is increased in plasma of patients with hypertension and is directly correlated to pulse wave velocity as a measure of vascular stiffness.

Conclusions: T-cell-derived miR-214 controls pathological perivascular fibrosis in hypertension mediated by T cell recruitment and local profibrotic cytokine release.

Keywords: blood pressure; collagen; fibrosis; hypertension; inflammation.


Figures

Figure 1.
Figure 1.
MiR-214 is increased in the vasculature and immune cells in Ang II (angiotensin II)-induced hypertension. A, Principal component analysis of miRs in perivascular adipose tissue (PVAT; top) and volcano plot (bottom) in sham and Ang II-treated mice. B, Heatmap presenting z-scores calculated from individual miR −ΔCt values of all miRs significantly altered (t-test FDR adj P<0.05; n=5–6). C, Levels of miR-214/199 cluster (top) and pri-miR-214 (bottom) in PVAT (n=4–9). D, In situ hybridization of miR-214 in the vascular wall. Scale bar=300 and 150 μm. E, Levels of miR-214 in isolated PVAT, vessel wall layers (n=3 replicates of 3 pulled mice—9 mice/group), kidney, and selected immune organs (n=3–6). F, Levels of miR-214 and pri-miR-214 in PVAT of mice treated with placebo (PBO) or hydralazine/hydrocholrothiazide (Hyd/HCT; n=6/group). Data presented as mean±SEM; t-test with FDR correction (C, P values adjusted for 4 comparisons; miR clusters; E, P values adjusted for 8 comparisons; various organs) or by 2-way ANOVA (for miR-214 level; PAngII×Drug=3.7×10⁻⁶, PAngII=4.3×10⁻⁷, PDrug=1.4×10⁻⁵; for pri-miR-214 level; PAngII×Drug=0.018, PAngII=1.2×10⁻³, PDrug=0.12) with Tukey multiple comparisons test (F; P values adjusted for 6 comparisons).
Figure 2.
Figure 2.
Pivotal role of miR-214 in the regulation of perivascular fibrosis in Ang II (angiotensin II)-dependent hypertension. A, Tail-cuff BP in sham and Ang II infused miR-214−/− and WT littermates (n=9/group). B, Systolic BP measured by telemetry at baseline and during Ang II infusion (average, left; example readings, right; n=5). C, Perivascular collagen accumulation in picrosirius red (top) and Masson trichrome (bottom) staining (representative of n=9; scale bar=300 μm). D, Quantitative analysis of perivascular collagen deposition in Masson trichrome (n=9/group). E, Collagen 1, 3, and 5 mRNA in miR-214−/− and WT littermates infused with buffer or Ang II (n=11/group). F, Aortic collagen quantification by hydroxyproline assay (n=7 in Sham and n=9 in Ang II). Data presented as mean±SEM; repeated measures 2-way ANOVA (A and B), Kruskal-Wallis test with FDR correction (D and F; P values adjusted for 6 comparisons) or 2-way ANOVA with Tukey test (E; P values adjusted for 6 comparisons). Overall P values for repeated measures 2-way ANOVA; A (PTime=0.0051, PGroup=1.8×10⁻⁸, PTime×Group=0.1378); B (PGroup=0.06, PTime=2.6×10⁻⁷, PGroup×Time=0.83); for 2-way ANOVA; E, for Col1a1 (PAngII×Genotype=0.003, PAngII=1.3×10⁻⁵, PGenotype=0.0035), Col3a1 (PAngII×Genotype=0.037, PAngII=0.0034, PGenotype=0.033) Col5a1 (PAngII×Genotype=0.028, PAngII=0.0053, PGenotype=0.042), for Kruskal-Wallis; D (P=0.0003) and F (P=0.0006).
Figure 3.
Figure 3.
Role of miR-214 in the regulation of vascular stiffening in mouse and human hypertension. A, Thoracic aorta stiffness studied by pressure myography (n=5–8). B, Elastic modulus of adventitial stiffness measured by atomic force microscopy (right) with representative force-indentation curves (left; n=5–6/group). C, Circulating miR-214 serum levels in normotensive (Ctr, n=49) and patients with hypertension (HTN, n=51). D, Correlation between plasma miR-214 levels and pulse wave velocity (PWV) in humans with and without hypertension (n=100). E, TGF-β (transforming growth factor β) and fibronectin mRNA expression in control and hypertensive miR-214−/− and WT mice (n=4–9/group). F, Protein level of TGF-β and fibronectin in aortas studied by WB (n=5–9). Data presented as mean±SEM repeated measures 2-way ANOVA with Bonferroni correction (A), Kruskal-Wallis test with FDR correction (B; P-adjusted for 6 comparisons) or 2-way ANOVA with Tukey test (E and F; P values adjusted for 6 comparisons) or t-test (C). Spearman rank test was used to assess correlations (D). Overall P values for 2-way ANOVA; A (PAngII=1.8×10⁻⁵, PGenotype=0.042), PAngII×Genotype=0.097), E for Tgfb1 (PAngII×Genotype=0.0059, PAngII=0.0031, PGenotype=0.225), FN1 (PAngII=1.2×10⁵, PGenotype=0.266, PAngII×Genotype=0.218); F for TGF-β (PAngII×Genotype=0.0034, PAngII=5.1×10⁻⁷, PGenotype=0.0087), for FN1 (PAngII=0.0015, PGenotype=0.243, PAngII×Genotype=0.589) and Kruskal Wallis B (P=0.0368).
Figure 4.
Figure 4.
Essential role of miR-214 in endothelial dysfunction and vascular oxidative stress in hypertension. A, Relationship between plasma miR-214 levels and endothelial function (flow mediated dilatation [FMD]) or nonendothelium-dependent relaxations to nitroglycerin (NMD) in humans (n=100). B, Isometric tension studies of endothelium dependent (acetylcholine; ACh) and independent (sodium nitroprusside [SNP]) vasorelaxations (n=5–7/group) using wire myography in sham buffer and Ang II (angiotensin II) infused WT and miR-214−/− mice. C, eNOS (endothelial nitric oxide synthase) protein level in mouse aortas (Western blotting; n=9–12/group). D, Aortic superoxide production measured by lucigenin (5 μM) enhanced chemiluminescence (n=7–9/group). E, Aortic Nox2 and Nox4 mRNA expression (n=5/group) and (F) protein levels in aortas of sham and Ang II infused miR-214−/− and WT mice (n=9–12/group). Data presented as mean±SEM and analyzed by Spearman rank correlation test (A), repeated measures 2-way ANOVA with Bonferroni correction (B) or 2-way ANOVA with Tukey post hoc test (C–F; P values adjusted for 6 comparisons). Overall P values for repeated measures 2-way ANOVA; B for Ach (PResponse=0.0009, PGroup=0.044, PResponse×Group=0.016) and SNP (PResponse=04.1×10⁷, PGroup=0.049, PResponse×Group=0.217). Two-way ANOVA; C (PAngII=0.949, PGenotype=0.862, PAngII×Genotype=0.235); D (PAngII×Genotype=0.061, PAngII=0.0042, PGenotype=0.051); E for Nox2 (PAngII×Genotype=0.0062, PAngII=0.193, PGenotype=0.203) and Nox4 (PAngII×Genotype=0.331, PAngII=0.002, PGenotype=0.005); F for Nox2 (PAngII=0.0096, PGenotype=0.683, PAngII×Genotype=0.116) and Nox4 (PAngII=0.0093, PGenotype=0.924, PAngII×Genotype=0.109).
Figure 5.
Figure 5.
Crucial role of miR-214 in regulation of perivascular inflammation in hypertension. A, Total number of leukocytes and T cells (B) with representative density plots (n=6–9/group). C, Number of perivascular macrophages (F4/80+), dendritic cells (CD11c+), B cells (B220+), and NK cells (NK1.1+) per mg of tissue, studied by flow cytometry (n=5–7/group). Data presented on volcano plots depicting median (__) and quartiles (….). D, miR-214 induction in T cells (CD3+) and remaining leukocytes (CD3−) in Ang II hypertension measured in cells from peripheral blood (left, PBMC n=5–6/group) and from perivascular adipose tissue (PVAT; right, n=3/group of 3 pulled mice). E, MiR-214 level in PVAT of WT and RAG1−/− animals (n=5–7/group). F, miR-214 in quiescent (direct lysis; control mAb) and anti-CD3 mAb activated T cells (n=3–4/group). Data presented as mean±SEM and analyzed by Kruskal-Wallis test (A–C), 2-way ANOVA with Tukey post hoc test (D; P values adjusted for 6 comparisons), t-test (E), and by Kruskal-Wallis test with FDR (F; P values adjusted for 3 comparisons). Overall P values for Kruskal-Wallis; A (P=0.017), B (P=0.011), C (P=0.06), D (P=0.05), and F (0.0001); 2-way ANOVA; D for PBMC (PCD3×AngII=0.0006, PAngII=0.0026, PCD3=0.0006) and PVAT (PAngII=0.024, PCD3=0.115, PCD3×AngII=0.115).
Figure 6.
Figure 6.
T cell miR-214 mediates perivascular fibrosis and profibrotic T cell accumulation in PVAT (perivascular adipose tissue) in Ang II (angiotensin II)- induced hypertension. A, Vascular collagen accumulation in response to Ang II-hypertension assessed using picrosirius red (left) and Massons trichrome (right; scale bar=300 µm, representative of n=4–5/group) with quantification of adventitial collagen (B) in RAG1−/− mice and upon adoptive transfer of WT and miR-214−/− T cells (n=4–5/group). C, Ang II-dependent induction of Col 1, 3, and 5 mRNA in aortas of RAG1−/− transferred with WT or miR-214−/− T cells (n=4–5). D, Levels of circulating T cells in RAG1−/− mice and upon adoptive transfer of WT or miR-214−/− T cells (left) with representative dot plots (right; n=4–5/group). E, CD3 mRNA in PVAT of RAG1−/− mice and upon adoptive transfer of WT or miR-214−/− T cells (n=4–5/group). Data presented as mean±SEM and analyzed by 1-way ANOVA with Tukey post hoc t test (B, D, E; P values adjusted for 6 comparisons), t-test with FDR (C; P values adjusted for 3 comparisons). Overall P values for 1-way ANOVA; B (P=6.3×10⁻⁵), D (P=1.5×10⁻⁸), and E (P=7.8×10⁻⁶).
Figure 7.
Figure 7.
Essential role of miR-214 in T cell responses in Ang II (angiotensin II)-induced hypertension. A, Genes with absolute log2FC>1, significantly (FDR adj P<0.05 calculated using Wald test in DESeq2) changed in T cells following 2-week AngII infusion in vivo in WT (left) and mir214−/− (right) mice (n=3). Venn diagram indicates total numbers of genes changed in each strain of mice in response to Ang II. B, Top 30 pathways significantly upregulated in WT T cells following 2-weeks AngII infusion in vivo in WT mice. C, Top 50 genes (based on interaction term estimate) preferentially induced by Ang II infusion in WT when compared with mir214−/− mice (FDR adj Pinteraction <0.05 for all presented). D, Top 50 genes preferentially repressed by AngII infusion in WT as compared with miR-214−/− mice. Predicted targets of miR-214 for miRWalk (# red) and TargetScan 7.1 (# green). Data on heat maps are presented as z-scores of log transformed, normalized gene read counts (Log NRC) calculated with DESeq2.
Figure 8.
Figure 8.
MiR-214 modulates T cell proinflammatory cytokine production, chemokine receptors expression and T cells migration in Ang II (angiotensin II)-induced hypertension. A, Heatmap of selected profibrotic cytokine mRNA in T cells upon Ang II-induced hypertension in WT (left) and miR-214−/− (right) mice. Gene expression was studied upon ex vivo activation by anti-CD3 and anti-CD28 for 24 h (n=3–4/group) and presented as fold change, relative to average of sham. B, Cytokine production by T cells in sham buffer and Ang II infused WT and miR-214−/− mice (n=4–6/group) upon 6-h stimulation with PMA studied by flow cytometry. C, T cell chemokine surface receptors in sham and Ang II-infused WT and miR-214−/− mice studied by flow cytometry with representative histograms (n=4–6/group). D, In vitro chemotaxis of T cells obtained from hypertensive animals toward CXCL10 and CCL5 in Boyden chambers (n=6/group) with representative dot plots reflecting control and chemokine induced migration. E, Air pouch model of T cell chemotaxis (top) showing T cell recruitment toward membranes surrounding air-pouch filled with carrageenan and recombinant proteins (CXCL10 and CCL5) in hypertensive WT and miR-214−/− mice with representative density plots (n=3–4/group). Data presented as mean±SEM and analyzed by t-test with FDR (All genes show FDR adj P<0.05 in WT but not in miR-214−/−), Mann-Whitney U test (D) or t-test (E). Two-way ANOVA with Tukey (B and C; P values adjusted for 6 comparisons). Overall P values for 2-way ANOVA; B for IFN (PAngII×Genotype=0.0073, PAngII=0.0068, PGenotype=0.0988), TNF (PAngII×Genotype=0.0475, PAngII=0.0001, PGenotype=0.0042), IL17a (PAngII=0.0007, PGenotype=0.1316, PAngII×Genotype=0.0814) and IL9 (PAngII=0.0045, PGenotype=0.0245, PAngII×Genotype=0.0994); C for CCR1 (PAngII×Genotype=0.0413, PAngII=0.0198, PGenotype=0.2508), CCR2 (PAngII×Genotype=0.0467, PAngII=0.0452, PGenotype=0.1193), CCR4 (PAngII×Genotype=0.0081, PAngII=0.0022, PGenotype=0.0013), CCR5 (PAngII× Genotype=0.0142, PAngII=0.0047, PGenotype=0.0186), CCR6 (PAngII×Genotype=0.0445, PAngII=0.0066, PGenotype=0.0596), CXCR3 (PAngII=0.0167, PGenotype=0.0771, PAngII×Genotype=0.163).

Comment in

References

    1. Collaborators GBDRF. Global, regional, and national comparative risk assessment of 79 behavioural, environmental and occupational, and metabolic risks or clusters of risks, 1990-2015: a systematic analysis for the global burden of disease study 2015. Lancet. 2016;388:1659–1724. 10.1016/S0140-6736(16)31679-8. - PMC - PubMed
    1. Nilsson PM, Boutouyrie P, Laurent S. Vascular aging: a tale of EVA and ADAM in cardiovascular risk assessment and prevention. Hypertension. 2009;54:3–10. 10.1161/HYPERTENSIONAHA.109.129114. - PubMed
    1. Guzik TJ, Touyz RM. Oxidative stress, inflammation, and vascular aging in hypertension. Hypertension. 2017;70:660–667. 10.1161/HYPERTENSIONAHA.117.07802. - PubMed
    1. Rios FJ, Zou Z-G, Harvey AP, Harvey KY, Nosalski R, Anyfanti P, Camargo LL, Lacchini S, Ryazanov AG, Ryazanova L, et al. Chanzyme trpm7 protects against cardiovascular inflammation and fibrosis. Cardiovasc Res. 2020;116:721–735. doi: 10.1093/cvr/cvz164. - PMC - PubMed
    1. Touyz RM, Alves-Lopes R, Rios FJ, Camargo LL, Anagnostopoulou A, Arner A, Montezano AC. Vascular smooth muscle contraction in hypertension. Cardiovasc Res. 2018;114:529–539. 10.1093/cvr/cvy023. - PMC - PubMed

Publication types

MeSH terms