. 2020 Feb 17;18(1):28.
doi: 10.1186/s12951-020-00592-8.

Metabolomic analyses of the bio-corona formed on TiO2 nanoparticles incubated with plant leaf tissues

Affiliations

Metabolomic analyses of the bio-corona formed on TiO2 nanoparticles incubated with plant leaf tissues

Jasmina Kurepa et al. J Nanobiotechnology. .

Abstract

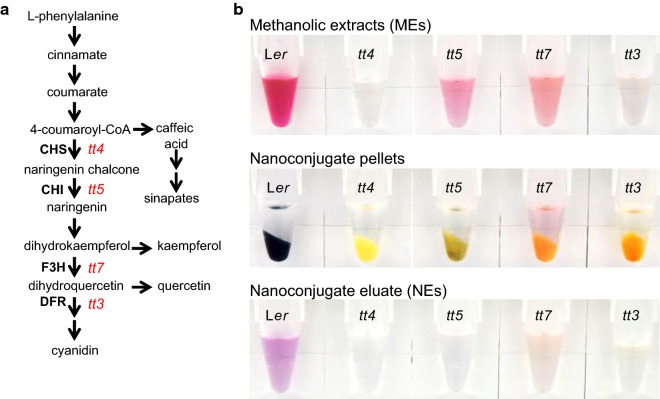
Background: The surface of a nanoparticle adsorbs molecules from its surroundings with a specific affinity determined by the chemical and physical properties of the nanomaterial. When a nanoparticle is exposed to a biological system, the adsorbed molecules form a dynamic and specific surface layer called a bio-corona. The present study aimed to identify the metabolites that form the bio-corona around anatase TiO2 nanoparticles incubated with leaves of the model plant Arabidopsis thaliana.

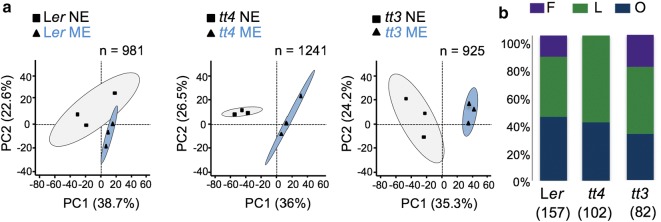
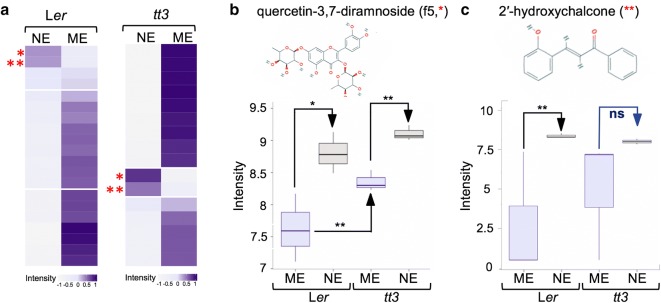
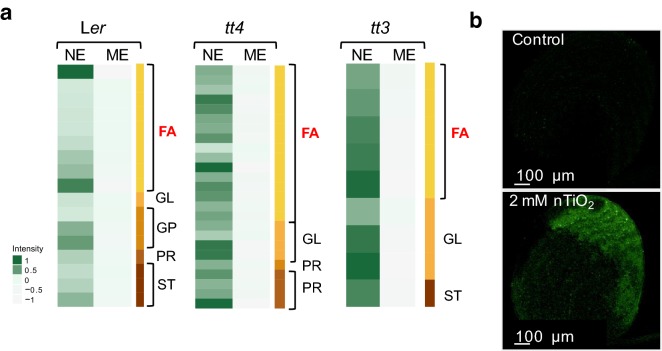
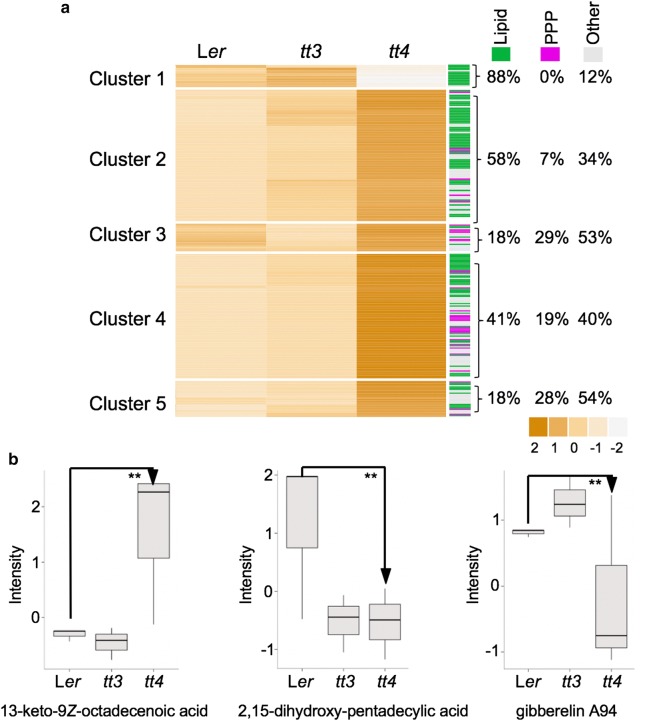
Results: We used an untargeted metabolomics approach and compared the metabolites isolated from wild-type plants with plants deficient in a class of polyphenolic compounds called flavonoids.

Conclusions: These analyses showed that TiO2 nanoparticle coronas are enriched for flavonoids and lipids and that these metabolite classes compete with each other for binding the nanoparticle surface.

Keywords: Arabidopsis; Flavonoids; Lipids; Titanium dioxide nanoparticles; Transparent testa (tt) mutants.


Conflict of interest statement

The authors declare that they have no competing interests.

Figures

Fig. 1
Fig. 1
Preparation of methanolic (MEs) and nanoparticle-mediated extracts (NEs) from wild type and tt mutant lines. a Simplified scheme of the phenylpropanoid pathway in Arabidopsis. The positions of the tt mutations used in this study are marked in red and the abbreviated names of the enzymes compromised are boldfaced. CHS, Chalcone synthase; CHI, chalcone isomerase; F3H, flavanone 3-hydroxylase; DFR, dihydroflavonol reductase. b Visual characteristics of MEs, nanoconjugates and NEs from different plant lines
Fig. 2
Fig. 2
Comparison of methanolic (MEs) with nanoconjugate (NEs) extracts from individual lines. a PCA of untargeted metabolomics data demonstrating the separation of MEs and NEs from the wild type Ler, and from the mutants tt3 and tt4. Principle component (PC) 1 and PC2 are presented. Three biological replicates were used for these analyses. The number of metabolites analyzed (n) is noted. b Distribution of metabolites with significant loading in PC1 into chemical classes. The number below the plant line identifier denotes the number of endogenous metabolites with significant loading that were sorted into chemical classes. F, Flavonoids; L, Lipids; O, Other
Fig. 3
Fig. 3
Comparative analyses of flavonoids in extracts from the wild type and the tt3 mutant. a The heatmaps were constructed from the average normalized intensity value of flavonoids extracted by the PCA analyses from the full data set. Hierarchical clustering analysis was performed on 20 (Ler) and 16 (tt3) metabolites with significant factor loadings in PC1 (p = 0.05) using Manhattan correlation as the distance measure. The color intensity scale is positioned below the heatmap. Starts denote: *, quercetin-3,7-dirhamnoside (f5) and **, 2′-hydroxychalcone. NE, nanoconjugate eluate; ME, methanolic extract. b, c Box plots of log10 metabolite intensity of f5 (b) and 2ʹ-hydroxychalcone (c) in the wild type (Ler) and tt3 extracts. The significance between means (n = 3) was calculated using Students t-test. Error bars represent mean standard deviation. *p < 0.05, **p < 0.005, NS, not significant
Fig. 4
Fig. 4
Comparative analyses of lipids in extracts from the wild type and tt mutants. a The heatmaps were constructed from the average normalized intensity values of lipids shown to be significantly different between NEs and MEs by PCA analyses. The color intensity scale is on the left-hand side of the heatmaps. Different lipid subclasses are labeled with different colors in the legend positioned on the right-hand side. FA, fatty acyls; GL, glycerolipids; GP, glycerophospholipids; SP, sphingolipids; ST, sterol lipids; PR, prenol lipids. b Confocal microscopic analysis of TiO2 NP-treated wild-type seedlings reveals membrane damage. Z-stack projections (10 slices, 25 µM thick) of SYTOX green-stained cotyledon of a 4-day-old seedling treated with 1.9 mM TiO2 NP for 4 h is shown. Green fluorescence signifies membrane permeabilization that allows the dye to enter the cell, bind DNA and emit at 510–560 nm when excited by a wavelength of 488 nm
Fig. 5
Fig. 5
Comparative analyses of NEs from the wild type and tt mutants. a Each of the heatmap columns represents the normalized intensity averaged across the NE samples within each group (n = 3, each sample was a pool of tissues from separate plants). Hierarchical clustering analysis was performed on metabolites with significant factor loadings in PC1 (p = 0.005) using Manhattan correlation as the distance measure. Percentage of lipids (green), phenylpropanoids (PPP; purple) and other compounds (gray) that form each cluster is noted on the right-hand side. The color intensity scale is positioned below the heatmap. b Boxplot analyses of ME levels of select lipids that have been enriched in the NEs of tt4. The significance between means (n = 3) was calculated using Students t-test. **p < 0.01

References

    1. Chen X, Mao SS. Titanium dioxide nanomaterials: synthesis, properties, modifications, and applications. Chem Rev. 2007;107:2891–2959. doi: 10.1021/cr0500535. - DOI - PubMed
    1. Tsagkaris AS, Tzegkas SG, Danezis GP. Nanomaterials in food packaging: state of the art and analysis. J Food Sci Technol. 2018;55:2862–2870. doi: 10.1007/s13197-018-3266-z. - DOI - PMC - PubMed
    1. Weir A, Westerhoff P, Fabricius L, von Goetz N. Titanium dioxide nanoparticles in food and personal care products. Environ Sci Technol. 2012;46:2242–2250. doi: 10.1021/es204168d. - DOI - PMC - PubMed
    1. Shi H, Magaye R, Castranova V, Zhao J. Titanium dioxide nanoparticles: a review of current toxicological data. Part Fibre Toxicol. 2013;10:15. doi: 10.1186/1743-8977-10-15. - DOI - PMC - PubMed
    1. Raza M, Bachinger A, Zahn N, Kickelbick G. Interaction and UV-stability of various organic capping agents on the surface of anatase nanoparticles. Materials. 2014;7:2890. doi: 10.3390/ma7042890. - DOI - PMC - PubMed

LinkOut - more resources