. 2020 Feb 17;11(1):928.
doi: 10.1038/s41467-020-14590-9.

FOXM1 regulates leukemia stem cell quiescence and survival in MLL-rearranged AML

Affiliations

FOXM1 regulates leukemia stem cell quiescence and survival in MLL-rearranged AML

Yue Sheng et al. Nat Commun. .

Abstract

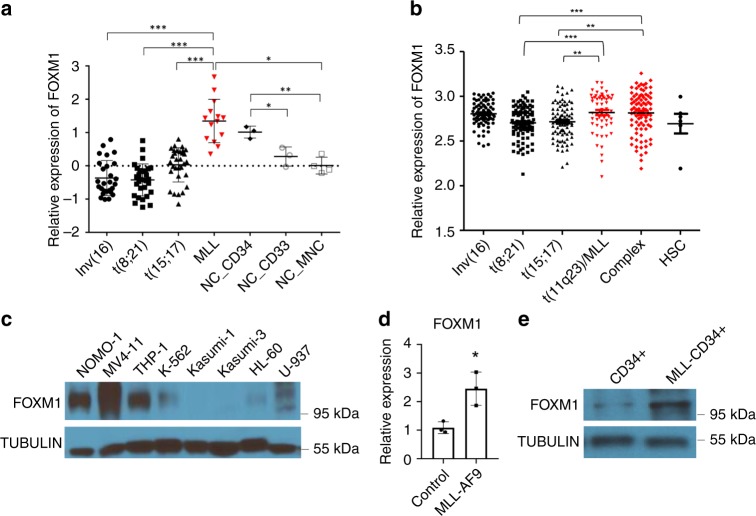
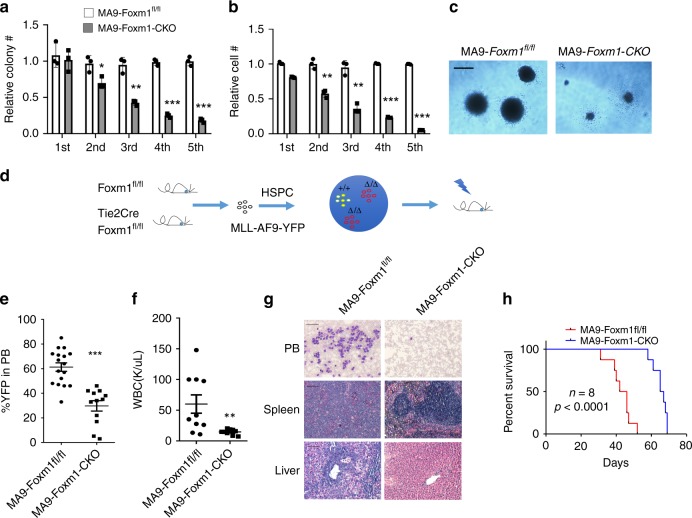
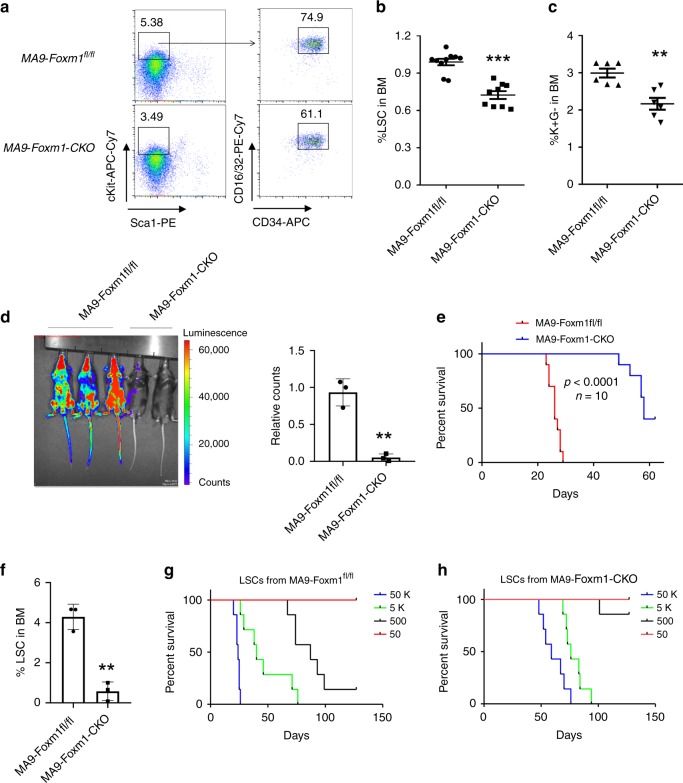
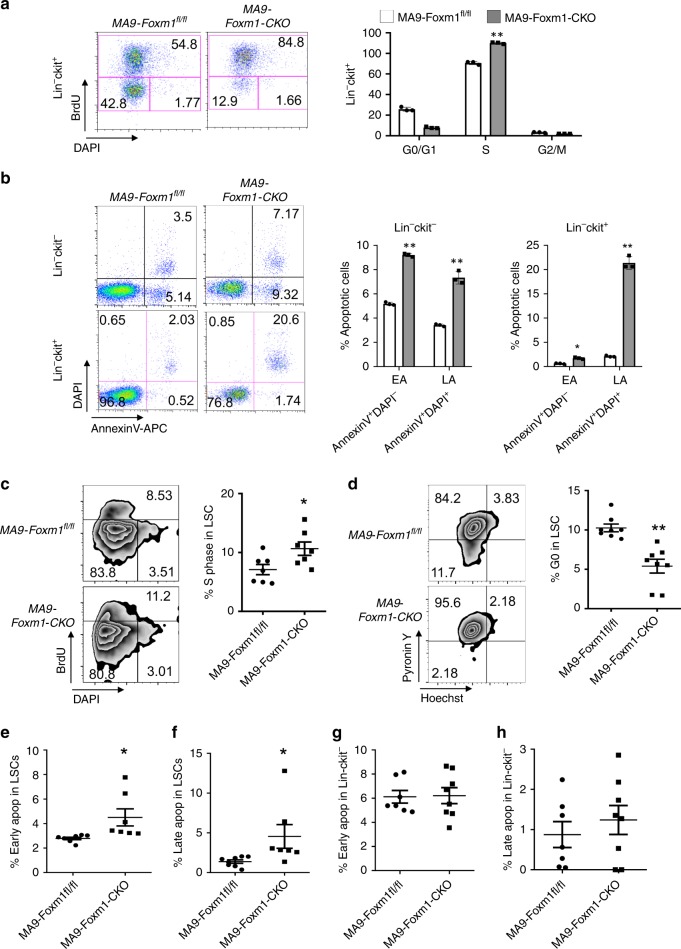
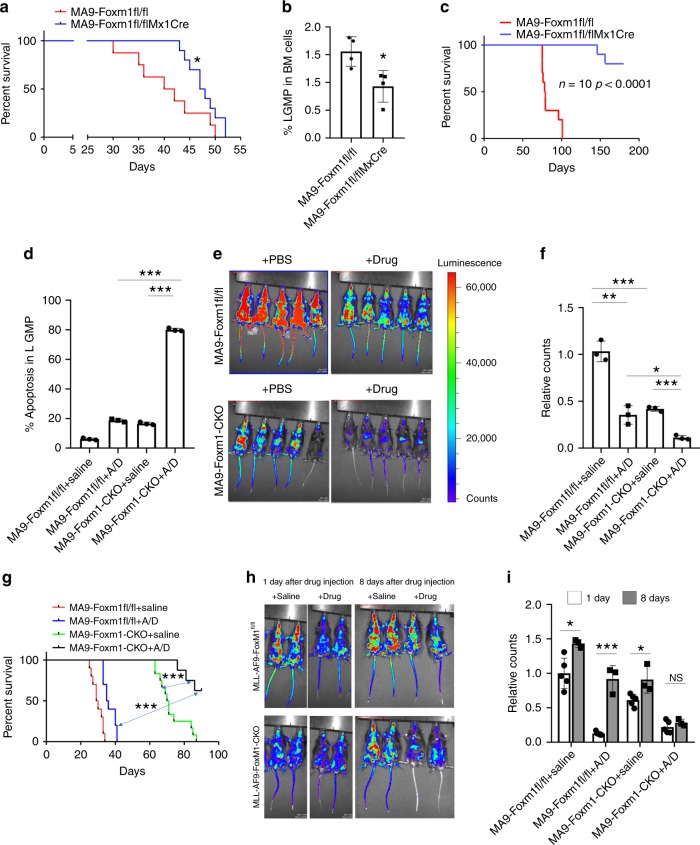
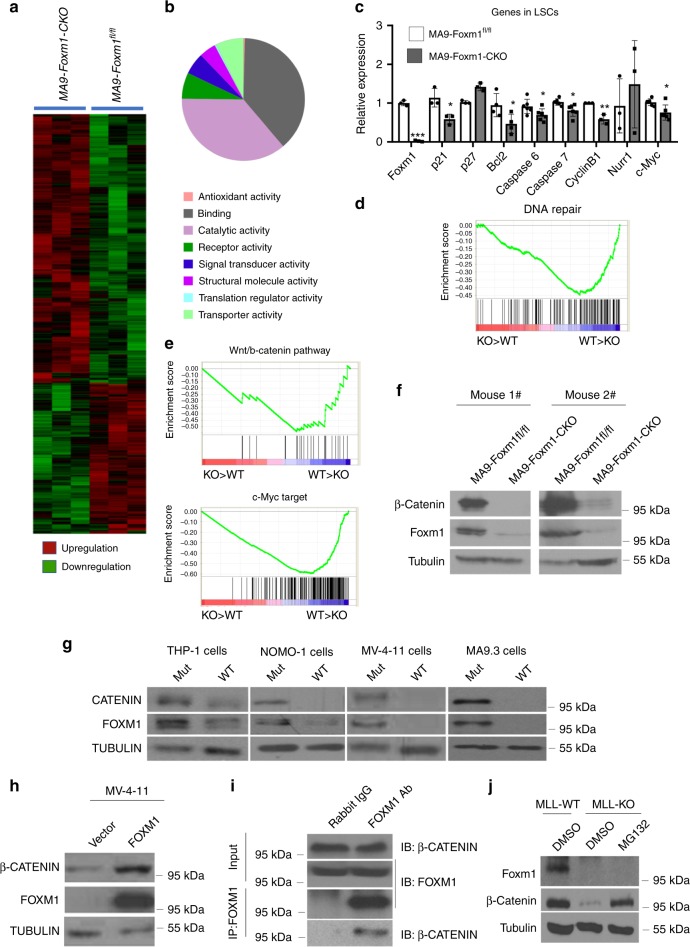
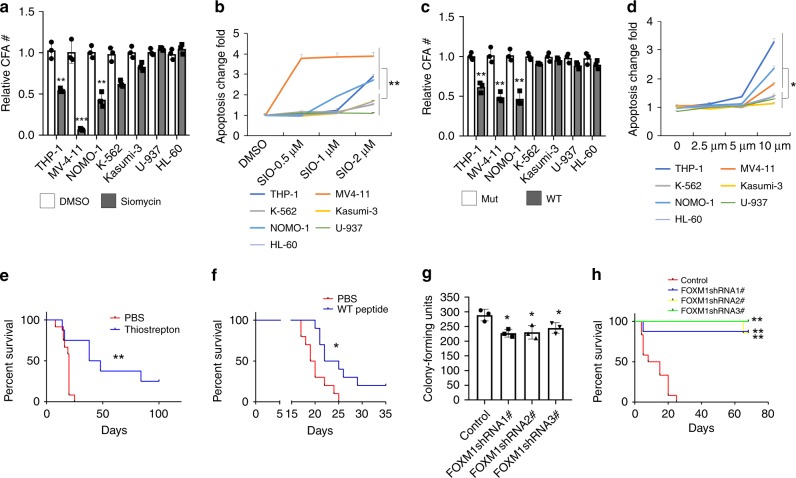
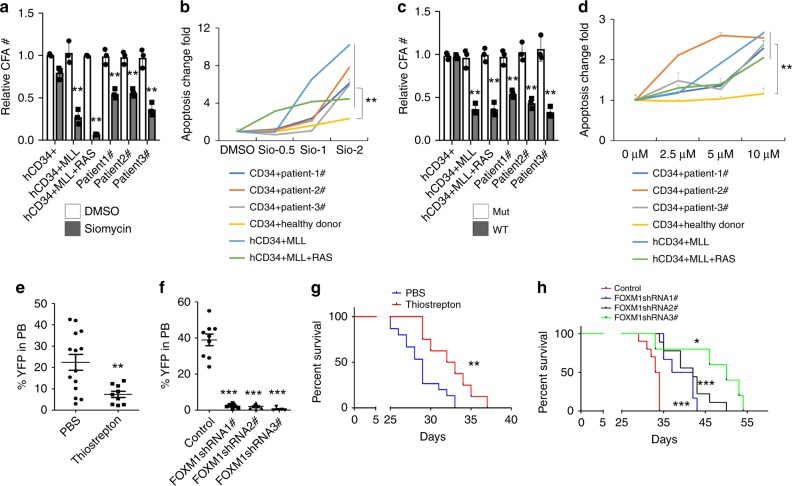
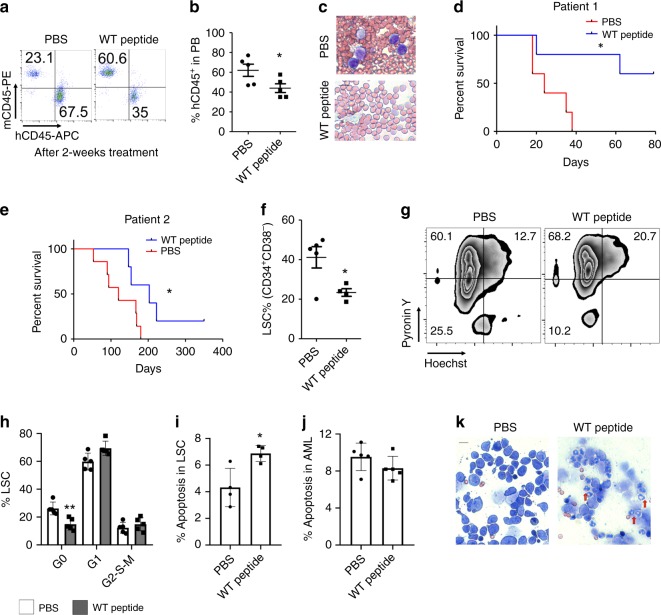
FOXM1, a known transcription factor, promotes cell proliferation in a variety of cancer cells. Here we show that Foxm1 is required for survival, quiescence and self-renewal of MLL-AF9 (MA9)-transformed leukemia stem cells (LSCs) in vivo. Mechanistically, Foxm1 upregulation activates the Wnt/β-catenin signaling pathways by directly binding to β-catenin and stabilizing β-catenin protein through inhibiting its degradation, thereby preserving LSC quiescence, and promoting LSC self-renewal in MLL-rearranged AML. More importantly, inhibition of FOXM1 markedly suppresses leukemogenic potential and induces apoptosis of primary LSCs from MLL-rearranged AML patients in vitro and in vivo in xenograft mice. Thus, our study shows a critical role and mechanisms of Foxm1 in MA9-LSCs, and indicates that FOXM1 is a potential therapeutic target for selectively eliminating LSCs in MLL-rearranged AML.


Conflict of interest statement

The authors declare no competing interests

Figures

Fig. 1
Fig. 1. FOXM1 is upregulated in MLL-r leukemia cells.
a, b Comparison of FOXM1 expression among human primary AML cases with MLL rearrangements t(11q23) (MLL) and those without MLL rearrangements (non-MLL) AML cases. t(8;21), t(15;17), and inv(16) are AML subtypes. MLL leukemia includes MLL-AF4 and MLL-AF9. CD34+ HSPCs, CD33+ myeloid progenitors, and mononuclear cells (MNC) from healthy donors were used as controls. The expression values were log2-transformed and mean centered. The expression data (a) and (b) were described, respectively, in previous study, and in other datasets of AML patients. c Western Blot analysis of FOXM1 expression in human myeloid leukemia cells with different fusion genes. NOMO-1, MV4-11 and THP-1 harbored the MLL rearrangements translocation, which had relatively higher FOXM1 protein level compared to other non-MLL rearrangements cells. d, e FOXM1 expression in human CD34+ cells, which were isolated from cord blood, infected with control plasmid or MLL-AF9-YFP, as determined by quantitative(q)RT-PCR (d) or Western Blot analysis (e). The average expression level of FOXM1 in the CD34+ cells with control plasmid was set as 1 for qRT-PCR. TUBULIN served as the inner control for WB assay. *p < 0.05, **p < 0.01, ***p < 0.001, mean ± s.d., t-test. Source data are provided as a Source Data file.
Fig. 2
Fig. 2. Foxm1 loss delays the development of AML induced by MA9 in vivo.
a The relative number of colony-forming units. b The relative number of cells. c Representative images of the colonies for the 5th round of plating are displayed. The MA9 infected Foxm1 CKO or control (Foxm1fl/fl) LinBM cells were resuspended and replated weekly in methocultTM medium containing cytokines, bar = 100 μM. d Schematic diagram for generation of MA9-induced Foxm1fl/fl and Foxm1fl/fl-CKO AML mouse models. e Flow cytometric analysis of engraftment of YFP+ cells from MA9-Foxm1fl/fl or MA9-Foxm1-CKO mice 1-month post-transplantation, n = 17 MA9-Foxm1fl/fl mice or n = 12 MA9-Foxm1-CKO mice. f Complete blood count analysis of white blood cells (WBCs) in MA9-Foxm1fl/fl or MA9-Foxm1-CKO mice 1-month post-transplantation, n = 10 mice for each group. g Wright-Giemsa-stained PB and H&E-stained spleen and liver of the MA9-Foxm1fl/fl or MA9-Foxm1-CKO mice are shown. Bar = 100 μM for PB, bar = 200 μM for spleen and liver. h Kaplan–Meier survival analysis of MA9-Foxm1fl/fl or MA9-Foxm1-CKO leukemic mice, n = 8 mice for each group. *p < 0.05, **p < 0.01, ***p < 0.001, mean ± s.d., t-test or Log-rank (Mantel-Cox) Test for survival curve. Source data are provided as a Source Data file.
Fig. 3
Fig. 3. Foxm1 is critical for the maintenance of MA9-transformed LSCs.
ac Flow cytometric analysis of percentage of LSC (L-GMP: Linc-Kit+Sca1CD34+FcR-ϒ+) or c-Kit+Gr1 in BM cells from MA9-Foxm1fl/fl or MA9-Foxm1-CKO leukemic mice. Gating strategy for L-GMP is shown in (a). Mice were sacrificed and BM cells were harvested for analysis when the mice become moribund, n = 10 MA9-Foxm1fl/fl mice or n = 9 MA9-Foxm1-CKO mice in (b), n = 6 mice for each group in (c) d Leukemia burden of secondary recipient mice reconstituted with MA9-Foxm1fl/fl or MA9-Foxm1-CKO BM cells from the primary recipient mice labeled with Luciferase was determined by in vivo imaging system (IVIS). Relative counts are shown. Mice were administrated substrate Luciferin before images were taken, n = 3 mice for each group. e Kaplan–Meier survival analysis of leukemia maintenance of the secondary recipient mice reconstituted with MA9-Foxm1fl/fl or MA9-Foxm1-CKO BM cells from the primary recipient mice, n = 10 mice for each group. f Flow cytometric analysis of percentage of LSC in the secondary recipient mice reconstituted with MA9-Foxm1fl/fl or MA9-Foxm1-CKO BM cells from the primary recipient mice, n = 3 mice for each group. gh Limiting dilution analysis of LSC frequency in the primary MA9-Foxm1fl/fl (g) or MA9-Foxm1-CKO (h) leukemia mice. 50000, 5000, 500, or 50 L-GMPs sorted from primary MA9-Foxm1fl/fl or MA9-Foxm1-CKO leukemia mice were injected into the recipient mice, n = 7 mice for each group. **p < 0.01; ***p < 0.001, mean ± s.d., t-test or Log-rank (Mantel–Cox) Test for survival curve. Source data are provided as a Source Data file.
Fig. 4
Fig. 4. Foxm1 regulates quiescence and survival of MA9-transformed LSCs.
a Flow cytometric analysis of the cell cycle of LSC-enriched Linc-kit+ population in MA9-Foxm1fl/fl or MA9-Foxm1-CKO cells in vitro. Gating strategy is shown in left panel. Cells were stained with BrdU (determine the S phase) and DAPI (determine the DNA content). b Flow cytometric analysis of the apoptosis of LSC-enriched Linckit+ population and mature myeloid population Linc-Kit in MA9-Foxm1fl/fl or MA9-Foxm1-CKO cells in vitro. Gating strategy is shown in left panel. Cells were stained with AnnexinV and DAPI. AnnexinV+DAPI cells represent early apoptotic cells. AnnexinV+DAPI+ cells represent late apoptotic cells. c Flow cytometric analysis of cell cycle of LSC in MA9-Foxm1fl/fl or MA9-Foxm1-CKO primary mice. Gating strategy is shown in left panel. Cells were stained with BrdU (determine the S phase) and DAPI (determine the DNA content), n = 7 mice for each group. d Flow cytometric analysis of LSC quiescence in MA9-Foxm1fl/fl or MA9-Foxm1-CKO primary mice. Gating strategy is shown in left panel. Cells were stained with DNA Dye Hoechst and RNA Dye PyroninY. Double negative population indicated the G0 phase/quiescence, n = 8 mice for each group. ef Flow cytometry analyzing the early (e) and late (f) apoptosis (apop) of LSC in MA9-Foxm1fl/fl or MA9-Foxm1-CKO primary mice, n = 8 MA9-Foxm1fl/fl mice or n = 7 MA9-Foxm1-CKO mice. gh Flow cytometry analyzing the early (g) and late (h) apoptosis of Lin-cKit- in MA9-Foxm1fl/fl or MA9-Foxm1-CKO primary mice, n = 7 MA9-Foxm1fl/fl mice or n = 8 MA9-Foxm1-CKO mice, *p < 0.05, **p < 0.01, mean ± s.d., t-test. Source data are provided as a Source Data file.
Fig. 5
Fig. 5. Foxm1 loss increases the sensitivity of LSCs to chemotherapeutic drugs.
a Kaplan–Meier survival analysis of the primary recipient mice transplanted with Foxm1fl/fl or Mx1-CreFoxm1f/fl BM cells infected with MLL-AF9. Foxm1 deletion was induced by three doses of PIPC injection given every other days after transplantation, n = 8 MA9-Foxm1fl/fl mice or n = 10 MA9-Foxm1-CKO mice. b Flow cytometric analysis of percentage of LSCs in the primary recipient mice transplanted with Foxm1fl/fl or Mx1-CreFoxm1f/fl BM cells infected with MLL-AF9, n = 4 mice for each group. c Kaplan–Meier survival analysis of the secondary recipient mice reconstituted with MLL-AF9-infected Foxm1fl/fl or Mx1-CreFoxm1f/fl BM cells, which were collected from colonies in methylcellulose medium. Genotype for each colony was confirmed by PCR, n = 10 mice for each group. d Flow cytometric analysis of apoptosis rate in MA9-Foxm1fl/fl or MA9-Foxm1-CKO LSCs from primary recipient mice treated with saline or 0.5 μM cytarabine (Ara-C) and 15 nM doxorubicin (Doxo). ef Leukemia burden of the recipient mice, which were reconstituted with luciferase-labeled MA9-Foxm1fl/fl or MA9-Foxm1-CKO BM cells, and treated with saline or “5 + 3” regimen, was determined by in vivo image system (IVIS) (e). Relative counts are shown in (f). “5 + 3” regimen: 100 mg/kg Ara-C was administered for consecutive 5 days and for the last 3 days, 3 mg/kg doxorubicin was administered. Mice were injected with substrate luciferin before images were taken, n = 3 mice for each group. g Kaplan–Meier survival analysis of the recipient mice reconstituted with MA9-Foxm1fl/fl or MA9-Foxm1-CKO BM cells treated with PBS or “5 + 3” regimen, Ara-C and DOXO (A/D), n = 10 mice for MA9-Foxm1fl/fl + Saline and A/D group, n = 12 mice for MA9-Foxm1-CKO + Saline group or 8 mice for MA9-Foxm1-CKO + A/D group. hi Leukemia burden of the recipient mice was determined by in vivo image system (IVIS) at 1 day or 8 days after treatment (h). Relative counts of leukemia burden in mice are shown (i). The recipients were reconstituted with luciferase-labeled MA9-Foxm1fl/fl or MA9-Foxm1-CKO BM cells, and treated with saline or “5 + 3” regimen, n = 5 mice for 1 day or n = 3 mice for 8 days group, *p < 0.05, **p < 0.01, ***p < 0.001, mean ± s.d., t-test or Log-rank (Mantel–Cox) test for survival curve. Source data are provided as a Source Data file.
Fig. 6
Fig. 6. Molecular pathways underlying the role of Foxm1 in LSCs.
a Heat map of the expression of 546 Foxm1-regulated genes upregulated (red) or downregulated(green) twofold or more (P ≤ 0.05) in LSCs from Foxm1-KO MA9-leukemia mice (MA9-Foxm1-KO-LSCs) relative to LSCs from MA9-leukemia mice (MA9-Foxmfl/fl LSCs). b Pie charts show the distribution of 546 genes which are differentially expressed in Foxm1-deficinet and control LSCs into functional groups. c Quantitative RT-PCR analysis of selected genes in LSCs; results were normalized to those of Actb and are presented relative to those of Foxm1fl/fl control LSCs. de Gene-set-enrichment analysis of selected gene sets (12,000 transcripts) encoding products related to DNA repair pathways (d), the Wnt/β-catenin signaling (e, top) or that are targeted by c-Myc (e, bottom), presented as enrichment score as well as genes “positively correlated” with Foxm1 deficiency (KO > WT) or “negatively correlated” with Foxm1 sufficiency (WT > KO) in MA9-LSCs. d, P < 0.0001; e top, P < 0.001; e bottom; P < 0.001. f Western Blot analysis of Foxm1 and β-catenin expression in primary leukemia cells from MA9-foxm1fl/fl (control) and MA9-Foxm1-CKO mice. g Western Blot analysis of FOXM1 and β-CATENIN expression in human leukemia cells with expression of MLL fusion genes. The cells were treated with 40 μM FOXM1-specific peptide or mutant peptide. h Western Blot analysis of FOXM1 and β-CATENIN expression in MV4-11 human leukemia cells with expression of FOXM1 or control vector. i Co-immunoprecipitation assay of endogenous β-CATENIN and FOXM1 in MV4-11 human leukemia cell lines. j Western Blot analysis of Foxm1 and β-catenin in BM cells from MA9-Foxm1fl/fl and MA9-Foxm1 CKO leukemia mice. The cells were treated with 20 μM MG132 or DMSO for 6 h, *p < 0.05, **p < 0.01, ***p < 0.001, mean ± s.d., t-test. Source data are provided as a Source Data file.
Fig. 7
Fig. 7. Inhibition of FOXM1 suppressed MLL-r-induced leukemogenesis.
a, b Relative colony-forming units (a) and frequency of apoptosis (b) of leukemia cells treated with DMSO or 1 μM Siomycin A. MV4-11 and THP-1 and NOMO-1cell lines express MLL fusion genes while K-562, Kasumi-3, HL-60, and U-937 cells do not express MLL-fusion genes. c, d Relative colony-forming units (c) and frequency of apoptosis (d) of leukemia cells treated with WT FOXM1-specific ARF26-44 peptide or mutant ARF37–44 peptide. For colony-forming assay, the cells grew in MethocultTM medium containing 2 μM Siomycine, DMSO, 10 μM Foxm1-peptide or mutant peptide for 7 days. The apoptosis frequencies (b) were presented relative to those of cells treated with DMSO. The apoptosis frequencies (d) were normalized to those of cells treated with mutant peptide at each concentration and presented relative to those of cells treated with mutant peptide. e Kaplan–Meier survival analysis of xenografted mice reconstituted with GFP-labeled MV4-11 cells. The mice were treated with 50 mg/kg thiostrepton or vehicle PBS for 7 days, n = 12 mice for PBS or n = 8 for thiostrepton group. f Kaplan–Meier survival analysis of xenografted mice reconstituted with GFP-labeled MV4-11 cells. The mice were treated with 10 mg/kg FOXM1-specific peptide or vehicle PBS for 14 days, n = 10 mice for each group. g Colony-forming assay for MV4-11 cells infected with inducible PLKO.1-Tet-on FOXM1-shRNA or control vector. 2 μg/ml doxycycline was added in the methylcellulose medium to induce shRNA expression. h Kaplan–Meier survival curve of xenografted mice reconstituted with 2 × 104 MV4-11 cells infected with inducible PLKO.1-Tet-on FOXM1-shRNA or control vector. 2 mg/ml doxycycline and 10 mg/ml sucrose were added in drinking water for recipient mice before transplantation, and were maintained throughout their lifetime to induce FOXM1 shRNA expression in vivo, n = 12 mice for control group, n = 8, 7 or 7 for FOXM1 shRNA 1, 2, or 3 expressing group, respectively, *p < 0.05, **p < 0.01, ***p < 0.001, mean ± s.d., t-test or Log-rank (Mantel–Cox) Test for survival curve. Source data are provided as a Source Data file.
Fig. 8
Fig. 8. Inhibition of FOXM1 suppressed MA9-transformed CD34+ cells.
a, c Colony-forming assay for hCD34+ MLL cells (human CD34+ transformed by MLL-AF9), hCD34+ MLL + RAS cells (human CD34+ transformed by MLL-AF9 and RAS), primary CD34+ cells from three patients as well as normal hCD34+ cells from healthy donor treated with DMSO or 1uM Siomycin (a) or with 10 μM FOXM1 Mut or WT peptide (c). b, d Flow cytometric analysis of apoptosis frequency of hCD34+ MLL cells, hCD34+ MLL + RAS cells, primary CD34+ cells from three patients as well as normal hCD34+ cells from healthy donor treated with DMSO or different concentration of Siomycin A(b) or with different concentration of FOXM1 WT and Mut peptide (d). Apoptosis fold change was determined by comparison of Siomycin with DMSO treatment (b) or by comparison of FOXM1 WT peptide with Mut peptide (d). e Flow cytometric analysis of YFP percentage in PB cells collected from xenografted mice reconstituted with MA9.3 cells (human CD34+ transformed by MLL-AF9-YFP). The mice were treated with 50 mg/kg thiostrepton or vehicle PBS for 7 days. f Flow cytometric analysis of YFP percentage in PB cells collected from xenografted mice reconstituted with MA9.3 cells infected with inducible PLKO.1-Tet-on FOXM1-shRNA or control vector. 2 mg/ml doxycycline and 10 mg/ml Sucrose were added in drinking water for recipient mice before transplantation, and were maintained throughout their lifetime to induce shRNA expression in vivo. g Kaplan–Meier survival curve of xenografted mice reconstituted with MA9.3 cells. The mice were treated with 50 mg/kg thiostrepton or vehicle PBS for 7 days, n = 15 mice for PBS or n = 8 mice for thiostrepton treatment group. h Kaplan–Meier survival curve of xenografted mice reconstituted with MA9.3 cells infected with inducible PLKO.1-Tet-on FOXM1-shRNA or control vector. 2 mg/ml doxycycline and 10 mg/ml Sucrose were added in drinking water for recipient mice before transplantation, and were maintained throughout their lifetime to induce shRNA expression in vivo, n = 10 mice for control group or n = 6, 9, or 5 mice for FOXM1 shRNA 1, 2, or 3 expressing groups, respectively, *p < 0.05, **p < 0.01, ***p < 0.001, mean ± s.d., t-test or Log-rank (Mantel–Cox) Test for survival curve. Source data are provided as a Source Data file.
Fig. 9
Fig. 9. Inhibition of FOXM1 suppressed primary LSCs from MA9 patients.
a, b Flow cytometry analyzing human AML cells ratio in PB cells from patient-derived xenograft (PDX) mice. Gating strategy is shown in (a) and summary data are presented in (b). c Wright-Giemsa-stained PB cells from PDX mice are shown, bar = 20 μM. d, e Kaplan–Meier survival curve of PDX mice for two patient samples, n = 5 mice for each group in (d), n = 5 mice for PBS or n = 7 mice for WT peptide treatment group. f Flow cytometric analysis of LSC ratio (CD34+CD38) in PDX mice (n = 5). g, h Flow cytometric analysis of cell cycle of LSC in PDX mice. Gating strategy is shown in (g). The cells were stained with DNA Dye Hoechst and RNA Dye PyroninY. Double negative population indicated the G0 phase/quiescence, n = 5 mice for each group. i Flow cytometric analysis of apoptosis rate of LSCs in PDX mice, n = 4 mice for each group. j Flow cytometric analysis of apoptosis rate of total leukemia cells in PDX mice, n = 5 mice for each group. k Wright-Giemsa staining of human AML cells collected from PDX mice. Differentiated cells indicated by red arrow were present in WT peptide treatment mice. *p < 0.05, **p < 0.01, ***p < 0.001, bar = 20 μM, mean ± s.d., t-test or Log-rank (Mantel–Cox) Test for survival curve. The PDX mice were reconstituted with leukemia cells from primary MLL-r AML patients. All PDX mice were treated with WT peptide or vehicle PBS. Source data are provided as a Source Data file.

Similar articles

Cited by

References

    1. Wiseman DH, Greystoke BF, Somervaille TC. The variety of leukemic stem cells in myeloid malignancy. Oncogene. 2014;33:3091–3098. doi: 10.1038/onc.2013.269. - DOI - PubMed
    1. Hope KJ, Jin L, Dick JE. Acute myeloid leukemia originates from a hierarchy of leukemic stem cell classes that differ in self-renewal capacity. Nat. Immunol. 2004;5:738–743. doi: 10.1038/ni1080. - DOI - PubMed
    1. Dick JE. Acute myeloid leukemia stem cells. Ann. N. Y Acad. Sci. 2005;1044:1–5. doi: 10.1196/annals.1349.001. - DOI - PubMed
    1. Testa U. Leukemia stem cells. Ann. Hematol. 2011;90:245–271. doi: 10.1007/s00277-010-1118-7. - DOI - PubMed
    1. Thomas D, Majeti R. Biology and relevance of human acute myeloid leukemia stem cells. Blood. 2017;129:1577–1585. doi: 10.1182/blood-2016-10-696054. - DOI - PMC - PubMed

Publication types

MeSH terms

Substances