

Chromosomal origin of replication coordinates logically distinct types of bacterial genetic regulation
- PMID: 32066730
- PMCID: PMC7026169
- DOI: 10.1038/s41540-020-0124-1
Chromosomal origin of replication coordinates logically distinct types of bacterial genetic regulation
Abstract
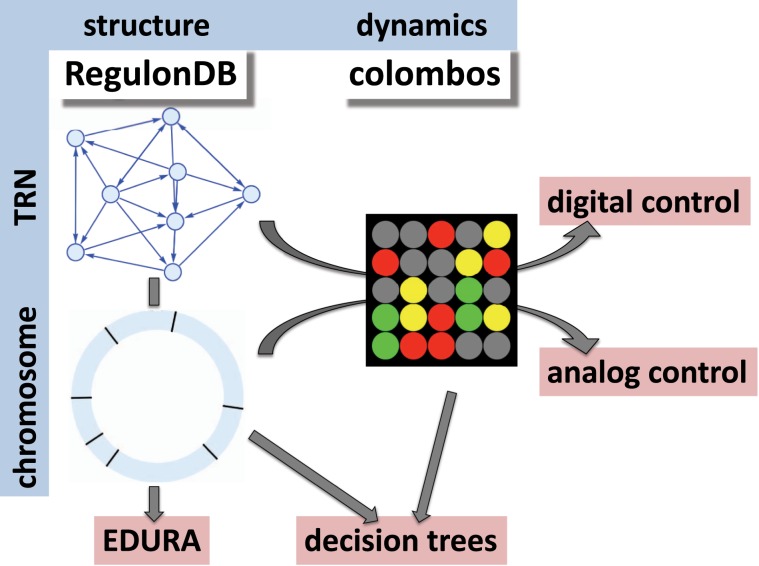
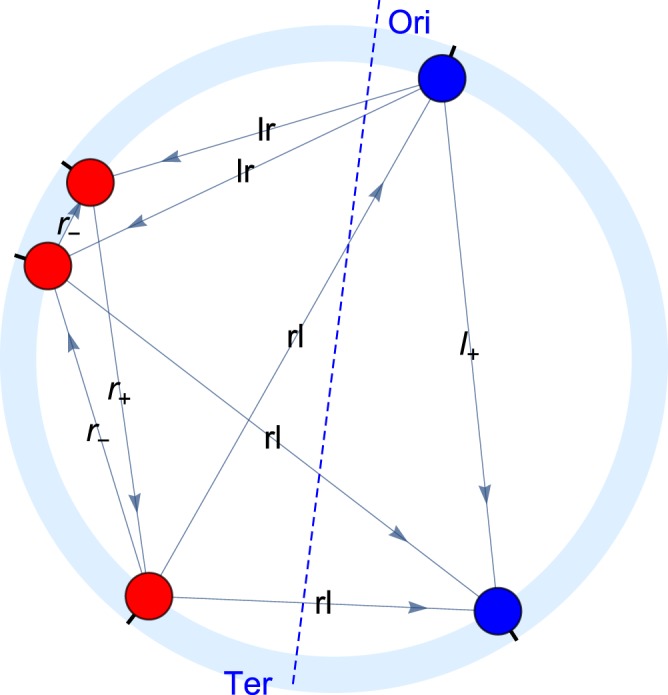
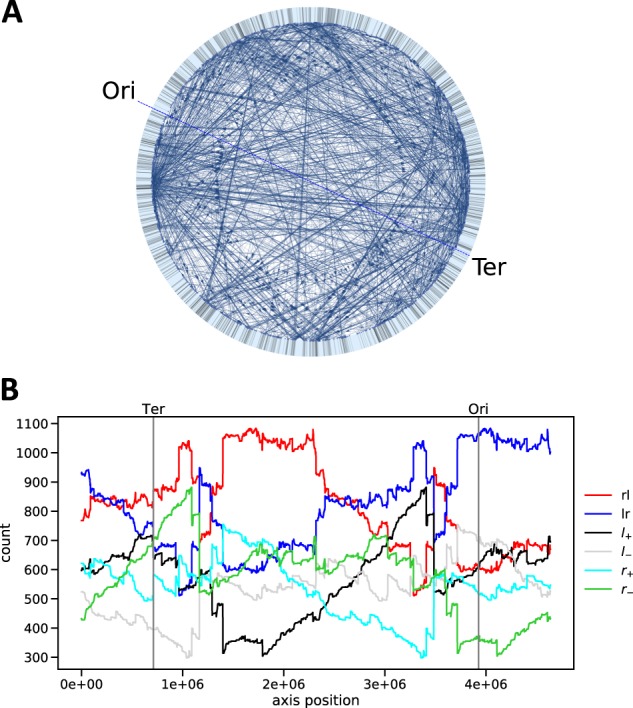
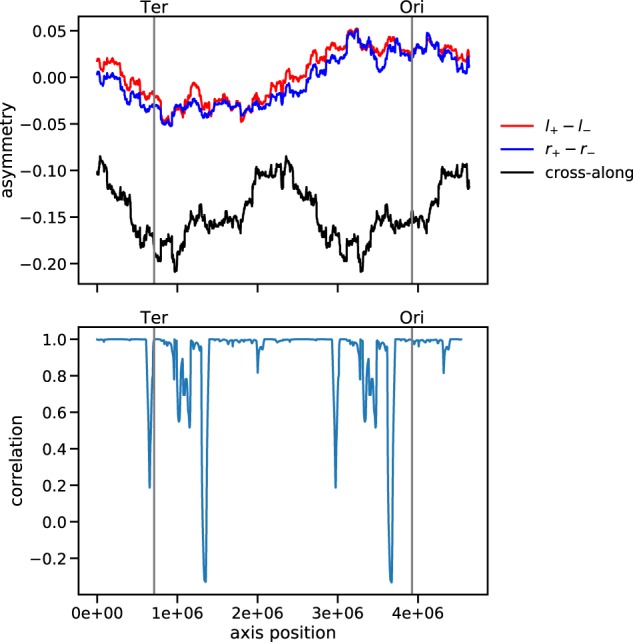
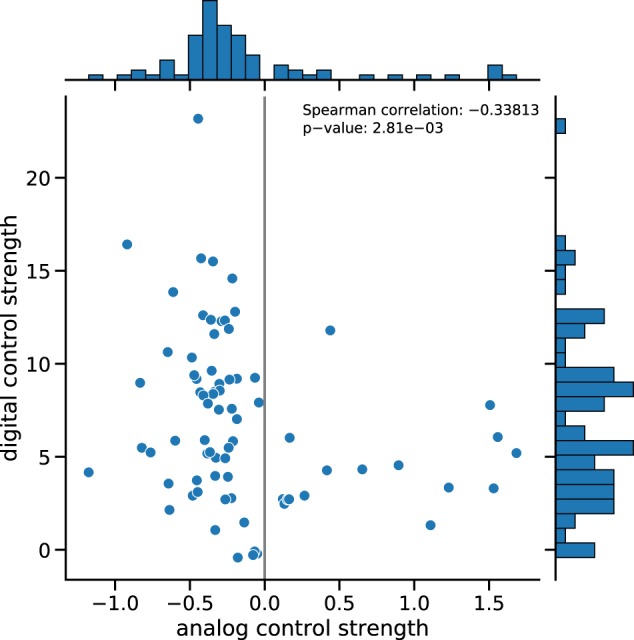
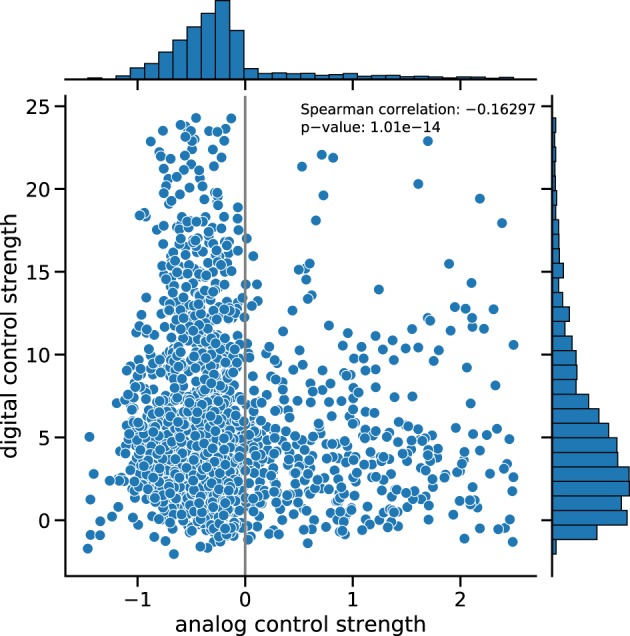
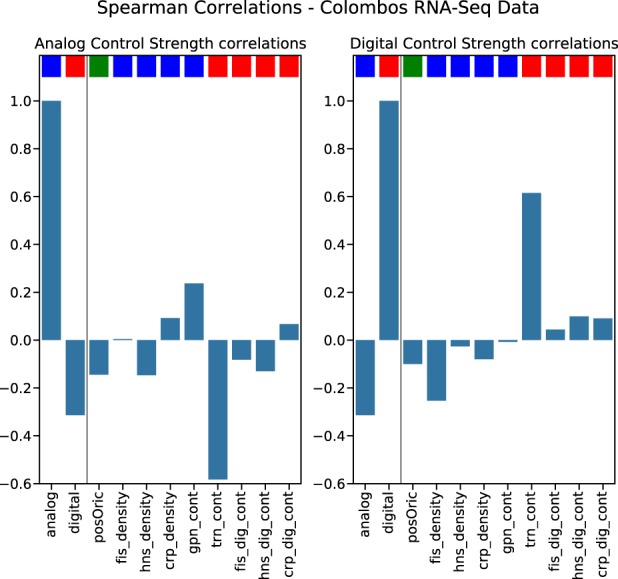
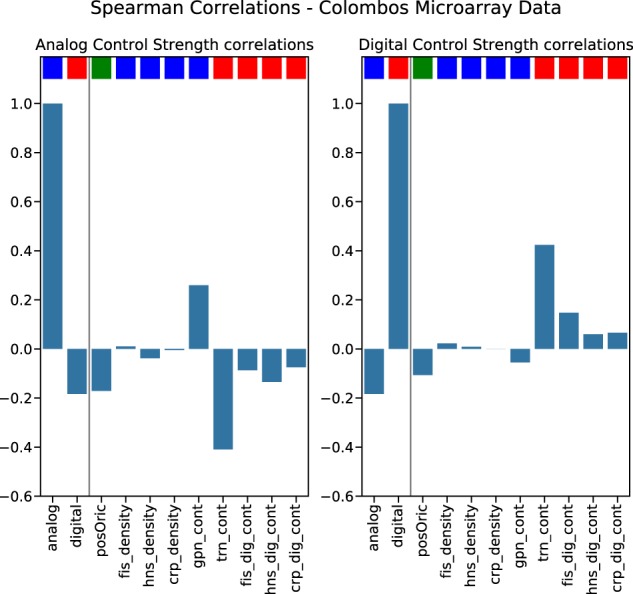
For a long time it has been hypothesized that bacterial gene regulation involves an intricate interplay of the transcriptional regulatory network (TRN) and the spatial organization of genes in the chromosome. Here we explore this hypothesis both on a structural and on a functional level. On the structural level, we study the TRN as a spatially embedded network. On the functional level, we analyze gene expression patterns from a network perspective ("digital control"), as well as from the perspective of the spatial organization of the chromosome ("analog control"). Our structural analysis reveals the outstanding relevance of the symmetry axis defined by the origin (Ori) and terminus (Ter) of replication for the network embedding and, thus, suggests the co-evolution of two regulatory infrastructures, namely the transcriptional regulatory network and the spatial arrangement of genes on the chromosome, to optimize the cross-talk between two fundamental biological processes: genomic expression and replication. This observation is confirmed by the functional analysis based on the differential gene expression patterns of more than 4000 pairs of microarray and RNA-Seq datasets for E. coli from the Colombos Database using complex network and machine learning methods. This large-scale analysis supports the notion that two logically distinct types of genetic control are cooperating to regulate gene expression in a complementary manner. Moreover, we find that the position of the gene relative to the Ori is a feature of very high predictive value for gene expression, indicating that the Ori-Ter symmetry axis coordinates the action of distinct genetic control mechanisms.
Conflict of interest statement
The authors declare no competing interests.
Figures
Similar articles
-
The E. coli transcriptional regulatory network and its spatial embedding.Eur Phys J E Soft Matter. 2019 Mar 20;42(3):30. doi: 10.1140/epje/i2019-11794-x. Eur Phys J E Soft Matter. 2019. PMID: 30879159
-
Wavelet to predict bacterial ori and ter: a tendency towards a physical balance.BMC Genomics. 2003 May 5;4(1):17. doi: 10.1186/1471-2164-4-17. Epub 2003 May 5. BMC Genomics. 2003. PMID: 12732098 Free PMC article.
-
Dancing around the divisome: asymmetric chromosome segregation in Escherichia coli.Genes Dev. 2005 Oct 1;19(19):2367-77. doi: 10.1101/gad.345305. Genes Dev. 2005. PMID: 16204186 Free PMC article.
-
Spatial arrangement and macrodomain organization of bacterial chromosomes.Mol Microbiol. 2005 Jul;57(1):9-16. doi: 10.1111/j.1365-2958.2005.04651.x. Mol Microbiol. 2005. PMID: 15948945 Review.
-
Building a bacterial orisome: emergence of new regulatory features for replication origin unwinding.Mol Microbiol. 2005 Feb;55(4):978-85. doi: 10.1111/j.1365-2958.2004.04467.x. Mol Microbiol. 2005. PMID: 15686547 Free PMC article. Review.
Cited by
-
Categories of important edges in dynamics on graphs.R Soc Open Sci. 2025 Apr 23;12(4):241086. doi: 10.1098/rsos.241086. eCollection 2025 Apr. R Soc Open Sci. 2025. PMID: 40271136 Free PMC article.
-
Composition of Transcription Machinery and Its Crosstalk with Nucleoid-Associated Proteins and Global Transcription Factors.Biomolecules. 2021 Jun 22;11(7):924. doi: 10.3390/biom11070924. Biomolecules. 2021. PMID: 34206477 Free PMC article. Review.
-
Spatiotemporal Coupling of DNA Supercoiling and Genomic Sequence Organization-A Timing Chain for the Bacterial Growth Cycle?Biomolecules. 2022 Jun 15;12(6):831. doi: 10.3390/biom12060831. Biomolecules. 2022. PMID: 35740956 Free PMC article. Review.
-
In Vivo Sampling of Intracellular Heterogeneity of Pseudomonas putida Enables Multiobjective Optimization of Genetic Devices.ACS Synth Biol. 2023 Jun 16;12(6):1667-1676. doi: 10.1021/acssynbio.3c00009. Epub 2023 May 17. ACS Synth Biol. 2023. PMID: 37196337 Free PMC article.
-
DNA as a Double-Coding Device for Information Conversion and Organization of a Self-Referential Unity.DNA (Basel). 2024 Nov 19;4(4):473-493. doi: 10.3390/dna4040032. DNA (Basel). 2024. PMID: 40098770 Free PMC article.
References
-
- Palsson, B. & Palsson, B. ϕ. Systems Biology (Cambridge University Press, Cambridge, 2015).
Publication types
MeSH terms
Substances
LinkOut - more resources
Full Text Sources
