. 2020 Feb 17;11(1):929.
doi: 10.1038/s41467-020-14700-7.

Inhibiting WNT and NOTCH in renal cancer stem cells and the implications for human patients

Affiliations

Inhibiting WNT and NOTCH in renal cancer stem cells and the implications for human patients

Annika Fendler et al. Nat Commun. .

Abstract

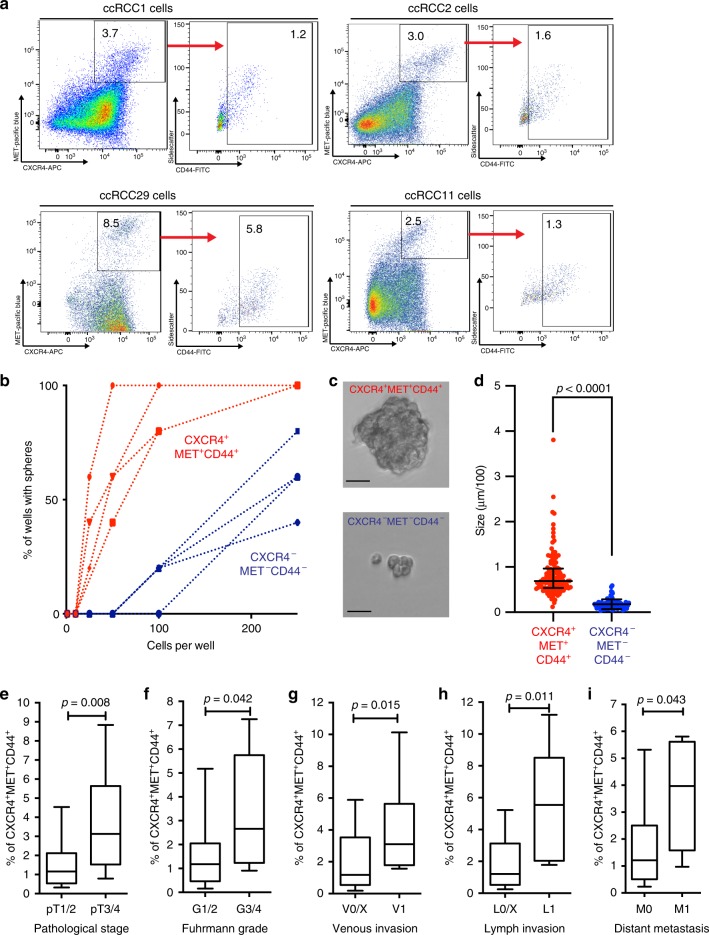
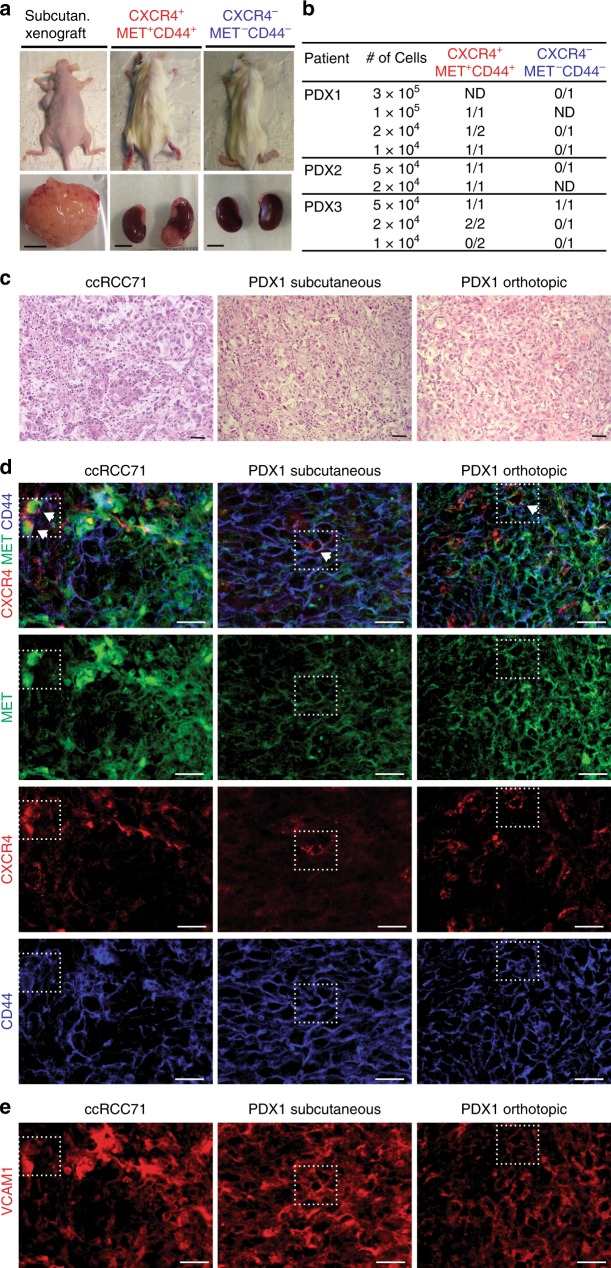
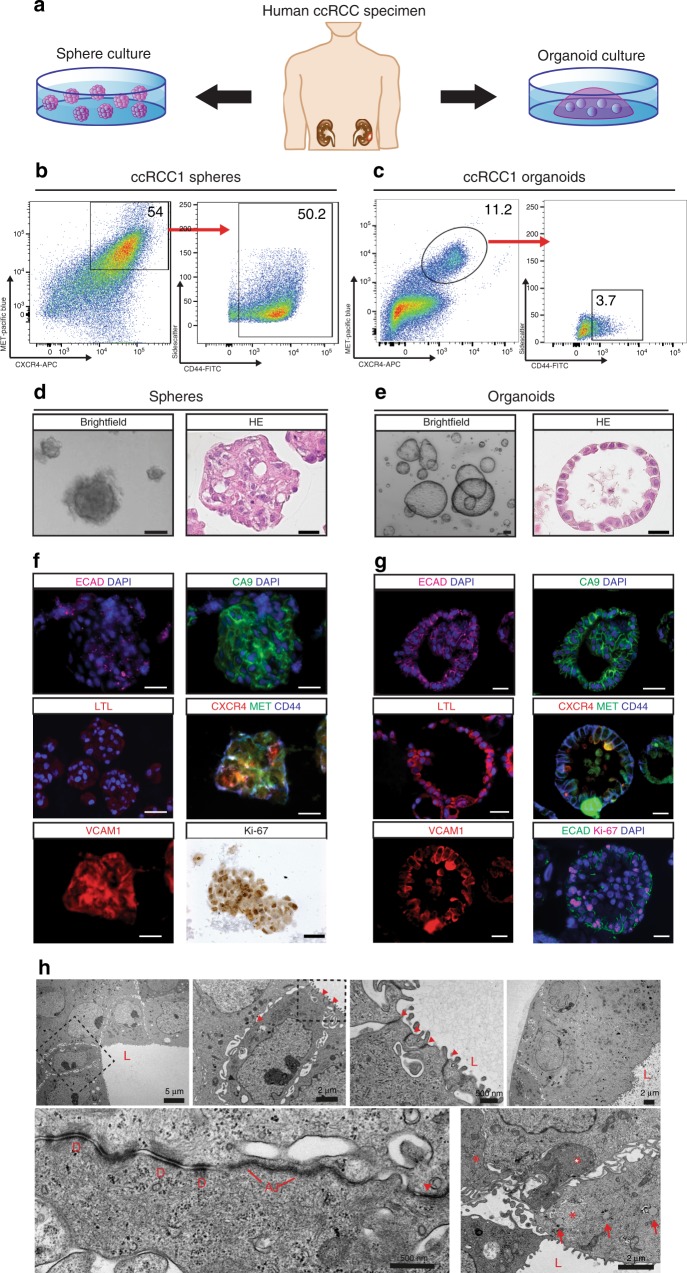
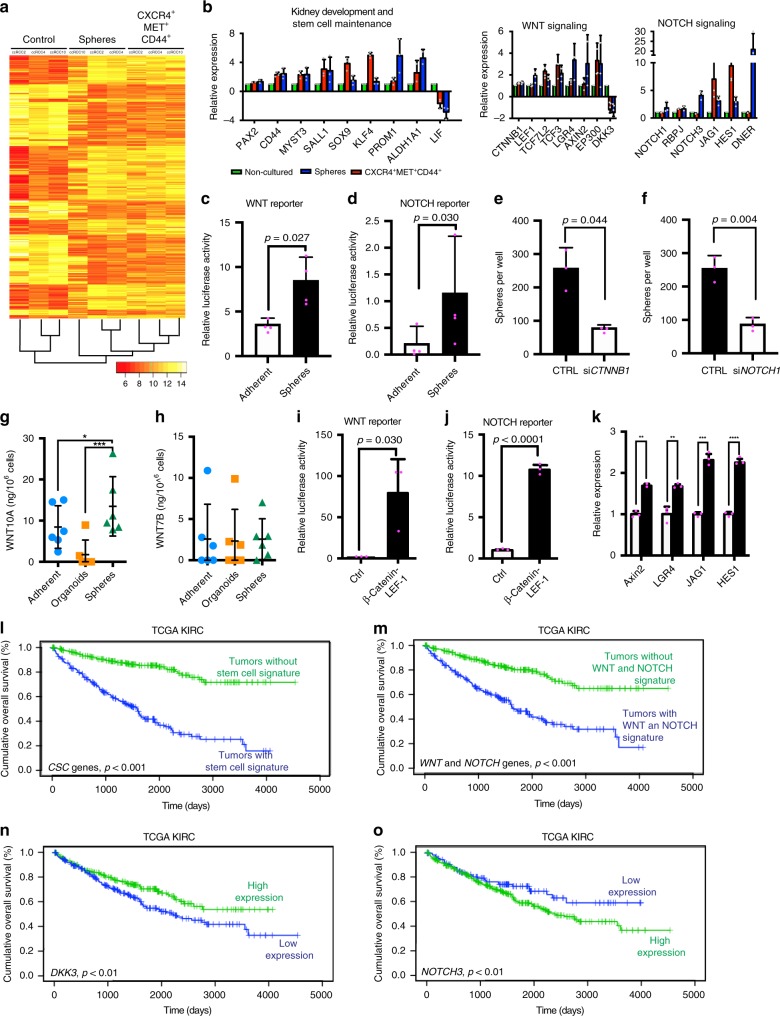
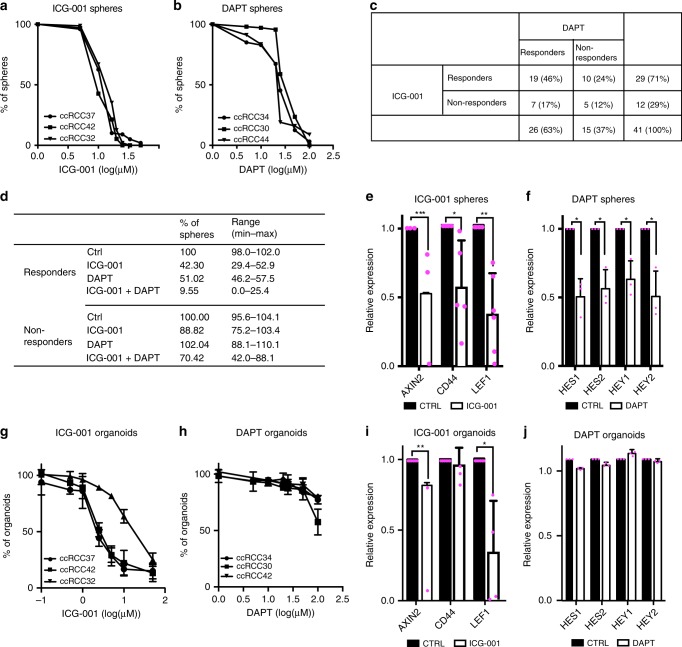
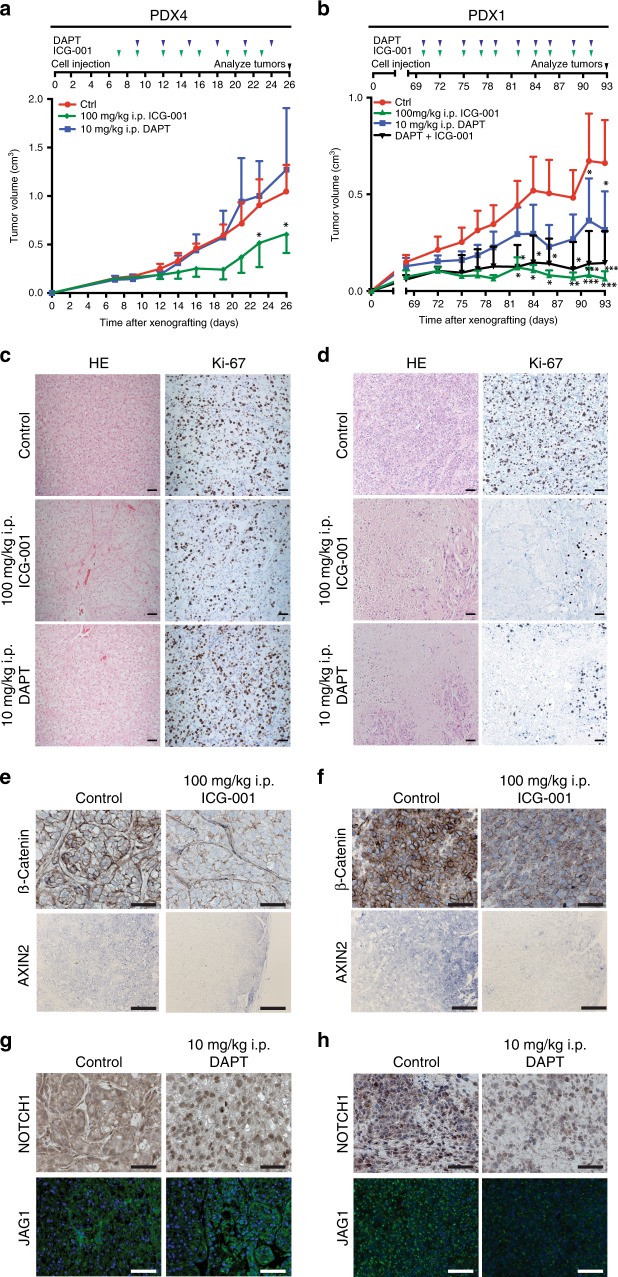
Current treatments for clear cell renal cell cancer (ccRCC) are insufficient because two-thirds of patients with metastases progress within two years. Here we report the identification and characterization of a cancer stem cell (CSC) population in ccRCC. CSCs are quantitatively correlated with tumor aggressiveness and metastasis. Transcriptional profiling and single cell sequencing reveal that these CSCs exhibit an activation of WNT and NOTCH signaling. A significant obstacle to the development of rational treatments has been the discrepancy between model systems and the in vivo situation of patients. To address this, we use CSCs to establish non-adherent sphere cultures, 3D tumor organoids, and xenografts. Treatment with WNT and NOTCH inhibitors blocks the proliferation and self-renewal of CSCs in sphere cultures and organoids, and impairs tumor growth in patient-derived xenografts in mice. These findings suggest that our approach is a promising route towards the development of personalized treatments for individual patients.


Conflict of interest statement

The authors declare no competing interests.

Figures

Fig. 1
Fig. 1. Analysis of ccRCC cancer stem cells.
a Representative FACS of single-cell suspensions of ccRCC cells using the markers CXCR4, MET, and CD44. Axis label of sidescatter is a multiple of 1000. b Limiting dilution assay of the sphere formation capacity of CXCR4+MET+CD44+ and CXCR4METCD44 cells (n = 4, single-cell suspensions of independent patients): 1–250 cells per well were seeded and cultured for 7 days, and all wells with >1 sphere were counted as positive. 10 wells per concentration were analyzed. c Representative image of spheres of the two phenotypes after 7 days of culture (Scale bar, 25 µm) (n = 4, single-cell suspensions of independent patients). d Quantification of sphere size of CXCR4+MET+CD44+ and CXCR4METCD44 cells after 7 days of culture (n = 125 CXCR4+MET+CD44+ spheres and 83 CXCR4METCD44 spheres). Shown is the diameter in µm/100, line represents median size and error bars show the interquartile range. p-value was calculated by two-sided Mann–Whitney test. Frequencies of CXCR4+MET+CD44+ cells in ccRCCs from patients with (e) pathological stage (pT) 1/2 (n = 22) or 3/4 (n = 19), (f) Fuhrman grade (G) 1/2 (n = 34) or 3/4 (n = 7), (g) without (n = 31) or with (n = 10) venous invasion (V), (h) without (n = 34) and with (n = 7) lymph node invasion (L), and (i) without (n = 33) or with (n = 8) distant metastases (M) at the time of surgery. Numbers represent single-cell suspensions of individual patients. Boxes show the 25, 50, and 75 percentiles, whiskers the 10 and 90 percentiles. Outliers are shown as dots. p-values were calculated by two-sided Mann–Whitney test.
Fig. 2
Fig. 2. Xenotransplantation and in vivo localization of CXCR4+MET+CD44+.
a Representative images of xenotransplanted mice, and subcutaneous and orthotopic tumors (Scale bars, 0.5 cm). b Tumor formation by CXCR4+MET+CD44+ and CXCR4METCD44 cells: cells were isolated from subcutaneous tumors, FAC-sorted and orthotopically transplanted into the renal parenchyma at the indicated cell numbers. Tumor formation was analyzed when mice showed symptoms or tumors were palpable. c Representative HE of primary ccRCC specimens and corresponding subcutaneous and orthotopic xenografts (scale bars, 50 µm). d Representative immunofluorescence of CXCR4, MET, and CD44. CXCR4+MET+CD44+ cells are highlighted in dotted lines and arrows. Immunofluorescence of each individual marker is shown for clarity (sale bars, 50 µm). e Representative immunofluorescence of VCAM1. Location of CXCR4+MET+CD44+ cells are highlighted in dotted lines (scale bars, 50 µm). Stainings were performed in three independent PDX and in 42 ccRCC specimens.
Fig. 3
Fig. 3. Characterization of ccRCC-derived sphere and organoid cultures.
a Human ccRCCs were collected at nephrectomy. Single cells were isolated and seeded as spheres in non-adherent conditions or as organoids in Matrigel. b, c Percent of CXCR4+MET+CD44+ cells obtained by FACS after 7 days of sphere or organoid cultures. Axis label of sidescatter is a multiple of 1000. d, e Brightfield images and HE staining after 7 days of sphere and organoid culture (scale bars, 100 µm). f, g Immunofluorescence for Carbonic anhydrase IX (CA9), E-Cadherin (ECAD), LTL, CXCR4, MET, CD44, VCAM1, and Ki-67 (scale bars, 25 µM). Stainings were performed in five sphere and organoid cultures of five independent patients. h Transmission electron microscopy of representative organoid cultures (see scale bars for sizes): L, luminal side; D, desmosomes; AJ, adherens junctions; arrowheads, tight junctions; arrows, lipid droplets; asterisks, glycogen deposits. TEM was performed on organoid cultures of three selected patients.
Fig. 4
Fig. 4. Activation of WNT in NOTCH signaling in CXCR4+MET+CD44+ and spheres.
Microarray analysis of spheres, FAC-sorted CXCR4+MET+CD44+ and control cells from three ccRCCs. a Heatmap and hierarchical clustering of the 500 most variable probes. b log2 fold changes of top-scoring genes associated with the GO terms kidney development, stem cell maintenance, WNT and NOTCH signaling. Data are shown as mean, error bars represent s.d. (n = 3 patients). c, d WNT or NOTCH luciferase reporter gene assays of sphere and adherent cultures of ccRCC (n = 5 independent patients). Data are shown as mean, error bars represent s.d., p-values calculated by two-sided t-test. e, f siRNA knockdown of CTNNB1 or NOTCH1 in spheres (n = 5 patients). Data are shown as mean, error bars represent s.d., p-values calculated by two-sided t-test. g, h ELISA for WNT10A and WNT7B secretion of adherent, organoid and sphere cultures (n = 6 patients). Supernatants were collected after 7 days of culture. Values were normalized to the number of cells per ml medium and are represented as ng protein per 106 cells. Line represents mean protein concentration and error bars show the s.d. p-values: *<0.05, ***<0.001 by RM ANOVA with Dunnett’s post-test (two-sided). i, j WNT or NOTCH luciferase reporter gene assays of sphere cultures (n = 5 independent patients) transfected with a β-Catenin-LEF1 fusion protein encoding plasmid. Data are shown as mean, error bars represent s.d., p-values calculated by two-sided t-test. k Expression of WNT and NOTCH pathway genes measured by RT-qPCR in β-Catenin-LEF1-transfected spheres (n = 5 patients). Data are shown as mean, error bars represent s.d., p-values: **<0.01, ***<0.001, ****<0.0001 by two-sided, paired t-test. Overall survival of TCGA KIRC specimens with or without the stem cell signature (l), the WNT and NOTCH signature (m), or high (>median) or low (<median) DKK3 (n) or NOTCH3 expression (o). Stem cell signature predictor score was calculated by multivariate Cox regression, patients were stratified into groups according to the median predictor score. Censored patients are presented as vertical lines. Significance was tested by log rank test (two-sided).
Fig. 5
Fig. 5. Single-cell sequencing of CXCR4+MET+CD44+ cells.
Single-cell RNA-Seq was performed on 90 cells per patient by using the CEL-Seq2 method. Canonical cluster analysis was performed on common variable genes in the combined datasets, and tSNE clusters were subsequently identified. a tSNE plot of single cells, clusters marked in different colors, b Heatmap of the top 20 markers for each cluster. c Expression of WNT, NOTCH and stem cell marker genes in each cluster. Data are shown as scatter plot, violin plot represents data density.
Fig. 6
Fig. 6. Pharmacological inhibition of WNT and NOTCH signaling in ccRCC spheres and organoids.
a, b ccRCC sphere cultures were treated with 5–50 µM ICG-001 or 1–100 µM DAPT for 7 days, and spheres <25 µm were then counted. Data are shown for three exemplary cultures. Experiments were performed in 41 ccRCC sphere cultures. c Overview of DAPT and ICG-001 responders in 41 ccRCC spheres. Sphere cultures with ICG-001 IC50 < 20 µM or DAPT IC50 < 30 µM were classified as responders. d ICG-001 and DAPT responders or non-responders were treated with 20 µM ICG-001, 20 µM DAPT or both (n = 5 for each treatment). Sphere numbers were counted after 7 days. e, f Sphere cultures treated with 20 µM ICG-001 or 20 µM DAPT (n = 4 for each group), and the expression of target genes was measured by RT-qPCR. Data are shown as mean, error bars represent s.d. p-values: *<0.05, **<0.01, ***<0.001 by two-sided t-test. g, h ccRCC organoid cultures were treated with 0.1–50 µM ICG-001 or 1–100 µM DAPT for 7 days. Metabolic activity was measured by CellTiterGlo assay and normalized to vehicle-treated controls. Data are shown for three exemplary cultures as mean ± SD of three technical replicates. Experiments were performed in 15 organoid cultures. i, j Organoid cultures were treated with 5 µM ICG-001 or 25 µM DAPT, and the expression of target genes was measured by RT-qPCR (n = 3 independent patients). Data are shown as mean, error bars represent s.d., p-values: *<0.05, **<0.01 by two-sided t-test.
Fig. 7
Fig. 7. Inhibition of WNT and NOTCH signaling in patient-derived ccRCC xenografts.
a, b Treatment schemes and quantifications of tumor volumes of PDX4 and PDX1 tumors (n = 3 tumors in each group) treated with 100 mg/kg ICG-001 (green diamond), 10 mg/kg DAPT (blue squares), combination (black diamond, PDX1 only) or vehicle (red circles) every three days. Data are shown as mean, error bars represent s.d., p-values: *<0.05, *<0.01, ***<0.001 by two-way ANOVA with Tukey post-test (two-sided). c, d HE and Ki-67 staining of representative sections of tumors of PDX1 and PDX4 (scale bars, 50 µm). e, f Immunofluorescence of β-CATENIN (scale bars, 50 µm) and in situ hybridization for AXIN2 (scale bars 100 µm) in PDX4 and PDX1 tumors in mice treated with 100 mg/kg ICG-001. g, h Immunofluorescence of NOTCH1 and JAG1 in PDX4 and PDX1 tumors in mice treated with 10 mg/kg DAPT (scale bars, 50 µm).

References

    1. Znaor A, Lortet-Tieulent J, Laversanne M, Jemal A, Bray F. International variations and trends in renal cell carcinoma incidence and mortality. Eur. Urol. 2015;67:519–530. doi: 10.1016/j.eururo.2014.10.002. - DOI - PubMed
    1. Sato Y, et al. Integrated molecular analysis of clear-cell renal cell carcinoma. Nat. Genet. 2013;45:860–867. doi: 10.1038/ng.2699. - DOI - PubMed
    1. Cancer Genome Atlas Research Network. Comprehensive molecular characterization of clear cell renal cell carcinoma. Nature. 2013;499:43–49. doi: 10.1038/nature12222. - DOI - PMC - PubMed
    1. Turajlic S, et al. Deterministic evolutionary trajectories influence primary tumor growth: TRACERx renal. Cell. 2018;173:595–610 e511. doi: 10.1016/j.cell.2018.03.043. - DOI - PMC - PubMed
    1. Motzer RJ. Perspective: what next for treatment? Nature. 2016;537:S111. doi: 10.1038/537S111a. - DOI - PubMed

Publication types

MeSH terms