. 2020 May;22(5):945-953.
doi: 10.1038/s41436-020-0754-0. Epub 2020 Feb 18.

Spinal muscular atrophy diagnosis and carrier screening from genome sequencing data

Affiliations

Spinal muscular atrophy diagnosis and carrier screening from genome sequencing data

Xiao Chen et al. Genet Med. 2020 May.

Abstract

Purpose: Spinal muscular atrophy (SMA), caused by loss of the SMN1 gene, is a leading cause of early childhood death. Due to the near identical sequences of SMN1 and SMN2, analysis of this region is challenging. Population-wide SMA screening to quantify the SMN1 copy number (CN) is recommended by the American College of Medical Genetics and Genomics.

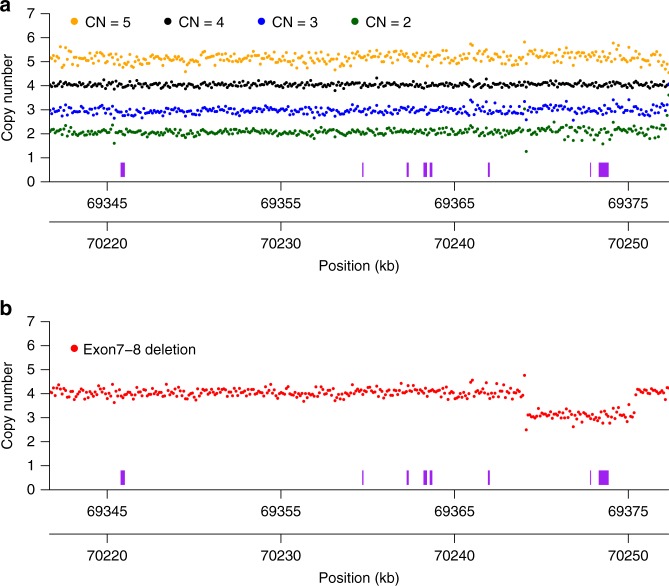
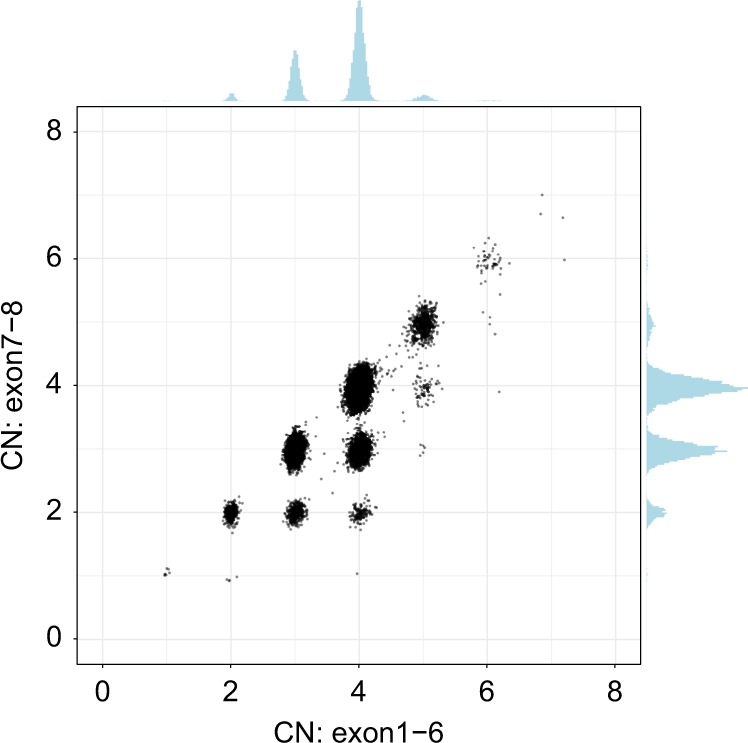
Methods: We developed a method that accurately identifies the CN of SMN1 and SMN2 using genome sequencing (GS) data by analyzing read depth and eight informative reference genome differences between SMN1/2.

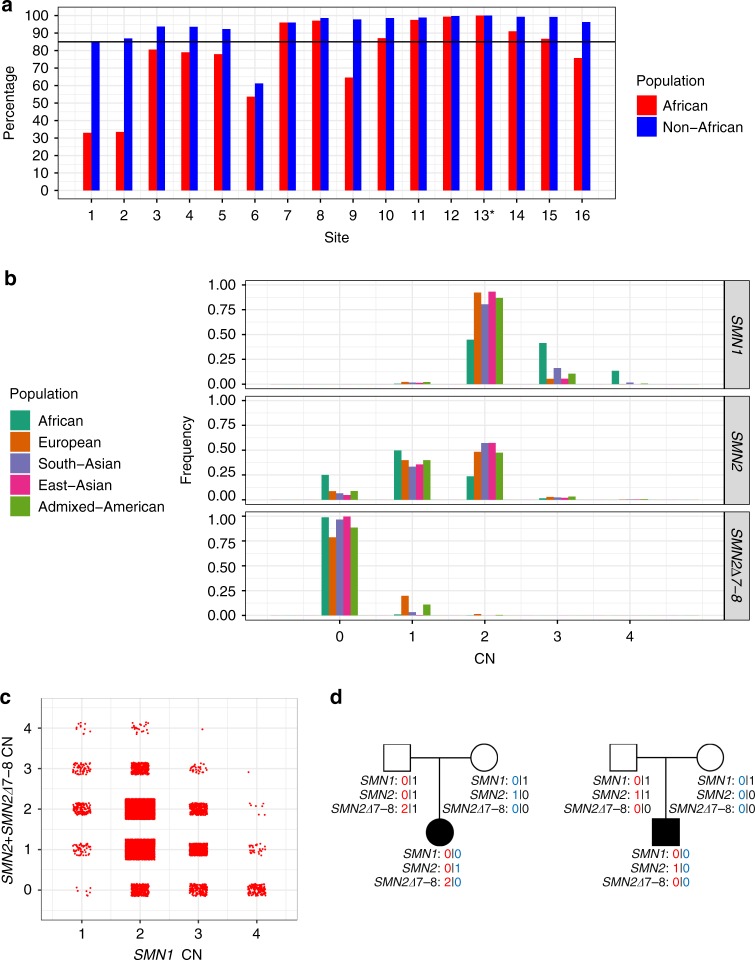
Results: We characterized SMN1/2 in 12,747 genomes, identified 1568 samples with SMN1 gains or losses and 6615 samples with SMN2 gains or losses, and calculated a pan-ethnic carrier frequency of 2%, consistent with previous studies. Additionally, 99.8% of our SMN1 and 99.7% of SMN2 CN calls agreed with orthogonal methods, with a recall of 100% for SMA and 97.8% for carriers, and a precision of 100% for both SMA and carriers.

Conclusion: This SMN copy-number caller can be used to identify both carrier and affected status of SMA, enabling SMA testing to be offered as a comprehensive test in neonatal care and an accurate carrier screening tool in GS sequencing projects.

Keywords: bioinformatics; carrier screening; copy-number analysis; genome sequencing (GS); spinal muscular atrophy (SMA).


Conflict of interest statement

X.C., Z.K., A.C., A.L.H., R.J.T., D.R.B. and M.A.E. are employees of Illumina Inc. The other authors declare no conflicts of interest.

Figures

Fig. 1
Fig. 1. Common copy-number variants (CNVs) affecting the SMN1/2 loci.
a Depth profiles across the SMN1/SMN2 regions. Samples with a total SMN1 + SMN2 copy number of 2, 3, 4, and 5 (derived from average read depth in the two genes) are shown as green, blue, black, and orange dots, respectively. Depth from 50 samples are summed up for each CN category. Each dot represents normalized depth values in a 100-bp window. Read counts are calculated in each 100-bp window, summing up reads from both SMN1 and SMN2, and normalized to the depth of wild-type samples (CN = 4). The SMN exons are represented as purple boxes. The two x-axes show coordinates (hg19) in SMN1 (bottom) and SMN2 (upper). b Depth profiles aggregated from 50 samples carrying a deletion of exons 7 and 8 are shown as red dots. Read depths are calculated in the same way as in (a).
Fig. 2
Fig. 2
Scatterplot of total SMN (SMN1, SMN2, and SMN2∆7–8) copy number (CN) (x-axis, called by read depth in exons 1–6) and intact SMN copy number (y-axis, called by read depth in exons 7–8).
Fig. 3
Fig. 3. Distribution of SMN1/SMN2/SMN2∆7–8 copy numbers in the population.
a Percentage of samples showing copy number (CN) call agreement with c.840C>T across 16 SMN1–SMN2 base difference sites in African and non-African populations. Coordinates of these 16 sites are given in Table S1 and site 13* is the c.840C>T splice variant site. The black horizontal line denotes 85% concordance. b Histogram of the distribution of SMN1, SMN2, and SMN2∆7–8 copy numbers across five populations in 1kGP and the National Institute for Health Research (NIHR) BioResource cohort. c SMN1 CN vs. total SMN2 CN (intact SMN2 + SMN2∆7–8). d Two trios with an SMA proband detected by the caller and orthogonally confirmed in the Next Generation Children project cohort. CNs of SMN1, SMN2, and SMN2∆7–8 are phased and labeled for each member of the trios.

References

    1. Lunn MR, Wang CH. Spinal muscular atrophy. Lancet. 2008;371:2120–2133. doi: 10.1016/S0140-6736(08)60921-6. - DOI - PubMed
    1. Mercuri E, Bertini E, Iannaccone ST. Childhood spinal muscular atrophy: controversies and challenges. Lancet Neurol. 2012;11:443–452. doi: 10.1016/S1474-4422(12)70061-3. - DOI - PubMed
    1. Prior TW. Perspectives and diagnostic considerations in spinal muscular atrophy. Genet Med. 2010;12:145–152. doi: 10.1097/GIM.0b013e3181c5e713. - DOI - PubMed
    1. Ogino S, Leonard DGB, Rennert H, Ewens WJ, Wilson RB. Genetic risk assessment in carrier testing for spinal muscular atrophy. Am J Med Genet. 2002;110:301–307. doi: 10.1002/ajmg.10425. - DOI - PubMed
    1. Hendrickson BC, Donohoe C, Akmaev VR, et al. Differences in SMN1 allele frequencies among ethnic groups within North America. J Med Genet. 2009;46:641–644. doi: 10.1136/jmg.2009.066969. - DOI - PMC - PubMed

Publication types

Substances