Review
. 2020 Apr;20(4):233-246.
doi: 10.1038/s41568-020-0240-7. Epub 2020 Feb 17.

A census of pathway maps in cancer systems biology

Affiliations
Review

A census of pathway maps in cancer systems biology

Brent M Kuenzi et al. Nat Rev Cancer. 2020 Apr.

Erratum in

Abstract

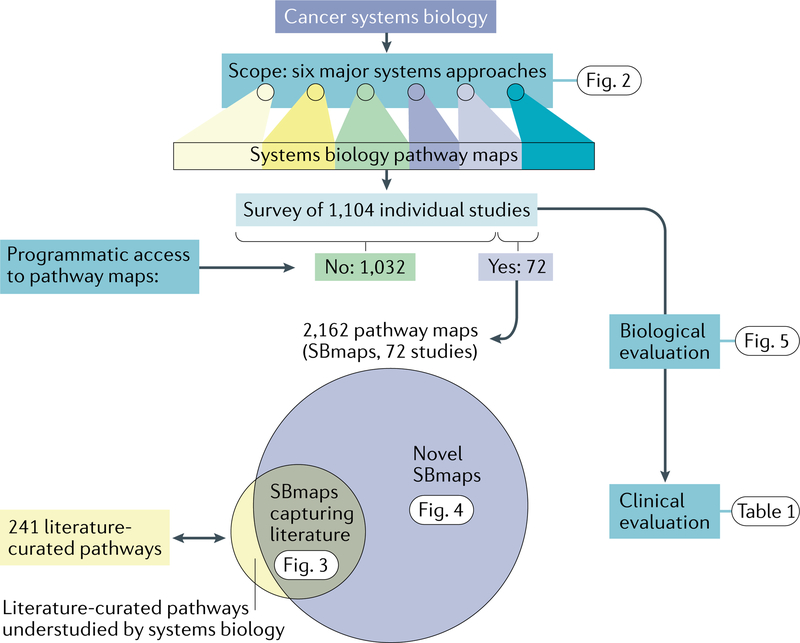
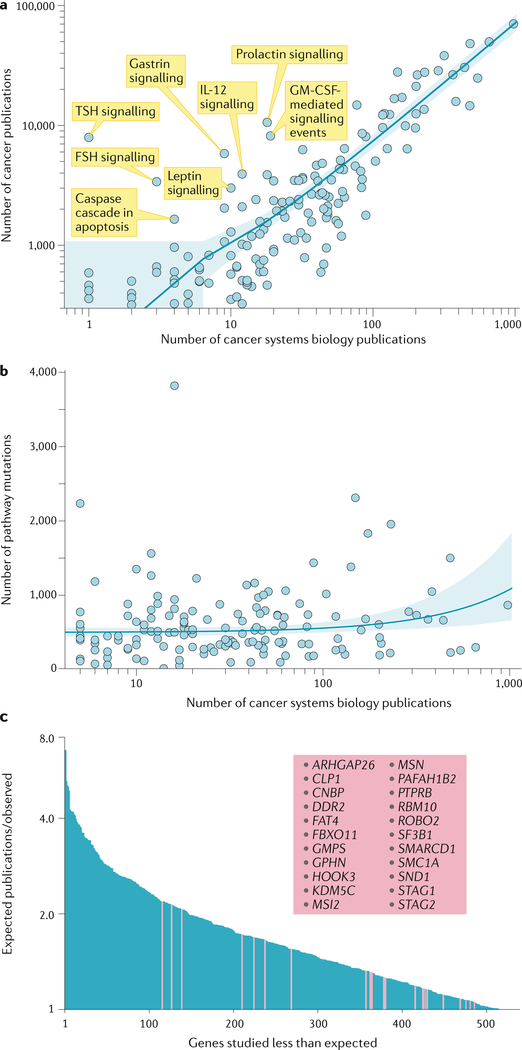
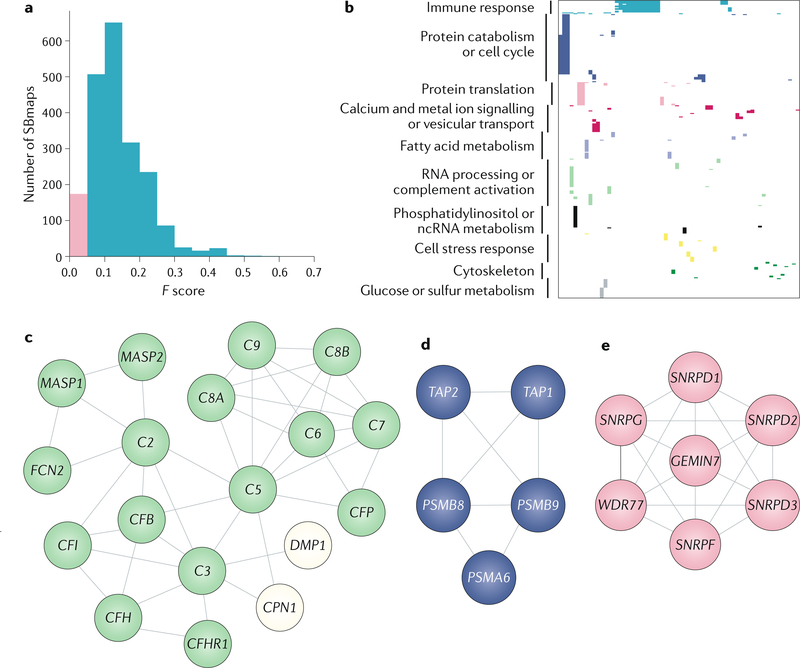
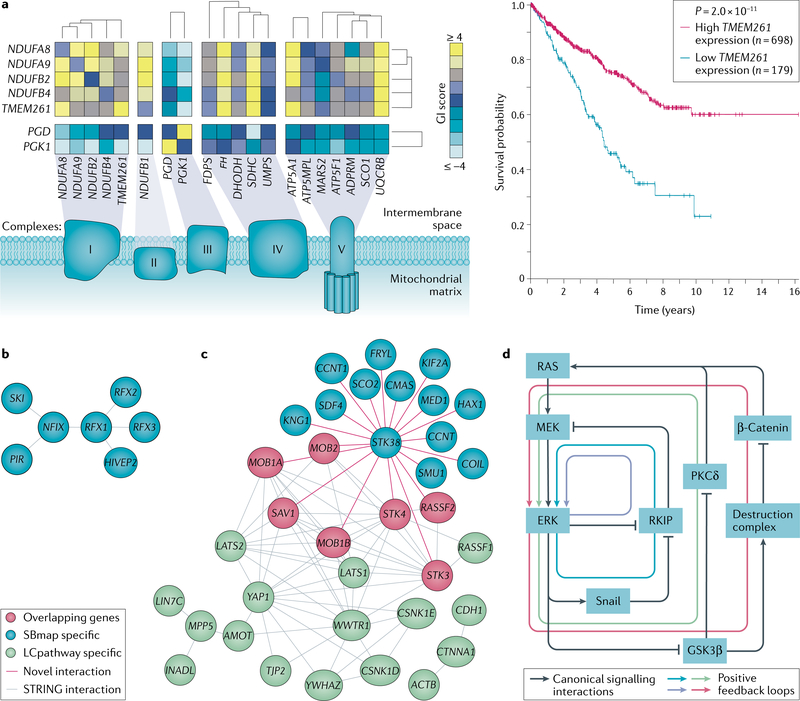
A key goal of cancer systems biology is to use big data to elucidate the molecular networks by which cancer develops. However, to date there has been no systematic evaluation of how far these efforts have progressed. In this Analysis, we survey six major systems biology approaches for mapping and modelling cancer pathways with attention to how well their resulting network maps cover and enhance current knowledge. Our sample of 2,070 systems biology maps captures all literature-curated cancer pathways with significant enrichment, although the strong tendency is for these maps to recover isolated mechanisms rather than entire integrated processes. Systems biology maps also identify previously underappreciated functions, such as a potential role for human papillomavirus-induced chromosomal alterations in ovarian tumorigenesis, and they add new genes to known cancer pathways, such as those related to metabolism, Hippo signalling and immunity. Notably, we find that many cancer networks have been provided only in journal figures and not for programmatic access, underscoring the need to deposit network maps in community databases to ensure they can be readily accessed. Finally, few of these findings have yet been clinically translated, leaving ample opportunity for future translational studies. Periodic surveys of cancer pathway maps, such as the one reported here, are critical to assess progress in the field and identify underserved areas of methodology and cancer biology.


Conflict of interest statement

Competing interests

The authors declare no competing interests.

Figures

Fig. 1|
Fig. 1|. Structure of the analysis.
In the analysis presented here, we defined a scope of six major systems approaches used to map and model cancer signalling pathways. For these approaches, we identified publications referencing each of these six approaches. We then retrieved programmatically accessible pathway maps derived from systems biology studies, compared these maps with literature-curated cancer pathways and assessed the novel mechanisms emerging from these studies. Finally, we evaluated the extent to which systems biology methods and discoveries have been translated to the clinic. SBmaps, systems biology maps.
Fig. 2|
Fig. 2|. Cancer systems biology approaches covered in this analysis.
Six different approaches are discussed in this article. For additional details, see Box 1. a | Discovery of epistatic and functional gene interaction networks using genetic perturbation technologies such as CRISPR–Cas9. b | Discovery of protein–protein interactions, complexes and signalling networks in cancer-relevant contexts. An example of tandem affinity purification of a protein of interest coupled with liquid chromatography–tandem mass spectrometry (LC–MS/MS)-based proteomics is shown. Additional techniques are discussed in Box 1. c | Inference of gene regulatory networks and upstream master regulators. One example using ARACNE (algorithm for the reconstruction of accurate cellular networks) to assemble gene regulatory networks from tumour mRNA expression data is shown, where direct regulatory interactions between transcriptional regulators and target genes are inferred from gene expression data followed by the removal of many potential indirect interactions. Many other techniques to identify master regulators exist. Parts df show examples of integration of existing networks with tumour molecular profiles to identify molecular pathways and complexes altered in cancer. d | Integration of protein networks with tumour mutations using heat diffusion. Node colour corresponds to mutation frequency, modelled as heat. Black arrows represent heat diffusion to interacting proteins in the network. e | Integration of the glycolysis metabolic network with tumour gene expression using flux balance analysis. The metabolic solution space is shown with two example reactions, glucose (Gluc) to glucose 6-phosphate (G6P) (V1) and phosphoenolpyruvate (PEP) to pyruvate (PYR) (V2), with tumour biomass production as the objective function (Vobj). The constrained solution space represents the potential values of V1 and V2 that can be applied to maximize Vobj. f | Integration of signalling networks with tumour gene expression using ordinary differential equations (ODEs). Shown is an example ODE describing changes in cell cycle gene expression over time. F6P, fructose 6-phosphate; G3P, glyceraldehyde 3-phosphate; gRNA, guide RNA. Part d adapted from Leiserson et al., Springer Nature Limited.
Fig. 3|
Fig. 3|. Coverage of LCpathways by SBmaps.
a | Functional enrichment was performed for each systems biology map (SBmap) (left pie chart) using the Gene Ontology biological process branch. Significant terms (hypergeometric test, P < 10−8) were sorted by the number of SBmaps enriched. The top 300 were retained and organized under six broad process categories (colours). Each pie slice represents the number of SBmaps enriched within each category (note a map with multiple functional enrichments can be counted multiple times). A separate but identical analysis was performed for literature-curated pathways (LCpathways) (right pie chart). b | Analysis of overlap between SBmaps and LCpathways. Blue fill represents the proportion of SBmaps (right) that were significantly enriched for the genes of an LCpathway (left) (hypergeometric test, P < 10−8). Grey fill represents the proportion of SBmaps that were not enriched for an LCpathway. Lines connect each SBmap to the significantly overlapping LCpathway for which it had the highest recall. c | Precision–recall plot showing the best SBmap recovery of each LCpathway (points). The best-matching SBmap is selected according to the F score (point colours and contours), a combined measure of precision and recall. d | Specific precision and recall analysis for an example SBmap (Zhang118_27559151). Precision and recall are computed against each LCpathway (points). The best recall of an LCpathway is for vascular endothelial growth factor (VEGF) and VEGF receptor (VEGFR) signalling, displayed at the bottom. Red nodes indicate genes/proteins covered by both the SBmap and the matching LCpathway. Blue or green nodes indicate genes/proteins specific to the SBmap or LCpathway, respectively. High-confidence interactions (0.7 or greater) between genes in this network were obtained from STriNg. e | Histograms of the number of genes/proteins belonging to each SBmap (top) or LCpathway (bottom). For display purposes, this analysis is limited to SBmaps with 200 or fewer genes (representing more than 95% of SBmaps). f | Network diagram of the LCpathway ‘β−3-integrin signalling’ and SBmap Park318_26635139 (reF.). The colour mapping is the same as in part d.
Fig. 4|
Fig. 4|. Assessment of relative research coverage of cancer pathways by systems biology.
a | Scatterplot showing, for each literature-curated pathway (LCpathway), the number of publications related to that pathway overall versus the number of cancer publications specifically related to cancer systems biology. The number of publications was retrieved using custom PubMed search terms for both cancer systems biology and cancer publications for each LCpathway (listed in Supplementary Table 3). Selected pathways with few systems biology publications relative to overall cancer publications are labelled. The line represents the fit of the linear regression model, with the 95% confidence interval shown as the shaded area (note the log–log axes warp the linear fit). b | Scatterplot showing, for each LCpathway, the number of cancer systems biology publications related to that pathway versus the aggregate mutation count for that pathway (determined with The Cancer Genome Atlas Pan-Cancer Atlas). The line represents the fit of the linear regression model, with the 95% confidence interval shown as the shaded area (note the log–log axes warp the linear fit). c | Waterfall plot of the number of expected publications divided by the number of observed publications for experimentally accessible genes (that is, there are antibodies, inhibitors and/or assays available to study them). The expected number of publications is based on a statistical model using chemical, physical and biological features of each gene. Cancer genes are highlighted in pink, with these gene names listed. FSH, follicle- stimulating hormone; GM-CSF, granulocyte–macrophage colony-stimulating factor ; IL-12, interleukin-12; TSH, thyroid-stimulating hormone.
Fig. 5|
Fig. 5|. representative SBmaps not previously reported in the literature.
a Histogram of best F score for each systems biology map (SBmap). The pink area indicates SBmaps with F < 0.05 selected for further analysis. b | Clustering of enriched Gene Ontology (GO) processes for SBmaps with F < 0.05. SBmaps without GO enrichment are not shown. Cluster names were determined by the most prevalent GO term enrichments; as such the processes listed together are not necessarily connected biologically. Parts ce show example heat diffusion-derived SBmaps from the analysis in part b. c | Olcina27_30590044 (reF.). d | Babaei9_23343428 (REF126.). e | Zhang133_27559151 (reF.). Node colour corresponds to genes with functions shown in part b. Green nodes map to RNA processing and complement activation functions. Blue nodes map to protein catabolism and cell cycle functions. Pink nodes map to protein translation functions. White nodes do not map to a function. Edges show high-confidence (0.7 or greater) interactions as scored by STRING. ncRNA, non-coding RNA.
Fig. 6|
Fig. 6|. Potential new mechanisms emerging from cancer systems biology studies.
a | Example genetic interaction map demonstrating the recovery of complexes I, II, III, IV and V of the electron transport chain (left). Colour corresponds to the genetic interaction score (GI score) upon CRISPR knockdown of a pair of genes (row × column). The systems biology map (SBmap) is available: Horlbeck28_30033366. TMEM261 was found to be involved in the electron transport chain from this genetic interaction map. A Kaplan–Meier plot is shown demonstrating the prognosis of a patient with renal cancer based on high or low TMEM261 mRNA expression based on the median fragments per kilobase of exon per million reads (right). The logrank P value is shown. Data for the Kaplan–Meier plot were retrieved from the Human Protein Atlas. Similar results exist for endometrial cancer. b | Example SBmap, Bell16_21720365 (reF.), which was not enriched for any known biological processes and may have a potential role in human papillomavirus-related ovarian oncogenesis. c | Merged network diagram of the literature-curated pathway (LCpathway) ‘Hippo signalling’ and SBmap Xiong1_29983373 (reF.). Pink nodes indicate genes covered by both the SBmap and the matching LCpathway. Blue or green nodes indicate genes specific to the SBmap or LCpathway, respectively. Grey edges represent high-confidence (0.7 or greater) gene interactions from STRING. Pink edges represent novel interactions identified from affinity purification–tandem mass spectrometry. d | Wiring diagram showing positive feedback loops involving members of the RAS signalling pathway (RAS, MEK and ERK), WNT signalling pathway (glycogen synthase kinase 3β (GSK3β), destruction complex and β-catenin) and epithelial–mesenchymal transition pathway (Snail, RAF kinase inhibitor protein (RKIP) and protein kinase Cδ (PKCδ)), where the presence of feedback was identified through mathematical modelling. Black arrows represent canonical signalling interactions. Coloured arrows represent each of the four identified positive feedback loops. Top left panel of part a adapted with permission from Horlbeck et al., Elsevier. Part d adapted with permission from the American Association for Cancer Research: Shin, S.-Y. et al. Functional Roles of Multiple Feedback Loops in Extracellular Signal-Regulated Kinase and Wnt Signaling Pathways That Regulate Epithelial-Mesenchymal Transition. Cancer Res. 70, 6715–6724, https://doi.org/10.1158/0008–5472.CAN-10–1377 (2010).

Similar articles

Cited by

References

    1. Cong L et al. Multiplex genome engineering using CRISPR/Cas systems. Science 339, 819–823 (2013). - PMC - PubMed
    1. Mali P et al. RNA-guided human genome engineering via Cas9. Science 339, 823–826 (2013). - PMC - PubMed
    1. Goodwin S, McPherson JD & McCombie WR Coming of age: ten years of next-generation sequencing technologies. Nat. Rev. Genet. 17, 333–351 (2016). - PMC - PubMed
    1. Cox J & Mann M Quantitative, high-resolution proteomics for data-driven systems biology. Annu. Rev. Biochem. 80, 273–299 (2011). - PubMed
    1. LeCun Y, Bengio Y & Hinton G Deep learning. Nature 521, 436–444 (2015). - PubMed

Publication types