. 2020 Jul;19(7):797-806.
doi: 10.1038/s41563-020-0615-x. Epub 2020 Feb 17.

Reprogramming normal cells into tumour precursors requires ECM stiffness and oncogene-mediated changes of cell mechanical properties

Affiliations

Reprogramming normal cells into tumour precursors requires ECM stiffness and oncogene-mediated changes of cell mechanical properties

Tito Panciera et al. Nat Mater. 2020 Jul.

Erratum in

Abstract

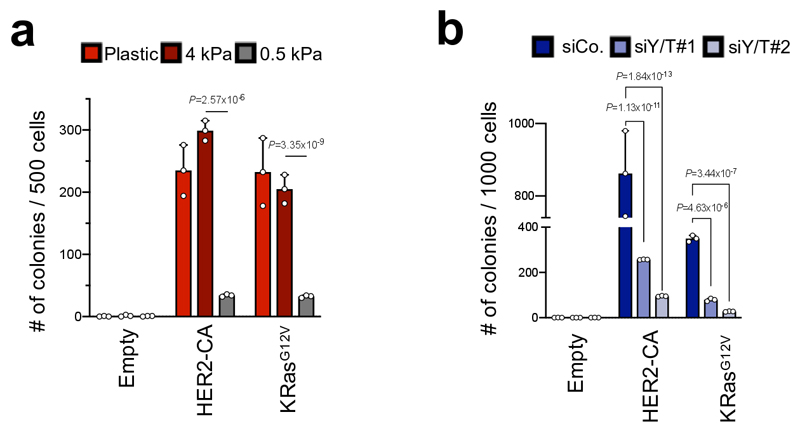
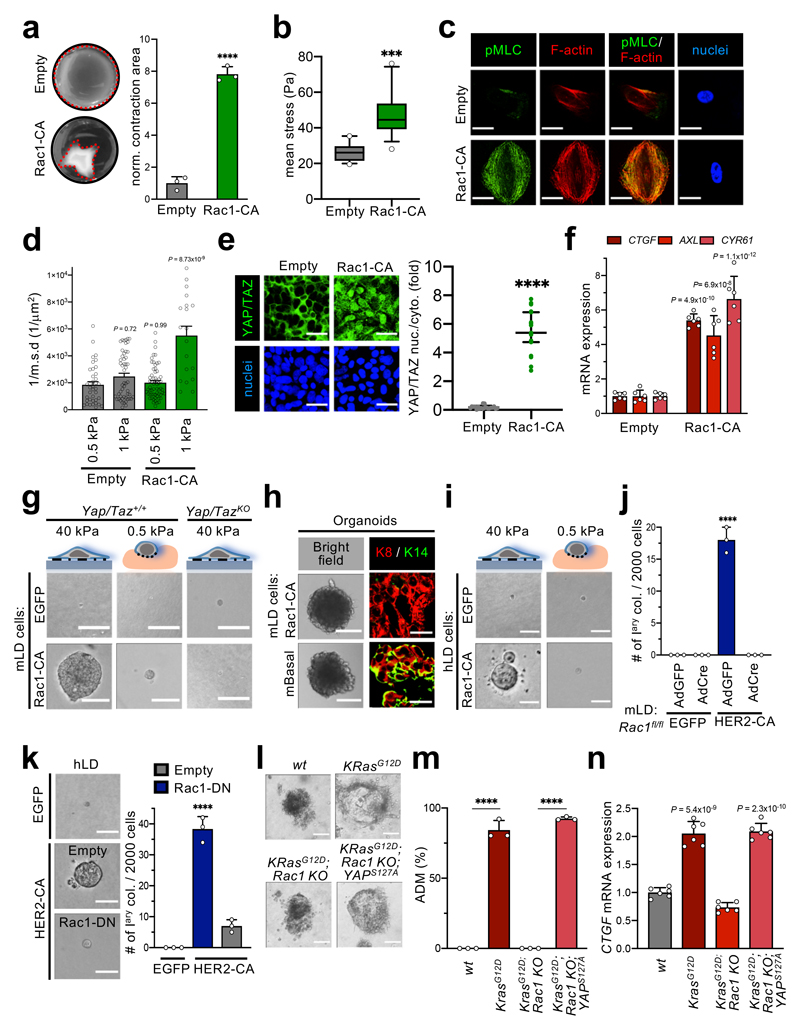
Defining the interplay between the genetic events and microenvironmental contexts necessary to initiate tumorigenesis in normal cells is a central endeavour in cancer biology. We found that receptor tyrosine kinase (RTK)-Ras oncogenes reprogram normal, freshly explanted primary mouse and human cells into tumour precursors, in a process requiring increased force transmission between oncogene-expressing cells and their surrounding extracellular matrix. Microenvironments approximating the normal softness of healthy tissues, or blunting cellular mechanotransduction, prevent oncogene-mediated cell reprogramming and tumour emergence. However, RTK-Ras oncogenes empower a disproportional cellular response to the mechanical properties of the cell's environment, such that when cells experience even subtle supra-physiological extracellular-matrix rigidity they are converted into tumour-initiating cells. These regulations rely on YAP/TAZ mechanotransduction, and YAP/TAZ target genes account for a large fraction of the transcriptional responses downstream of oncogenic signalling. This work lays the groundwork for exploiting oncogenic mechanosignalling as a vulnerability at the onset of tumorigenesis, including tumour prevention strategies.


Conflict of interest statement

Competing Financial Interests

The authors declare no competing interests.

Figures

Extended Data Fig. 1
Extended Data Fig. 1. Abnormal substrate rigidity is required for oncogenes to reprogram normal cells into tumorigenic ones
a, Schematic representation of the FACS purification strategy and of the experiments performed with mLD cells. LP: luminal progenitor cells. b, qRT-PCR analyses for the indicated basal and luminal mammary cell markers in mBasal, mLP, and mLD cells obtained by FACS, as in Extended Data Fig. 1a. Data are normalized to Gapdh and are referred to Basal cells levels for basal genes, and to LD cells levels for all the other luminal markers (each set to 1). Results are representative of n=3 independent experiments (each using mammary glands from n=20 mice) performed with similar results. c, Schematic representation of the FACS purification strategy and of the experiments performed with human primary mammary luminal cells. d, qRT-PCR analyses for the indicated basal and luminal mammary cell markers in human Basal, LP, and LD cells obtained by FACS, as in Extended Data Fig. 1c. Data are normalized to GAPDH and are referred to Basal cells levels for basal genes, and to LD cells levels for all the other luminal markers (each set to 1). Results are representative of n=3 independent experiments performed with similar results. e-h, Lower magnification images of experiments shown in Fig. 1a (e), in Fig. 1c (f), in Fig. 1f (g) and in Fig. 1g (h). Scale bars, 600 μm. i, Representative bright field and immunofluorescence images (n=3 independent experiments) of organoids formed by mLP cells expressing HER2-CA. K14 serves as marker of basal cell identity and K8 serves as marker of luminal cell identity. Scale bars, 400 μm, left and 17 μm, right. j, Quantifications of the frequency of different outgrowths emerging from fat pad injection of the same samples of Fig. 1i. Data are representative of n>5 independent samples. k, Representative GFP-immunofluorescence pictures (n>5 independent samples) of outgrowths depicted in Fig. 1i, showing that outgrowths emerge form injected mLD cells. Scale bar, 50 μm. l, Representative immunofluorescence images (n=3 independent experiments) of ex-vivo 3D outgrowths formed by mLD cells expressing HER2-CA, embedded in a collagen-based ECM and treated with conditioned media from Empty-vector (CM: Empty) or LOXL2-transduced C3H10T1/2 fibroblasts (CM: LOXL2). While HER2-expressing cells formed round spheroids/organoids in absence of LOXL2, those embedded in LOXL2-modified collagen formed highly proliferating and invasive outgrowths. This effect relied on LOXL2 enzymatic activity as it was abolished by concomitant treatment with LOX-inhibitor BAPN. Scale bars, 260 μm. m, Bright field and birefringence Picrosirius Red images of the same samples shown in Fig. 1i, showing LOX-L2 mediated increased fibrillar collagen deposition. Scale bars, 100 μm. Quantifications of total fibrillar collagen by birefringence signal in the same sections are presented as mean + s.d. of n=4 independent samples. ** p-value=7.13x10⁻³. n, Representative images and quantifications of colonies formed by mLD cells transduced with the indicated constructs. The expression of the sole integrinβ1 mutant is inconsequential for colony formation by mLD cells. Scale bars, 170 μm. Images and data are representative of n=4 independent experiments. Data are mean + s.d. **** p-value=4.03x10⁻⁶. o, Low magnification of the representative histological staining of the subcutaneous outgrowth shown in Fig. 1j (corresponding to the frame). P-values were calculated by one-way ANOVA with Sidak’s multiple comparisons test.
Extended Data Fig. 2
Extended Data Fig. 2. Ras/RTK oncogenes change the mechanical and material properties of cells
a, Representative images and quantifications of collagen contraction assays performed with control MCF10A cells transduced with empty vectors and embedded in 3-D collagen hydrogels with conditioned media obtained from control MCF10A cells (CM: Empty) or cells expressing KrasG12V (CM: KrasG12V) or HER2-CA (CM: HER2-CA). Compared with Fig. 2a, this shows that oncogene-mediated cell contractility does not rely on secreted factors. Images and data are representative of n=3 independent samples. Data are mean + s.d. b, Quantification of the colocalization of the cytoskeletal stainings for pMLC and F-actin shown in Fig. 2c. Data are as mean + s.d. of n=3 independent samples. c, Representative immunofluorescence images and quantifications of FA formation by colocalization of focal adhesion kinase (FAK) and Vinculin in MCF10A cells transduced with HER2-CA or KRasG12V. Scale bars, 24 μm. Images and data are representative of n=3 independent experiments. Data are mean + s.d. d, Representative immunofluorescence images and quantifications FA maturation by colocalization of phospho-focal adhesion kinase (pFAK) and Paxillin in MCF10A cells transduced with HER2-CA or KRasG12V. Scale bars, 24 μm. Images and data are representative of n=3 independent experiments. Data are mean + s.d. e, Representative pictures (n=3 independent experiments) and quantifications of proximity ligation assay (PLA) detecting the nuclear interaction between endogenous YAP and endogenous TEAD in control (Empty vector) MCF10A cells or in cells overexpressing KrasG12V or HER2-CA. Scale bars, 9 μm. Data are mean + s.d. of n>200 cells. **** p-value=10-15. f, Luciferase assay in post-confluent HEK293 cells transfected with a synthetic reporter for TEAD-dependent transcription (8xGTIIC-Lux) and with the indicated siRNAs and control (Empty) or oncogene-expressing vectors. Data are mean + s.d. of n= 3 independent samples. ****p-value=10-15. g, qRT-PCRs of the YAP/TAZ endogenous targets CTGF and AXL, in MCF10A cells transduced with the indicated oncogene-expressing vectors. Data are mean + s.d. of n= 3 independent samples. h, Collagen contraction assays performed with MCF10A cells transduced with the indicated vectors, transfected with control or YAP/TAZ targeted siRNAs, showing that YAP/TAZ are downstream of cell contractility induced by oncogenes. Data are mean + s.d. of n= 3 independent samples. Immunoblots are shown for validation of effective YAP/TAZ depletion. GAPDH serves as loading control. i, Representative immunofluorescence images and quantifications of YAP/TAZ localization in MCF10A cells transduced with empty or oncogene-expressing vectors, and seeded on 40 kPa hydrogels. Scale bars, 8 μm. Data are mean +/- s.d. of n>17 independent samples. j, qRT-PCRs of the YAP/TAZ endogenous target CYR61 in MCF10A cells transduced with the indicated vectors and seeded on 0.5 or on 1 kPa hydrogels, as in Fig. 2g. Data are mean + s.d. of n= 3 independent samples. k, Representative immunofluorescence images of F-actin of the same MCF10A cells shown in Fig. 2f to visualize cell shape. F-actin was stained with fluorescently-labeled phalloidin and nuclei were counterstained with DAPI. Scale bars, 16 μm. P-values were calculated by unpaired two-sided Student’s t-test (a), one-way ANOVA with Sidak’s multiple comparisons test (b-f) or two-way ANOVA with Sidak’s multiple comparisons test (g,h, j).
Extended Data Fig. 3
Extended Data Fig. 3. Oncogenes empower a disproportional cellular response to ECM mechanical properties to drive pancreatic tumorigenesis
a, Schematic representation of the experimental strategy employed to study pancreatic ADM ex vivo. See also methods section for details. b, Schematic representation of the chemistry of designer hydrogels employed in the experiments of Fig. 3a-c, Fig. 4c, Extended Data Fig. 3c and Extended Data Fig. 4e, f (see Methods). SH, sulfhydryl group; PEGDA, Poly(ethylene glycol) diacrylate. Hydrogel stiffness was raised by increasing the PEGDA crosslinker concentration, without changing Gelatin and Hyaluronic Acid content. c, Quantification of nuclear YAP/TAZ levels in pancreatic acini shown in Fig. 3c Data mean + s.d. of n=4 independent samples. ****p-value=4.03x10⁻⁷. d, qRT-PCRs assessing the expression levels of the acinar marker Amylase (Amy) and of the ductal markers K19 in pancreatic acini of the indicated genotypes, showing that KRas-expressing acini treated with FA or F-actin inhibitors (as in Fig. 3d) remain fully differentiated recapitulating the effects of a soft ECM. Data are mean + s.d. of n= 3 independent experiments. ns, p-value=0.99. Data are normalized to 18-s rRNA. e, Quantification of nuclear YAP/TAZ levels in pancreatic acini shown in Fig. 3d, showing that oncogenic KRas promoted YAP/TAZ activation in a manner opposed by FA and F-actin inhibitors. Data are mean + s.d. of n>4 independent samples. **** p-value=10-15. f, Dot-plot depicting cell viability assays comparing MCF10A cells treated with the indicated mechano-inhibitory drugs (at maximal doses, see methods for details) with untreated cells. Drug treatments employed throughout the study do not affect cell viability, at difference with Puromycin (Puro.) treatment, shown as positive control for reduced cell viability. Data are mean +/- s.d. of n=5 independent samples. g, Schematic representation of the experimental strategy employed to oppose either ECM stiffness (by BAPN treatment) or intracellular contractility (by Fasudil treatment) at the onset of pancreatic tumorigenesis in vivo. h, Quantifications of tumor areas in the samples depicted in Fig. 3f. Data are mean +/- s.d. of n=3 independent samples. i, Quantifications of pMLC stainings shown in Fig. 3f, showing that BAPN treatment normalized the tensional state of oncogene-expressing pancreatic cells. Data are mean + s.d. of n=3 independent samples. ***p-value=6.6x10⁻⁴. j, Representative bright field and birefringence images of Picrosirius red staining of the same samples shown in Fig. 3f, showing that BAPN treatment inhibited deposition and fibrillar organization of collagen. Quantifications of total fibrillar collagen obtained from birefringence are presented as mean + s.d. of n=3 independent samples. ****p-value=1.80x10⁻⁵. k, Quantifications of tumor areas in the samples depicted in Fig. 3g. Data are mean +/- s.d. l, Quantifications of pMLC stainings shown in Fig. 3g. Data are mean + s.d. of n=3 independent samples. ****p-value=8.88x10⁻⁵. P-values were calculated by unpaired two-sided Student’s t-test (c) and by one-way ANOVA with Sidak’s multiple comparisons test (d-f,g,i,l).
Extended Data Fig. 4
Extended Data Fig. 4. YAP/TAZ are the nuclear effectors downstream of the changes in the cell's mechanical and material properties induced by oncogenes
a, Representative H&E stainings and quantifications of tumor areas showing that initiation of pancreatic tumorigenesis form acinar cells is dependent on YAP/TAZ. Development of neoplastic lesions was assessed 6 months after tamoxifen administration to mice of the following genotypes: Ptf1aCreERTM(wt), Ptf1aCreERTM;KRas+/LSL-G12D(KRasG12D), Ptf1aCreERTM;KRas+/LSLG12D;Yapfl/fl;Tazfl/fl (KRasG12D;Y/T KO), Ptf1aCreERTM;KRas+/LSLG12D;p53+/LSLR172H (KRasG12D;p53R172H), Ptf1aCreERTM;KRas+/LSLG12D;p53+/LSL-R172H;Yapfl/fl;Tazfl/fl(KRasG12D;p53R172H;Y/T KO). Data are presented as mean +/- s.d. of n=3 independent samples. These experiments are similar to what reported in Ref. , although in a different experimental setting, as we tested Yap/Taz requirement in absence of experimentally induced pancreatitis. b, Immunoblot validating effective Yap and Taz in vivo knock out in pancreata shown in a. GAPDH serves as loading control. Results are representative of n=3 independent experiments. c, Quantifications of the percentage of ADM events in pancreatic acini depicted in Fig. 4b. Data are presented as mean + s.d. of n=5 independent samples.****p-value=10-15. d, qRT-PCRs validating effective Yap and Taz ex vivo knock out in pancreatic acini shown in Fig. 4b. Data are presented as mean + s.d. of n=3 independent samples. Data are normalized to 18-s rRNA. e, Quantifications of the percentage of ADM events in pancreatic acini depicted in Fig. 4c. Data are presented as mean + s.d. of n=3 independent samples. f, qRT-PCRs validating YAPS127A overexpression in pancreatic acini shown in Fig. 4c. Data are mean + s.d. of n=3 independent samples. Data are normalized to 18-s rRNA. g, Quantifications of the percentage of ADM events in pancreatic acini depicted in Fig. 4d. Data are mean + s.d. of n=3 independent samples. ****p-value=10-15. h, qRT-PCRs validating YAPS127A overexpression in pancreatic acini shown in Fig. 4d. Data are mean + s.d. of n=3 independent samples. Data are normalized to 18-s rRNA. i, Pie chart of the main categories of GO entries associated to the HER2-induced genes that are dependent on YAP/TAZ and substrate stiffness, derived from the RNA-seq of Fig. 4e. Gene Ontology (GO) analysis was performed on the list of HER2-induced genes whose expression is dependent on YAP/TAZ and substrate stiffness (Supplementary Table 1). Of these genes, about 30% are linked to processes related to Cell Cycle progression, whereas others were classified as genes involved in Cell Fate Specification (10%), Signal Transduction (4%), RNA processing (22%) and Transcription (24%). P-values were calculated by unpaired two-sided Student’s t-test (d), one-way ANOVA with Sidak’s multiple comparisons test (c,e,f,h) and two-way ANOVA with Sidak’s multiple comparisons test (g).
Extended Data Fig. 5
Extended Data Fig. 5. Oncogenes modify the cell's mechanical properties through Rac1 activation
a, Western blots showing that the levels of YAP phosphorylation on the key LATS target residue S127 do not decrease after HER2-CA or KRasG12V expression in MCF10A cells. GAPDH serves as loading control. Phosphorylated vs. total YAP signal ratio (Empty: 1,19; HER2-CA: 1,24; KRasG12V: 0,93) was quantified by ImageJ analysis software. Results are representative of n=3 independent experiments, performed with similar results. b, Western blots showing that HER2-CA or KRasG12V expression in MCF10A cells does not affect the levels of the active pool of LATS kinases, as assessed by monitoring LATS1-activating phosphorylation on its key residue Thr1079. GAPDH serves as loading control. Phosphorylated vs. total LATS signal ratio (Empty: 1,28; HER2-CA: 1,12; KRasG12V: 1,11) was quantified by ImageJ analysis software. Results are representative of n=3 independent experiments, performed with similar results. c, Quantification of the colocalization of the cytoskeletal stainings for pMLC and F-actin shown in Fig. 5c. Data are as mean + s.d. of n=3 independent samples. ****p-value=2.42x10⁻⁶. d, Representative immunofluorescence images and quantifications showing that MCF10A cells transduced with Rac1-CA display increased formation of focal adhesion as visualized and quantified by colocalization of focal adhesion kinase (FAK) and Vinculin. Scale bars, 24 μm. Images and data are representative of n=3 independent experiments. Data are mean + s.d. ****p-value=6.27x10⁻⁴. e, Representative immunofluorescence images and quantifications showing that MCF10A cells transduced with HER2-CA or KRasG12V display increased maturation of focal adhesions as visualized and quantified by colocalization of phospho-focal adhesion kinase (pFAK) and Paxillin. Scale bars, 24 μm. Images and data are representative of n=3 independent experiments. Data are mean + s.d. *** p-value=2.41x10⁻⁴. f, Representative images and quantifications of collagen contraction assays performed with MCF10A cells transduced with Rac1-CA and treated with the indicated drugs. MCF10A cells transduced with empty vector are shown as negative control. Data are mean + s.d. of n>3 independent samples. ****p-value=4.51x10⁻⁶. g, Quantifications of the primary mammary colonies formed from Yap+/+;Taz+/+ or YapKO;TazKO mLD cells, treated as in Fig. 5g. Data are mean + s.d. of n= 3 independent experiments. h, Quantifications of the secondary and tertiary colonies derived from primary colonies formed by Rac1-CA-transduced mLD cells. Data are mean + s.d. of n= 3 independent experiments. i, Quantifications of colonies formed by hLD cells treated as in Fig. 5i. Data are mean + s.d. of n= 3 independent experiments. ****p-value=1.18x10⁻⁶. j, Luciferase assay in post-confluent HEK293 cells transfected with 8xGTIIC-Lux, and with empty vector or the indicated oncogene expressing vectors, alone or in combination with vectors coding for Rac1-DN. Data are mean + s.d. of n= 3 independent samples. k, qRT-PCRs of the ductal marker K19 in the pancreatic acini depicted in Fig 5l. Data are mean + s.d. of n=3 independent samples. l, qRT-PCRs showing effective YAPS127A overexpression and Rac1 depletion in pancreatic acini depicted in Fig. 5l. Data are presented as mean + s.d. of n=3 independent samples. m, Representative bright field images and quantifications of ADM events of pancreatic acini of the indicated genotypes treated with the Rac-specific GEFs Tiam1/Trio inhibitor NSC23766 (100 μM), or left untreated (Control). Images and data are representative of n=3 independent experiments. Scale bars, 70 μm. Data are mean + s.d. **** p-value=3.2x10⁻⁵. P-values were calculated by one-way ANOVA with Sidak’s multiple comparisons test (c-g,i,l,m) and two-way ANOVA with Sidak’s multiple comparisons test (j).
Extended Data Fig. 6
Extended Data Fig. 6. Transformation of immortalized cells requires sufficient substrate rigidity and YAP/TAZ activity
a, Quantifications of colonies formed by control or oncogene-expressing MCF10A cells, cultured at the three indicated stiffnesses before embedding in agar. Data are mean + s.d. of n=3 independent samples. Controls showing the requirement of YAP/TAZ in similar cell transformation assays are shown in b. b, Quantifications of colonies formed by control or oncogene-expressing MCF10A cells, transfected with the indicated siRNAs before embedding in agar. YAP/TAZ depletion blunts oncogene-induced cell transformation. Data are mean + s.d. of n=3 independent samples. P-values were calculated by two-way ANOVA with Sidak’s multiple comparisons test.
Extended Data Fig. 7
Extended Data Fig. 7. Rheological measurements validating the purely elastic behavior of PAA hydrogels used in the study
a, Rheological measurements showing Storage (G’) and loss (G”) moduli of PAA hydrogels used in the study as function of the frequency (from 0.01 to 1.259 Hz) in a constant strain mode. Young’s modulus E=3G, is indicated above each panel. Results are representative of n=3 independent experiments, performed with similar results.
Fig. 1
Fig. 1. Abnormal substrate rigidity is required for oncogenes to reprogram normal mammary cells into tumorigenic ones.
a,b, Representative images and quantifications of murine LD (mLD)-derived colonies. Murine basal cells (mBasal)-derived colonies are shown for comparison. Scale bars, 170 μm. ****p-value=9.9x10⁻⁵. See also Extended Data Fig. 1b and 1e. c, d, Representative images (c) and quantifications (d) of colonies formed by human LD (hLD) cells. Colonies formed by human mammary basal cells (hBasal) are shown for comparison. Scale bars, 170 μm. ****p-value=2.0x10⁻⁵. See also Extended Data Fig. 1d, f. e, Representative bright field and immunofluorescence images (n= 3 independent experiments) of organoids formed by mLD cells expressing HER2-CA. Organoids formed by mBasal cells are shown for comparison. K14 and K8 serve as markers of basal and luminal cell identity, respectively. Scale bars, 400 μm, left and 17 μm, right. f-h, Representative images and quantifications of solid colonies formed by mLD (f), hLD (g) or murine LP (mLP) (h) cells, cultured on 40 kPa or on 0.5 kPa hydrogels, and then seeded in clonogenic medium. Scale bars, 170 μm. **** p-value=5.2x10⁻¹² (f),1.69x10-11 (g) and 1.68x10⁻¹² (h). See also Extended Data Fig. 1g, h. i, Representative pictures (n=5) of the in vivo outgrowths generated from mLD cells. T1/2, C3H10T1/2 fibroblasts. See Extended Data Fig. 1m, demonstrating increased fibrillar collagen organization by LOX-L2. j, Representative images (n=4) of subcutaneous tumors and lung-disseminated GFP-traced tumor cells derived from indicated hLD cells. Scale bars, 80 μm for primary tumor and 25 μm for lung. k, Quantifications of the volume of subcutaneous outgrowths generated from control or the indicated reprogrammed hLDs injected within hydrogels of the indicated stiffness. Data are mean +/- s.d. of n=4 independent experiments. a,b,d, f-h, Data are mean + s.d. of n=3 biologically independent samples. P-values were determined by unpaired two-sided Student’s t-test (a, d) or one-way ANOVA with Sidak’s multiple comparisons test (f-h).
Fig. 2
Fig. 2. Ras/RTK oncogenes change the mechanical and material properties of cells.
a, Representative images (n=3) and quantifications of collagen contraction assays performed with MCF10A cells. Data are mean + s.d. of n= 3 biologically independent samples. (Empty is empty vector). See controls in Extended Data Fig. 2a. b, Traction force microscopy measurements of mean stresses exerted by the indicated MCF10A cells on 3 kPa substrates. Data are box-and-whiskers plots (whiskers: 10th to 90th percentile; box: from 25th to 75th percentile; line within the box: median) of n>12 independent samples. ** p-value=0.0034, * p-value=0.049. c, Representative immunofluorescence images for pMLC of the indicated MCF10A cells. Scale bars, 24 μm. Images are representative of n=3 independent experiments. Quantifications are in Extended Data Fig. 2b. d, Representative immunofluorescence images and quantifications of the subcellular localization of YAP/TAZ in post-confluent MCF10A cells. Scale bars, 16 μm. Data are mean +/- s.d. of n>17 independent samples. **** p-value=10-15. YAP/TAZ are downstream of oncogene-induced contractility (Extended Data Fig. 2h). e, Particle-tracking microrheology of the indicated MCF10A cells seeded on 0.5 kPa and 1 kPa hydrogels. Data are mean + s.d. of n>35 biologically independent samples. f, Representative immunofluorescence images and quantifications of YAP/TAZ localization in single MCF10A cells on 0.5 and 1 kPa hydrogels. Scale bars, 8 μm. Data are mean +/- s.d. of n>17 independent samples. See also Extended Data Fig. 2i, k. g, qRT-PCRs assessing the expression levels of the YAP/TAZ endogenous target CTGF in MCF10A cells seeded on 0.5 or on 1 kPa hydrogels. Data are mean + s.d. of n= 3 biologically independent samples. P-values were determined by unpaired two-sided t-test (a, b) or one-way ANOVA with Sidak’s (d-g) multiple comparisons test.
Fig. 3
Fig. 3. Oncogenes empower a disproportional cellular response to ECM mechanical properties to drive pancreatic tumorigenesis.
a, Representative bright field images and quantifications of R26-rtTAM2; KRasG12D pancreatic acini embedded in 3D hydrogels. Images are representative of n=3 biologically independent experiments. Scale bars, 200 μm. Data are mean + s.d. b, qRT-PCRs for the differentiated acinar cells marker Amylase (Amy) and the ductal/progenitor markers K19 and Sox9 in pancreatic acini, treated as in (a). Data are presented as mean + s.d. of n=3 independent samples. ****p-value=2.39x10⁻⁶. Data are normalized to 18-S rRNA. c, Representative YAP/TAZ immunofluorescence pictures (n=3) of pancreatic acini expressing KRasG12D and embedded in 0.1 kPa or 0.5 kPa hydrogels, as in (a). Scale bars, 50 μm. d, Representative bright field and YAP/TAZ immunofluorescence pictures of the indicated pancreatic acini treated with Defactinib or cytochalasin-D (Cyto.D). Images are representative of n=3 biologically independent experiments. Scale bars, 400 μm in top panels and 50 μm in bottom panels. e, Quantifications of the percentage of ADM events in samples treated as in (d). Data are presented as mean + s.d. of n=3 independent samples. ****p-value=10-15. See controls in Extended Data Fig. 3f. f, g, Representative (n=3 independent samples) histological stainings, YAP/TAZ immunohistochemical and pMLC immunofluorescence images of the indicated pancreata treated with the LOX-inhibitor BAPN (f, see scheme of Extended Data Fig. 3g) or with the ROCK inhibitor Fasudil (g). Genotypes analyzed were: Ptf1aCreERTM(wt), Ptf1aCreERTM;KRas+/LSL-G12D(KRasG12D), Ptf1aCreERTM;KRas+/LSL-G12D;p53+/LSL-R172H(KRasG12D; p53R172H). Scale bars, 100 μm for histological and immunohistochemical stainings, 19 μm for immunofluorescence. See also Extended Data Fig. 3f-l. P-values were calculated by Sidak’s (a,b,e) multiple comparisons tests.
Fig. 4
Fig. 4. YAP/TAZ are the nuclear effectors downstream of the changes in the cell's mechanical and material properties induced by oncogenes.
a, Quantifications of the mammary colonies formed by mLD cells derived from Yapfl/fl;Tazfl/fl mice, infected with AdCre or AdGFP, and transduced with lentiviral constructs expressing EGFP or HER2-CA. Data are mean + s.d. of n= 3 biologically independent experiments. ****p-value=3,66x10⁻¹⁰, one-way ANOVA with Sidak’s multiple comparisons test. b, Representative bright field and Ki67 immunofluorescence pictures of KRas+/LSL-G12D (KRasG12D) or KRas+/LSL-G12D;Yapfl/fl ;Tazfl/fl (KRasG12D;Yap/Taz KO) pancreatic acini. Images are representative of 6 biologically independent experiments. Scale bars, 50 μm. See controls in Extended Data Fig. 4d. c, Representative bright field images of R26-rtTAM2; KRasG12D (KRasG12D) or R26-rtTAM2; KRasG12D; tetOYapS127A (KRasG12D; YAPS127A) pancreatic acini embedded in 3D hydrogels of increasing stiffness. Images are representative of n=3 biologically independent experiments. Panels show the same set of controls related to Fig. 3a. Scale bars, 200 μm. d, Representative bright field images of wild-type, KRasG12D, or KRasG12D;YAPS127A pancreatic acini treated with Defactinib or Dasatinib. Images are representative of at n=3 biologically independent experiments. Panels show the same set of controls related to Fig. 3d. Scale bars, 400 μm. For c and d, see controls of YAP expression in Extended Data Fig. 4h, f. e, Hierarchical clustering of gene expression profiles from RNA-seq data of control (Empty vector) MCF10A cells (lane 2), HER2-CA expressing cells plated on stiff substrates and transfected with Control siRNA (siCo, lane 1) or YAP/TAZ siRNAs (siY/T, lane 4), or HER2-CA cells cultured on 0.5 kPa hydrogels (lane 3). The heatmap shows row-wise standardized expression of genes significantly upregulated (fold change ≥1.33, Benjamini-Hochberg FDR ≤5%) in MCF10A cells by HER2-CA in standard culture conditions. Genes are ordered according to decreasing average expression in HER2-CA expressing cells plated on stiff substrates (lane 1).
Fig. 5
Fig. 5. Oncogenes modify the cell's mechanical properties through Rac1 activation.
a, Rac1-induced MCF10A collagen contraction assays. Data are mean + s.d. of n= 3 independent samples. ****p-value=4,56x10⁻⁵. b, Traction force microscopy measurements of MCF10A cells on 3 kPa substrates. Control (Empty) data are the same of Fig. 2b. Data are box-and-whiskers plots (whiskers: 10th to 90th percentile; box: from 25th to 75th percentile; line within the box: median) of n>12 independent samples. ***p-value=2,80x10⁻⁵. c, Representative pMLC immunofluorescence images (n=3) of MCF10A cells. Scale bars, 40 μm. d, Particle-tracking microrheology of MCF10A cells seeded on 0.5 kPa and 1 kPa hydrogels. Control (Empty) data are the same of Fig. 2e. Data are mean + s.d. of n>19 independent samples. e, YAP/TAZ localization. Data are mean +/- s.d. of n>19. Scale bars, 38 μm. **** p-value=10-15. f, qRT-PCRs of YAP/TAZ targets in MCF10A cells seeded on 1 kPa hydrogels. Data are mean + s.d. of n=6 independent samples. Data are normalized to GAPDH. g, Representative images (n=3) of Yap+/+;Taz+/+ or YapKO;TazKO mLD cells cultured on 40 kPa or on 0.5 kPa hydrogels, and then seeded in clonogenic medium. Scale bars, 170 μm. h, Representative bright field and immunofluorescence images (n= 3) of Rac1-CA-expressing mLD organoids and mBasal organoids, as in Fig. 1e. Scale bars, 400 μm, left 17 μm, right. i, Representative images (n=3) of hLD cells and outgrowths on 40 kPa or on 0.5 kPa hydrogels. Scale bars, 170 μm. j, Quantifications of the colonies formed by Rac1fl/fl mLD cells. Data are mean + s.d. of n= 3 independent experiments. ****p-value=1.14x10⁻⁷. k, Representative images (n=3) and quantifications of colonies formed by hLD cells expressing Rac1-DN. Scale bars, 170 μm. Data are mean + s.d. of n=3 independent samples.****p-value=1.84x10⁻⁵. l, m, Representative bright field images (n=3) (l) and quantifications (m) of ADM events of pancreatic acini of the indicated genotypes (see methods). Scale bars, 70 μm. Data are mean + s.d. of n= 3 independent experiments. ****p-value=5.25x10⁻⁹. n, qRT-PCRs of YAP/TAZ endogenous target Ctgf, in pancreatic acini treated as in l. Data are presented as mean + s.d. of n=6 independent samples. Data are normalized to 18-S rRNA. See also Extended Data Fig. 5k, l. P-values were calculated by unpaired two-sided t-test (a,b,e) and by one-way ANOVA with Sidak’s multiple comparisons test (d,f,j,k,m,n).

Comment in

References

    1. Martincorena I, et al. Tumor evolution. High burden and pervasive positive selection of somatic mutations in normal human skin. Science. 2015;348:880–886. doi: 10.1126/science.aaa6806. - DOI - PMC - PubMed
    1. Yokoyama A, et al. Age-related remodelling of oesophageal epithelia by mutated cancer drivers. Nature. 2019;565:312–317. doi: 10.1038/s41586-018-0811-x. - DOI - PubMed
    1. Lee-Six H, et al. The landscape of somatic mutation in normal colorectal epithelial cells. Nature. 2019;574:532–537. doi: 10.1038/s41586-019-1672-7. - DOI - PubMed
    1. Panciera T, Azzolin L, Cordenonsi M, Piccolo S. Mechanobiology of YAP and TAZ in physiology and disease. Nat Rev Mol Cell Biol. 2017;18:758–770. doi: 10.1038/nrm.2017.87. - DOI - PMC - PubMed
    1. Humphrey JD, Dufresne ER, Schwartz MA. Mechanotransduction and extracellular matrix homeostasis. Nat Rev Mol Cell Biol. 2014;15:802–812. doi: 10.1038/nrm3896. - DOI - PMC - PubMed

Publication types