. 2020 Mar;21(3):331-342.
doi: 10.1038/s41590-020-0598-4. Epub 2020 Feb 17.

Germinal center B cells selectively oxidize fatty acids for energy while conducting minimal glycolysis

Affiliations

Germinal center B cells selectively oxidize fatty acids for energy while conducting minimal glycolysis

Florian J Weisel et al. Nat Immunol. 2020 Mar.

Abstract

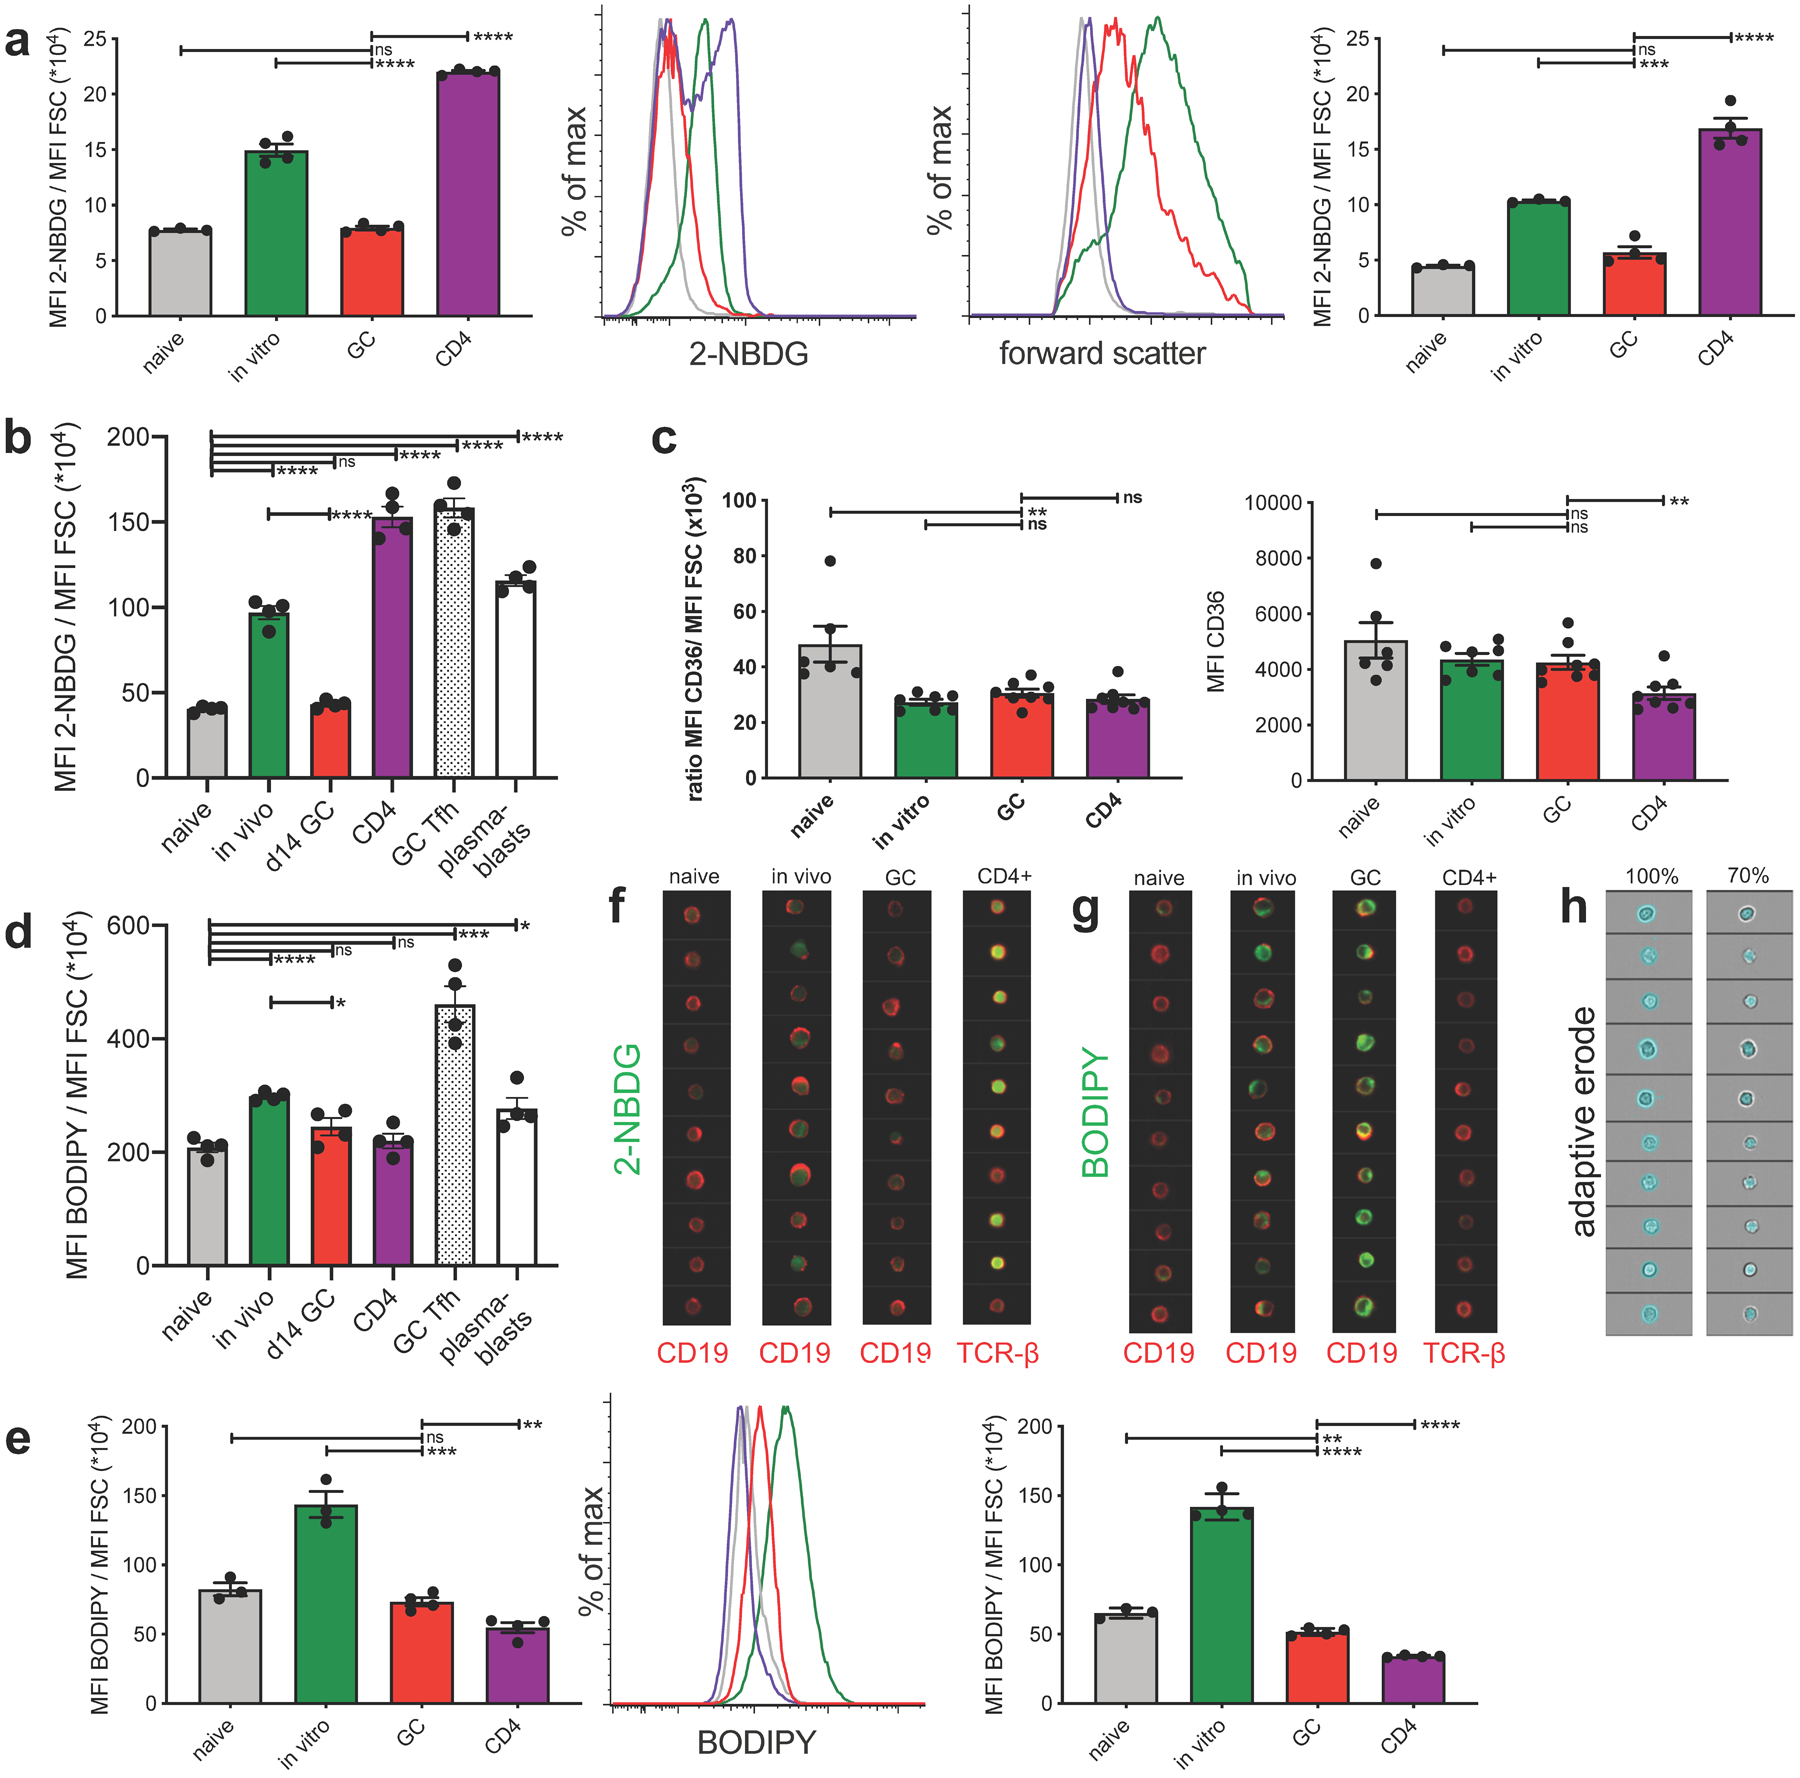
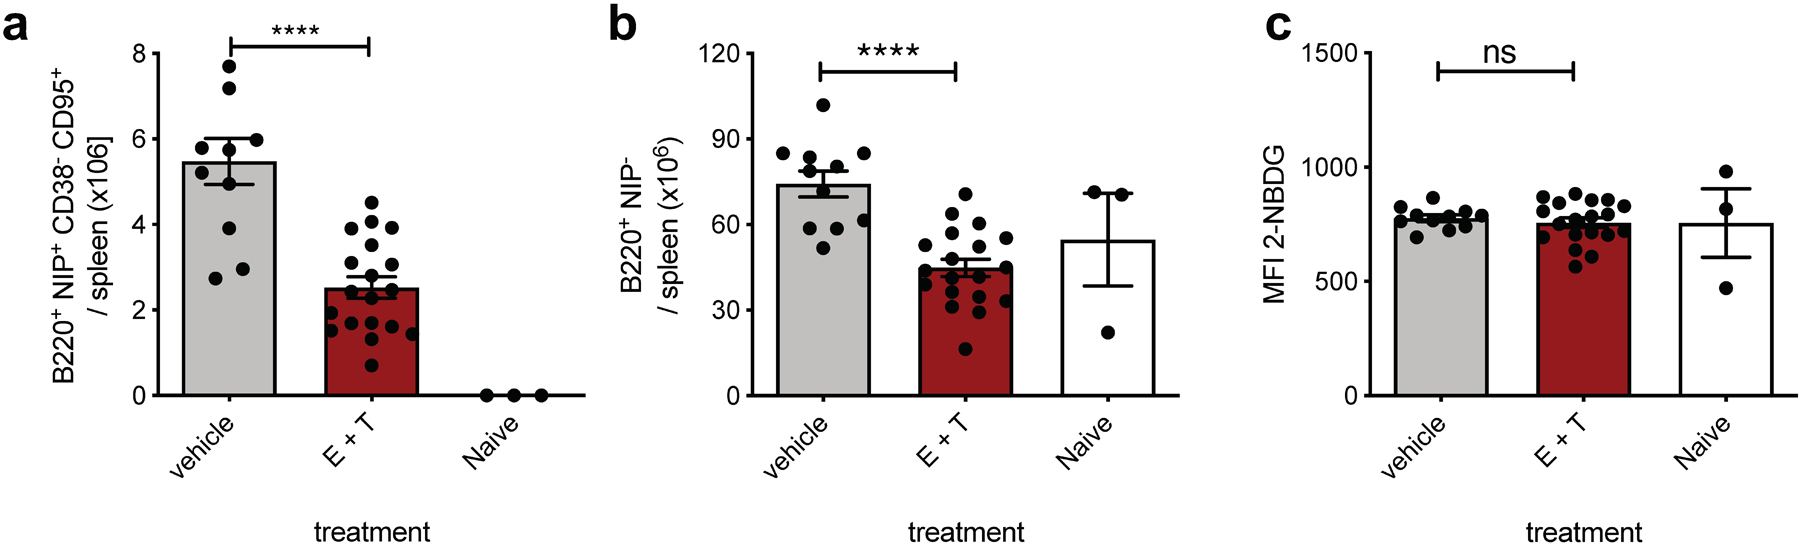
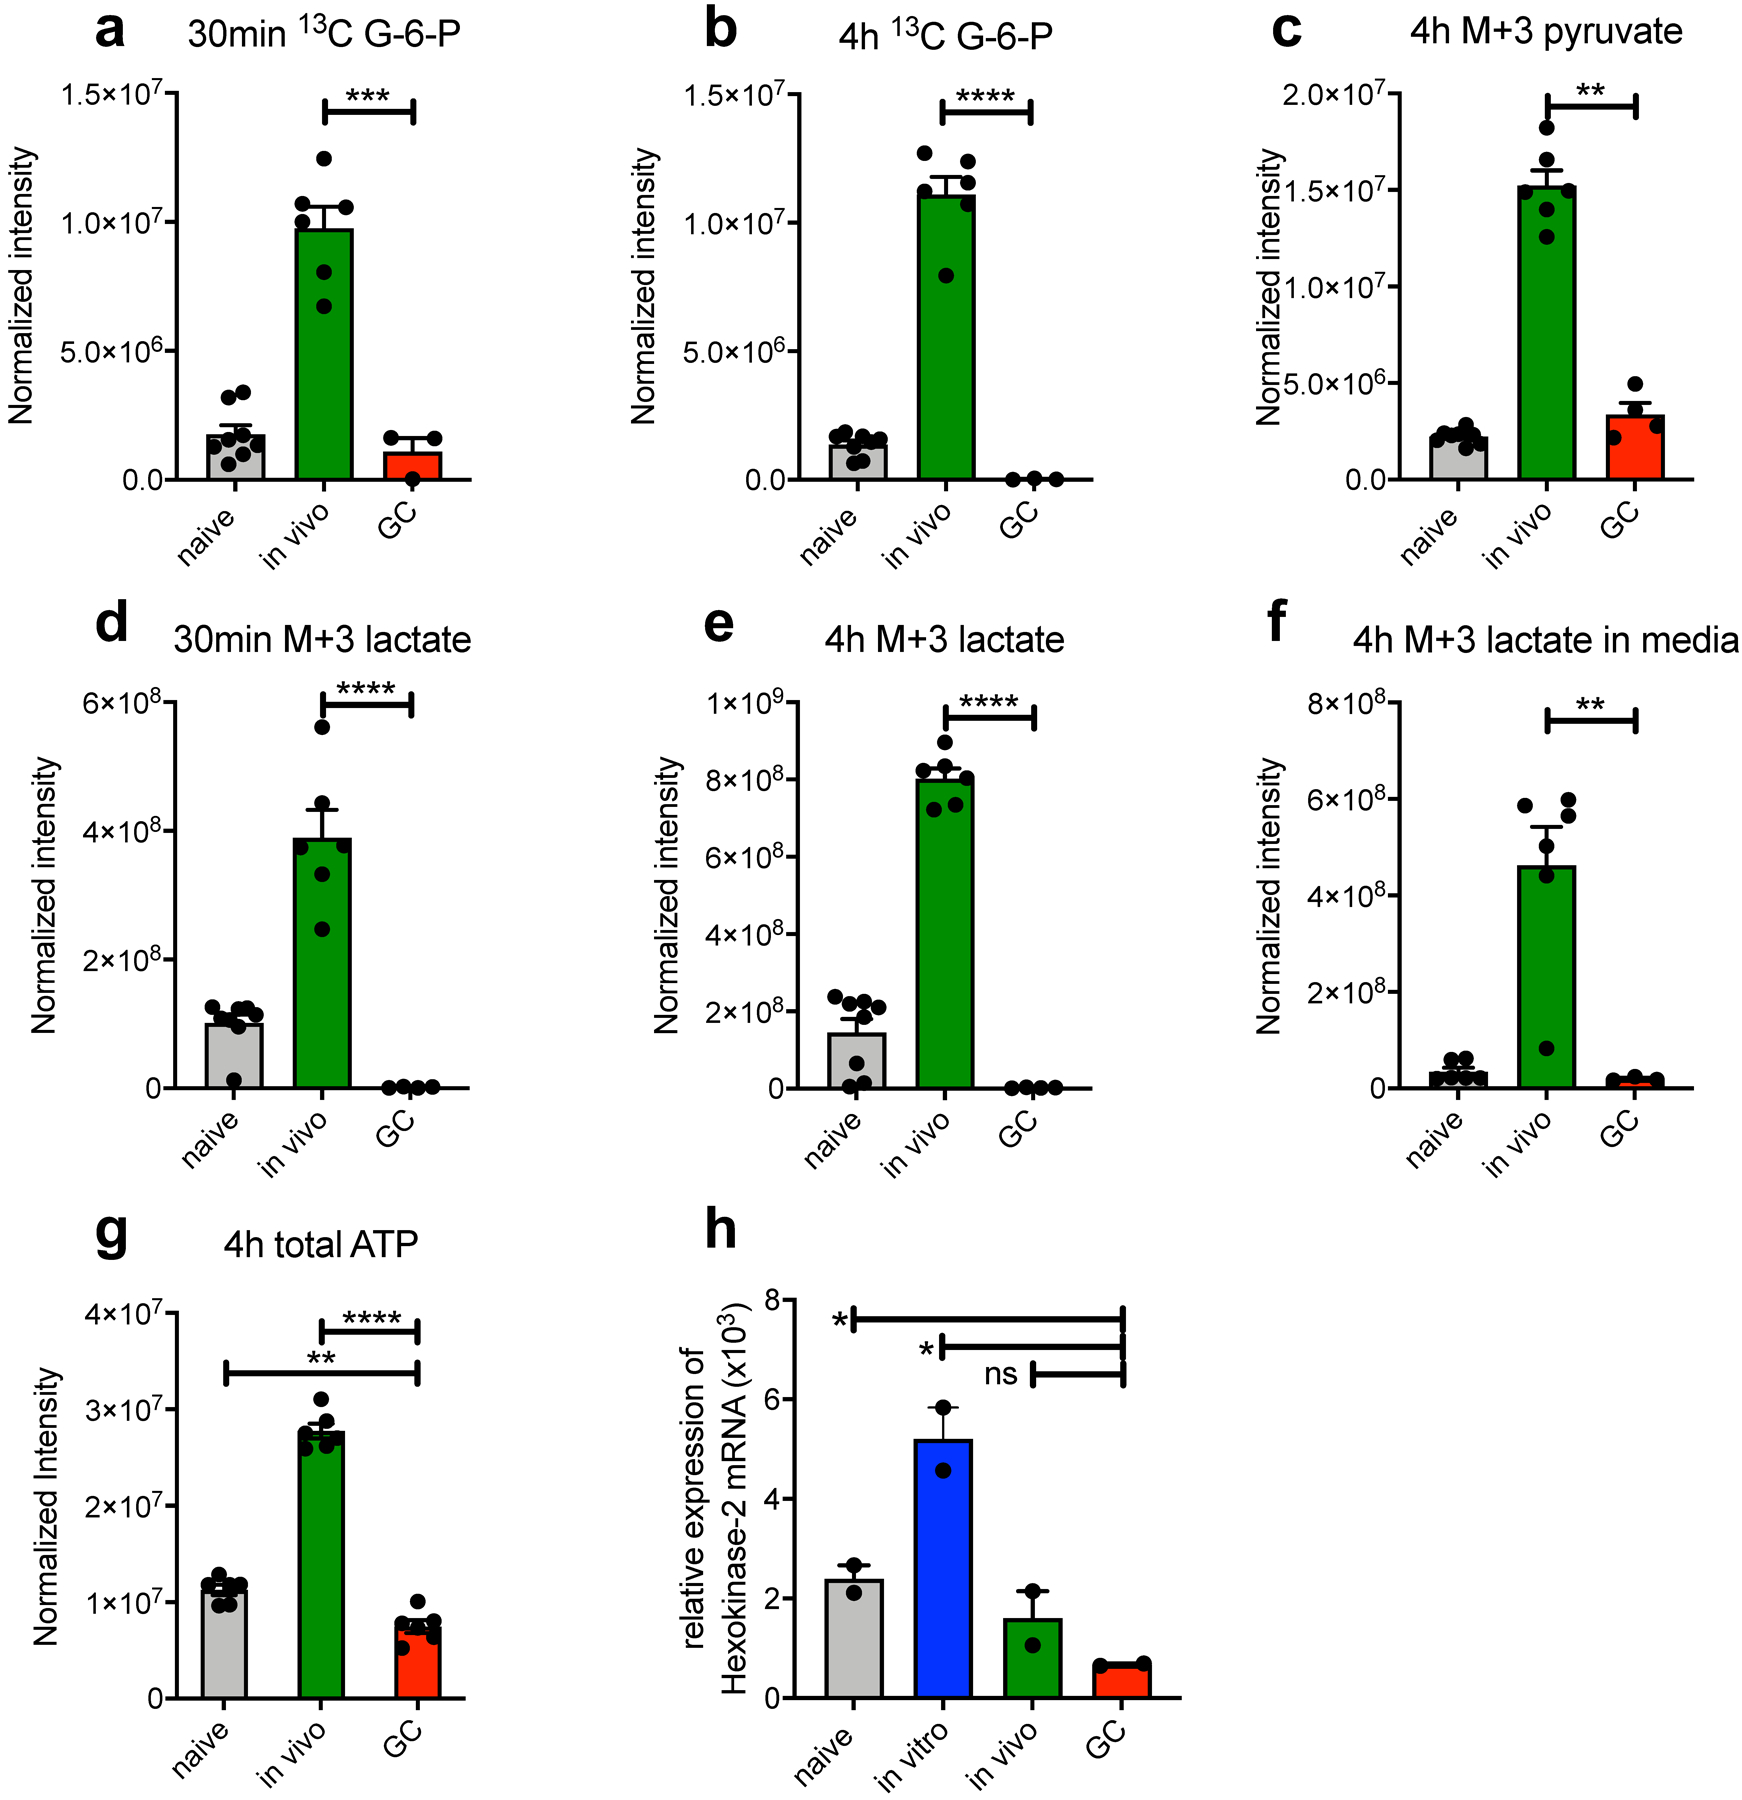
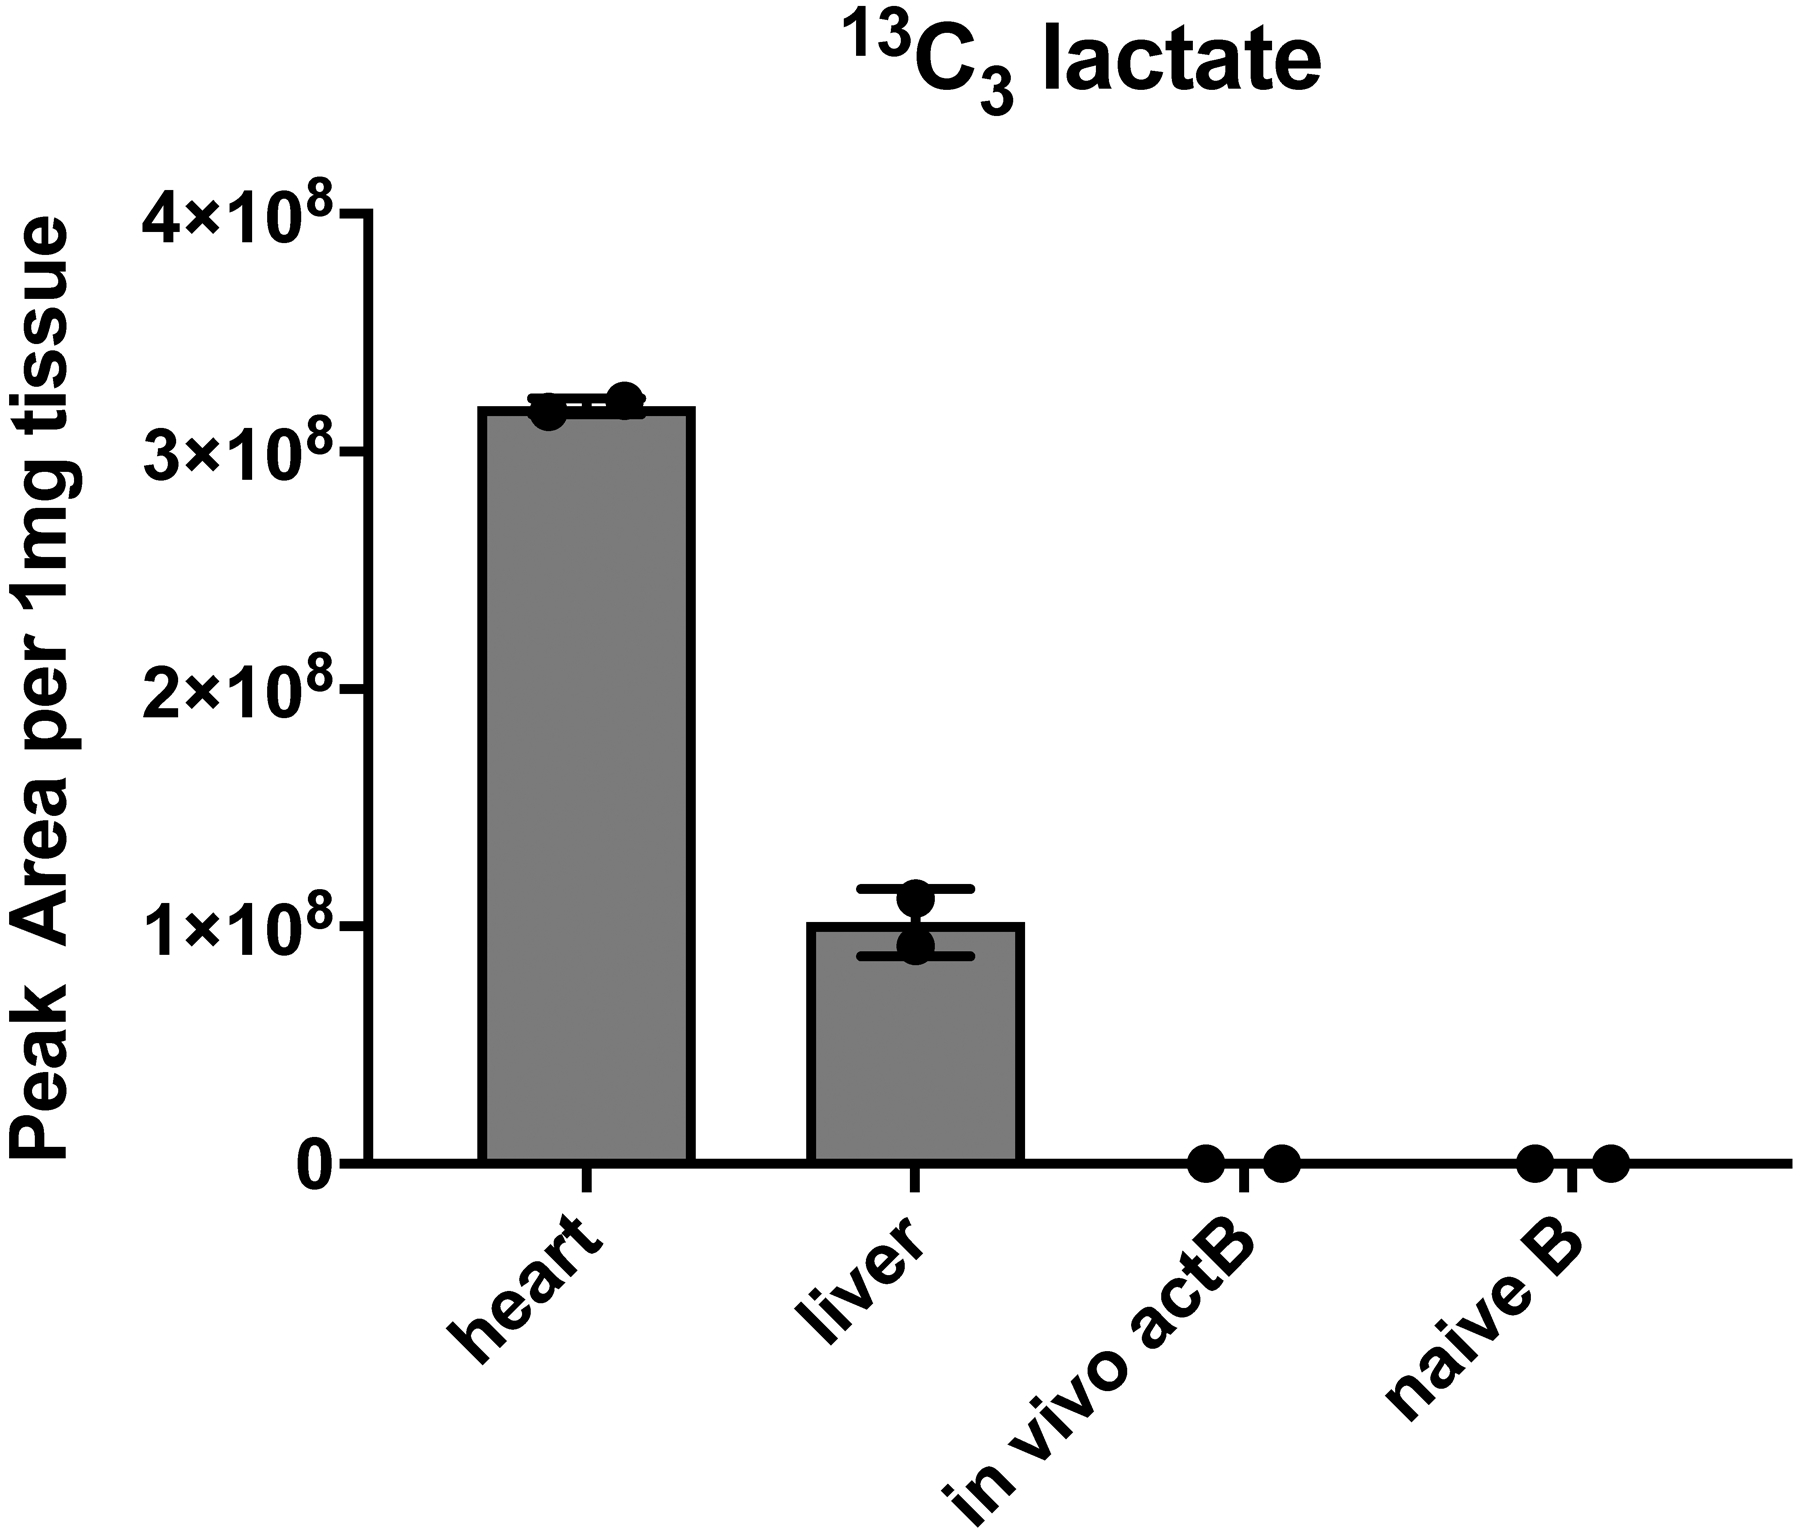
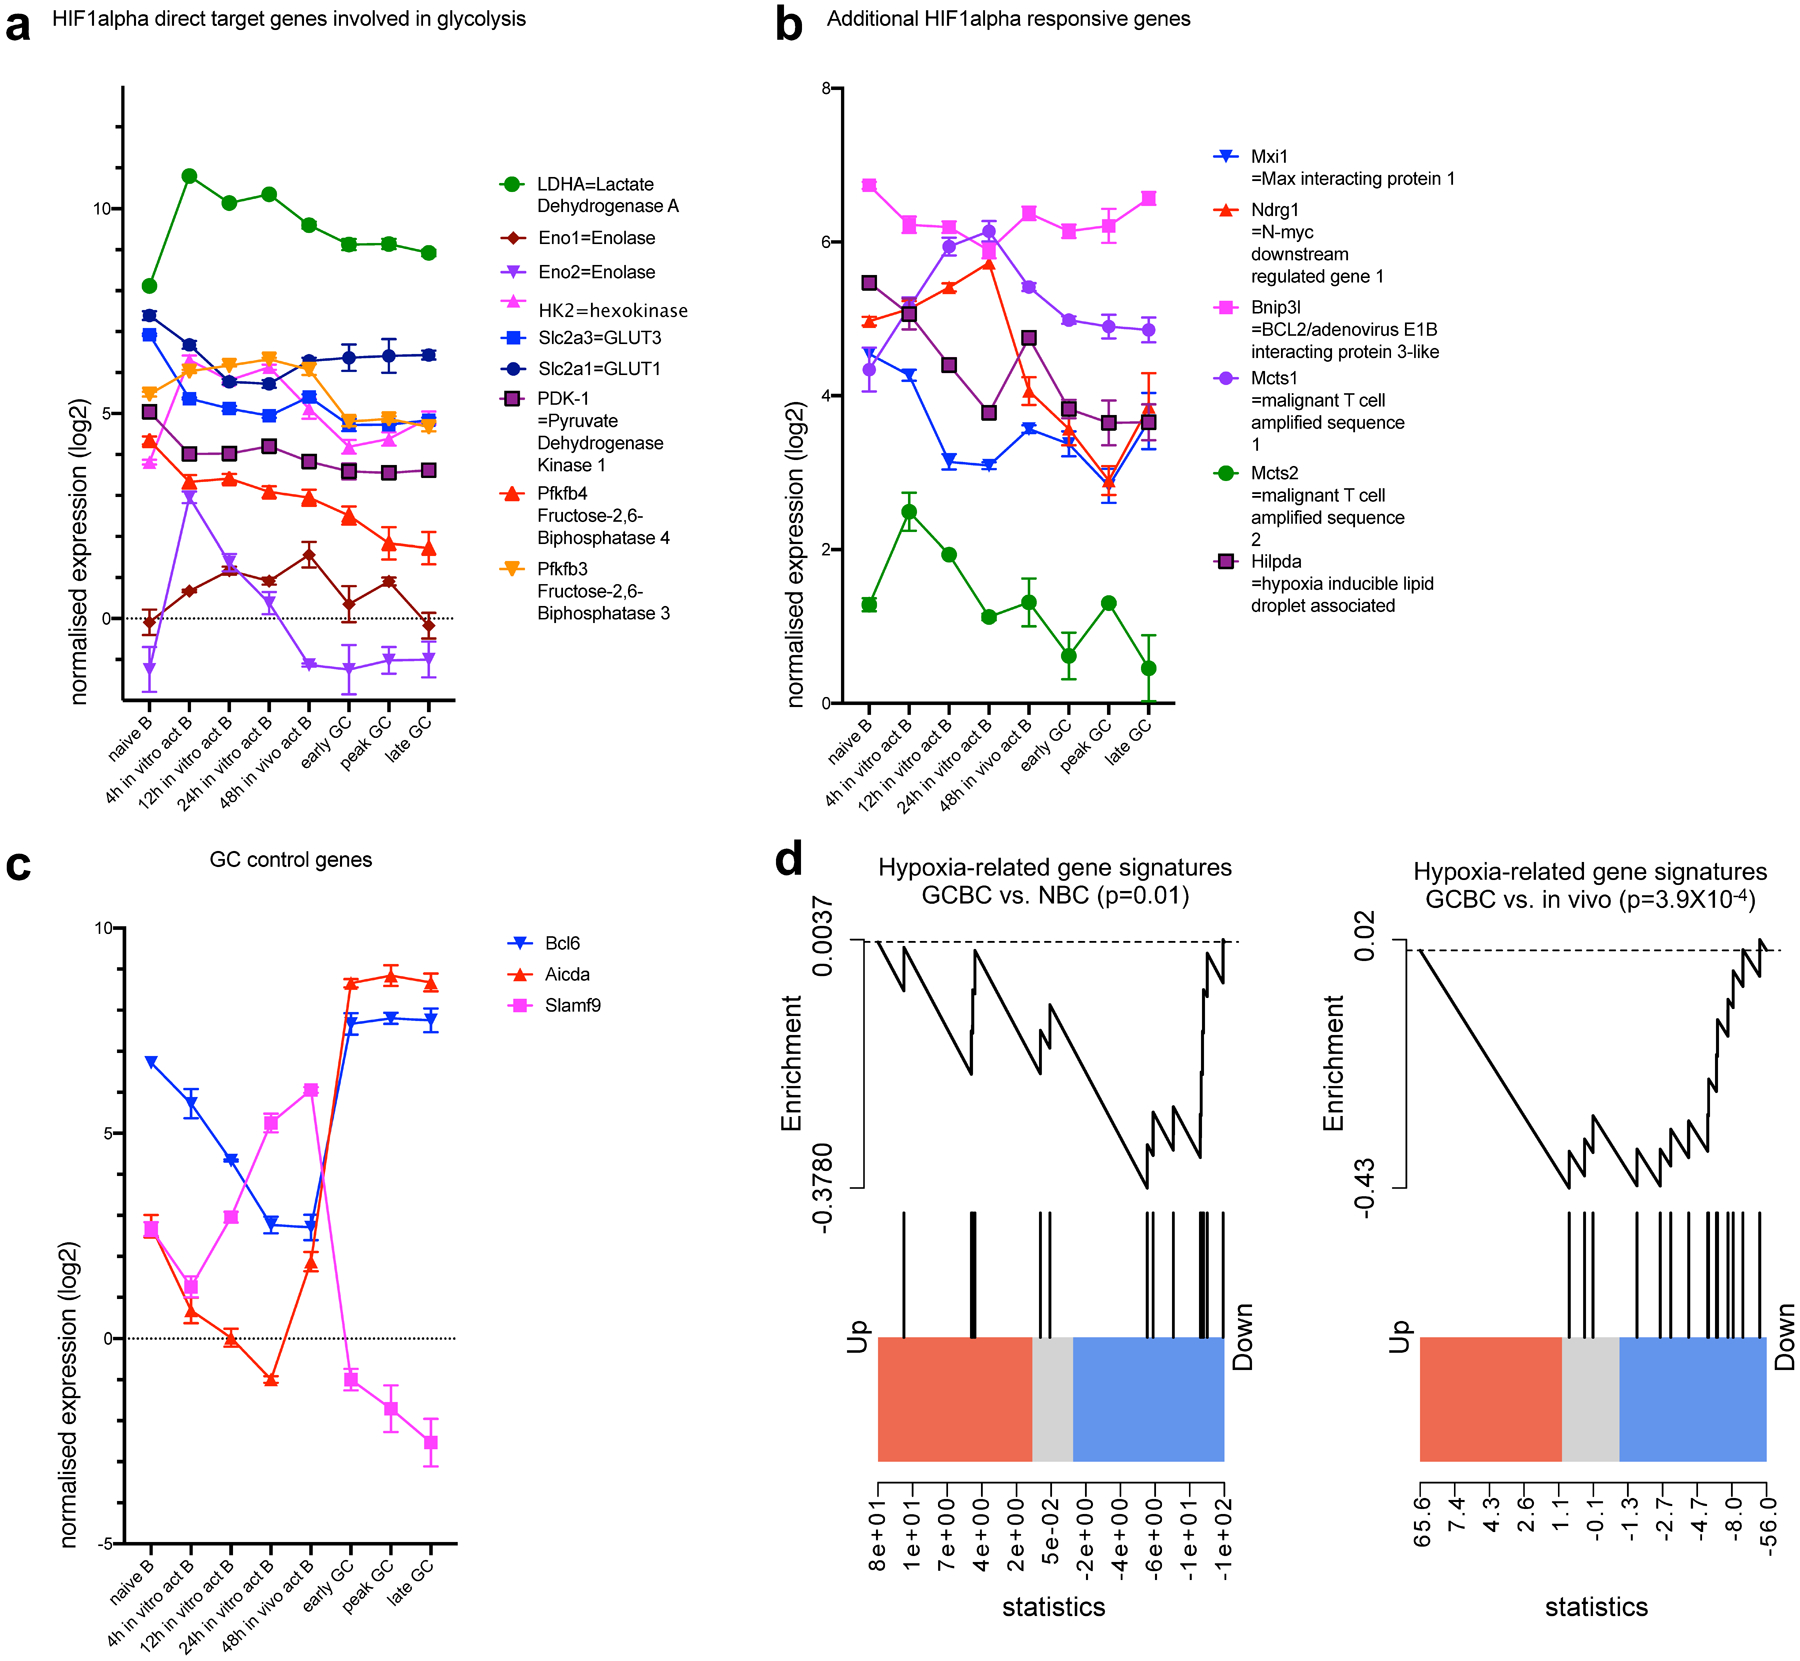
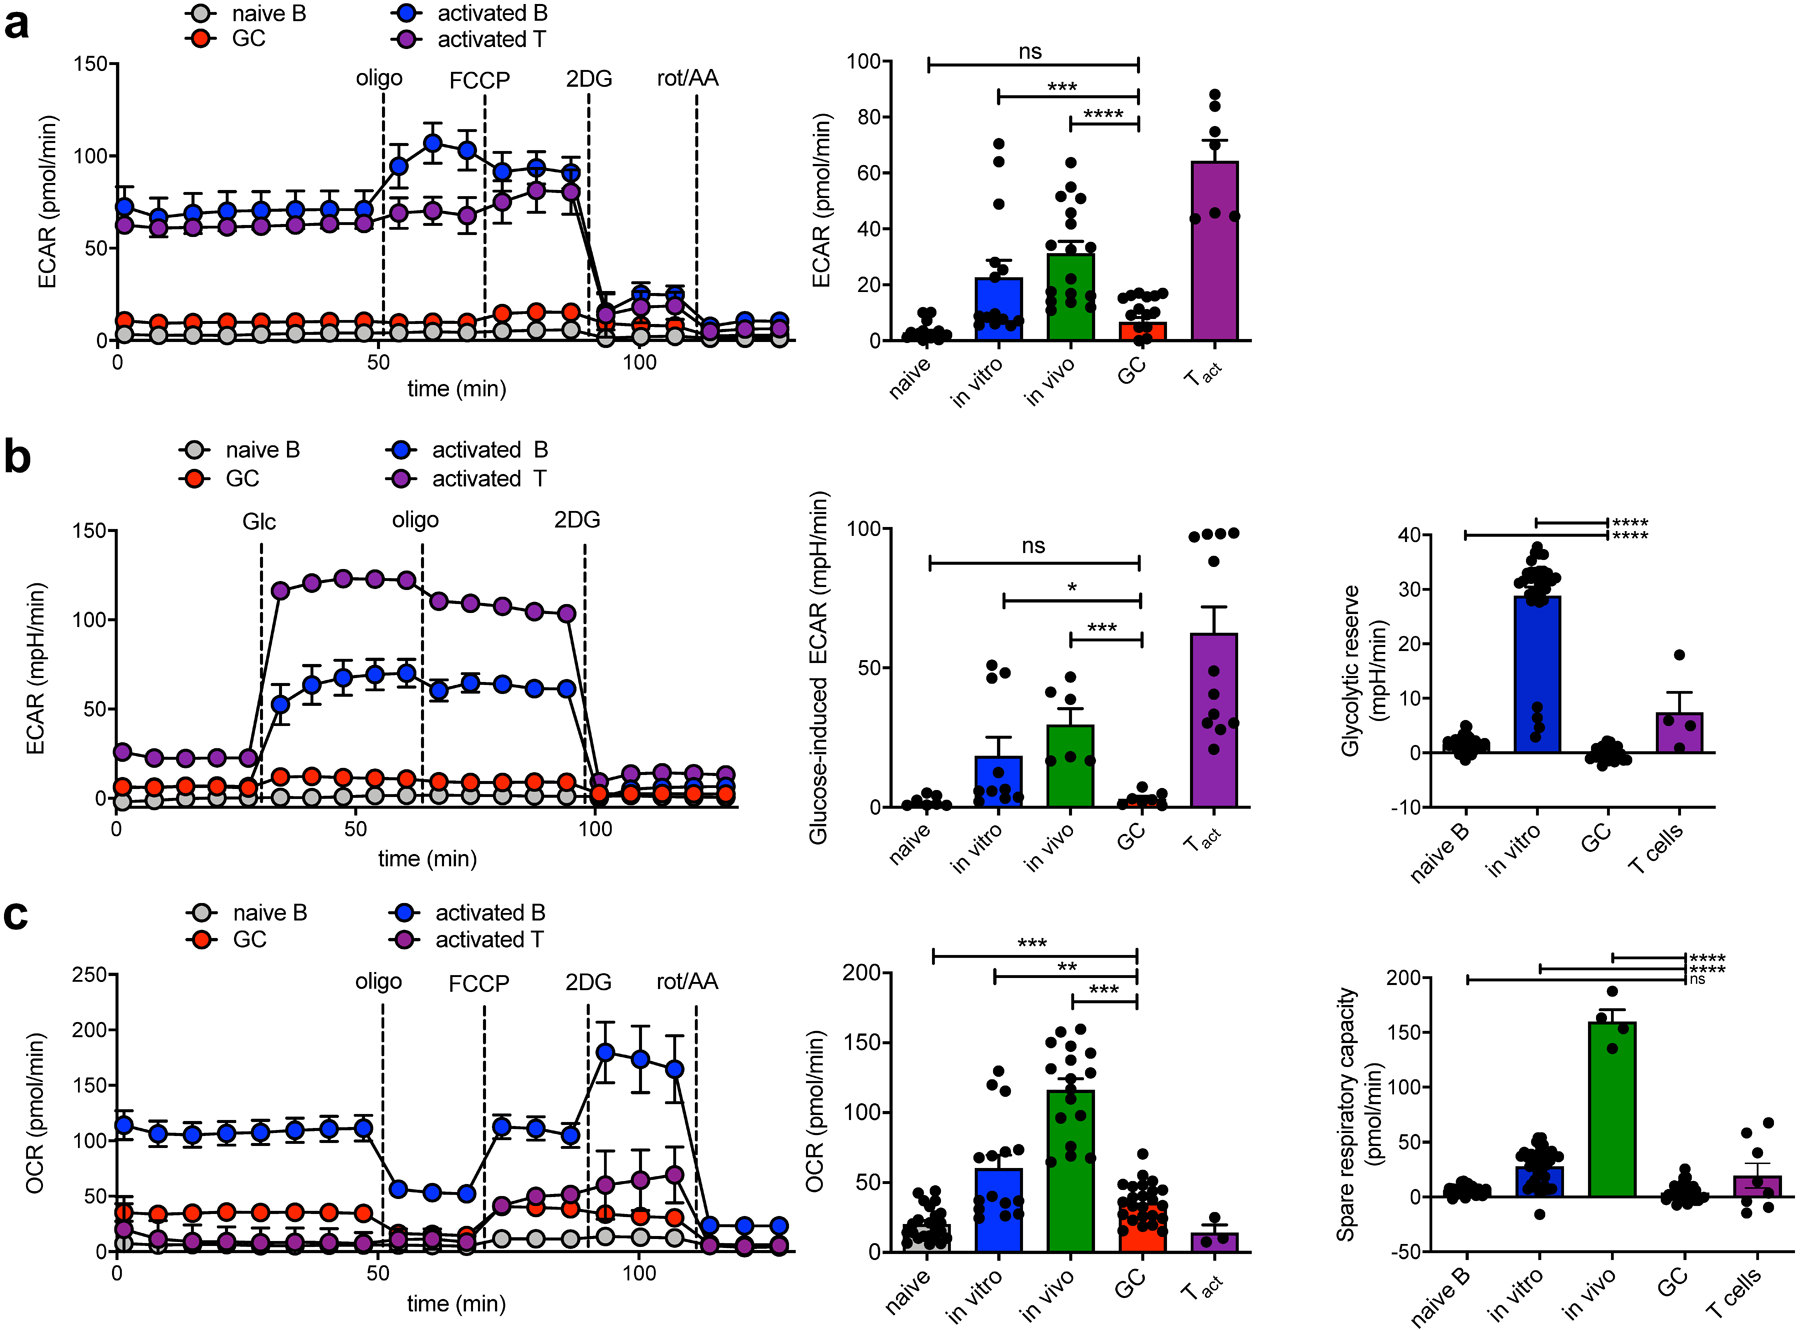
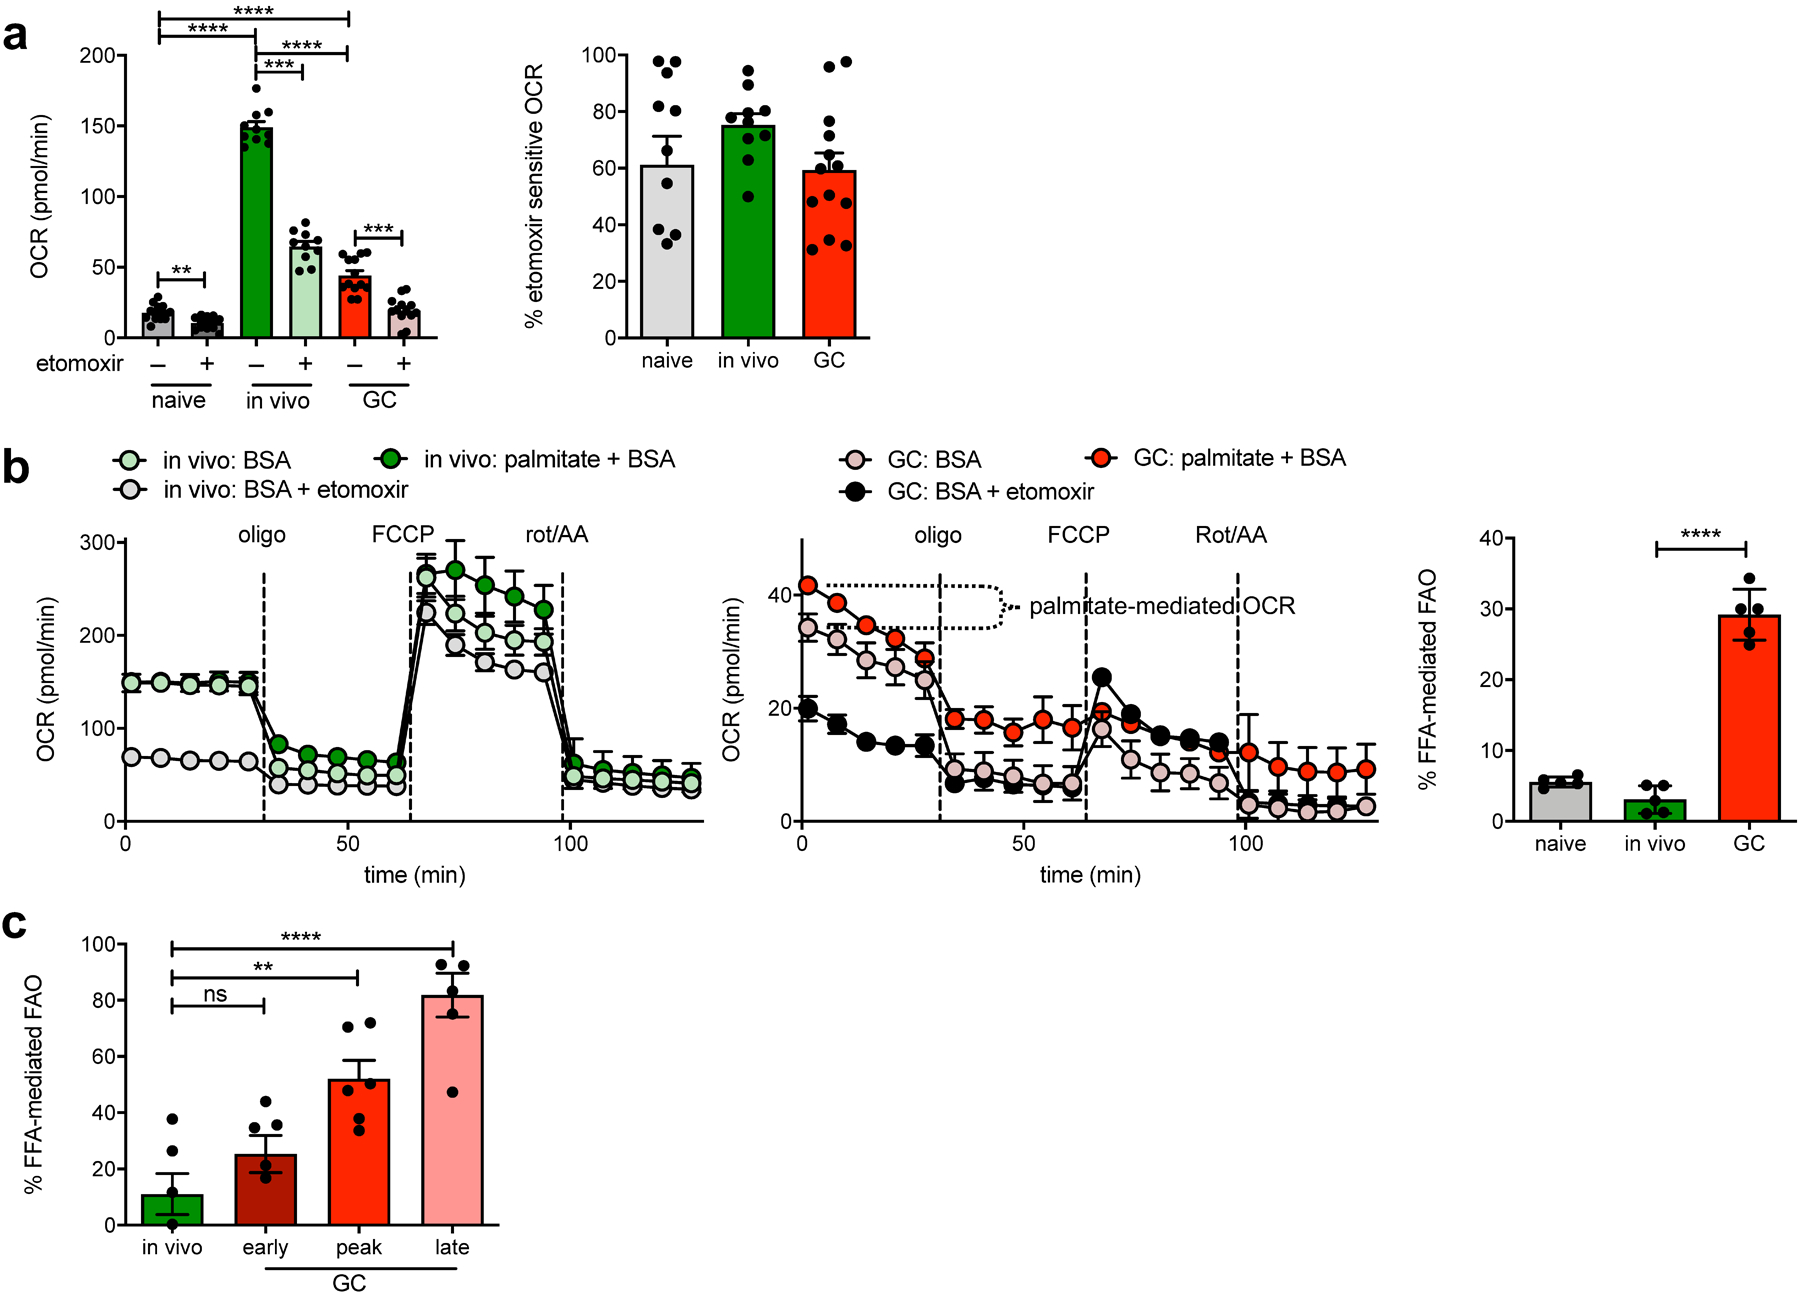
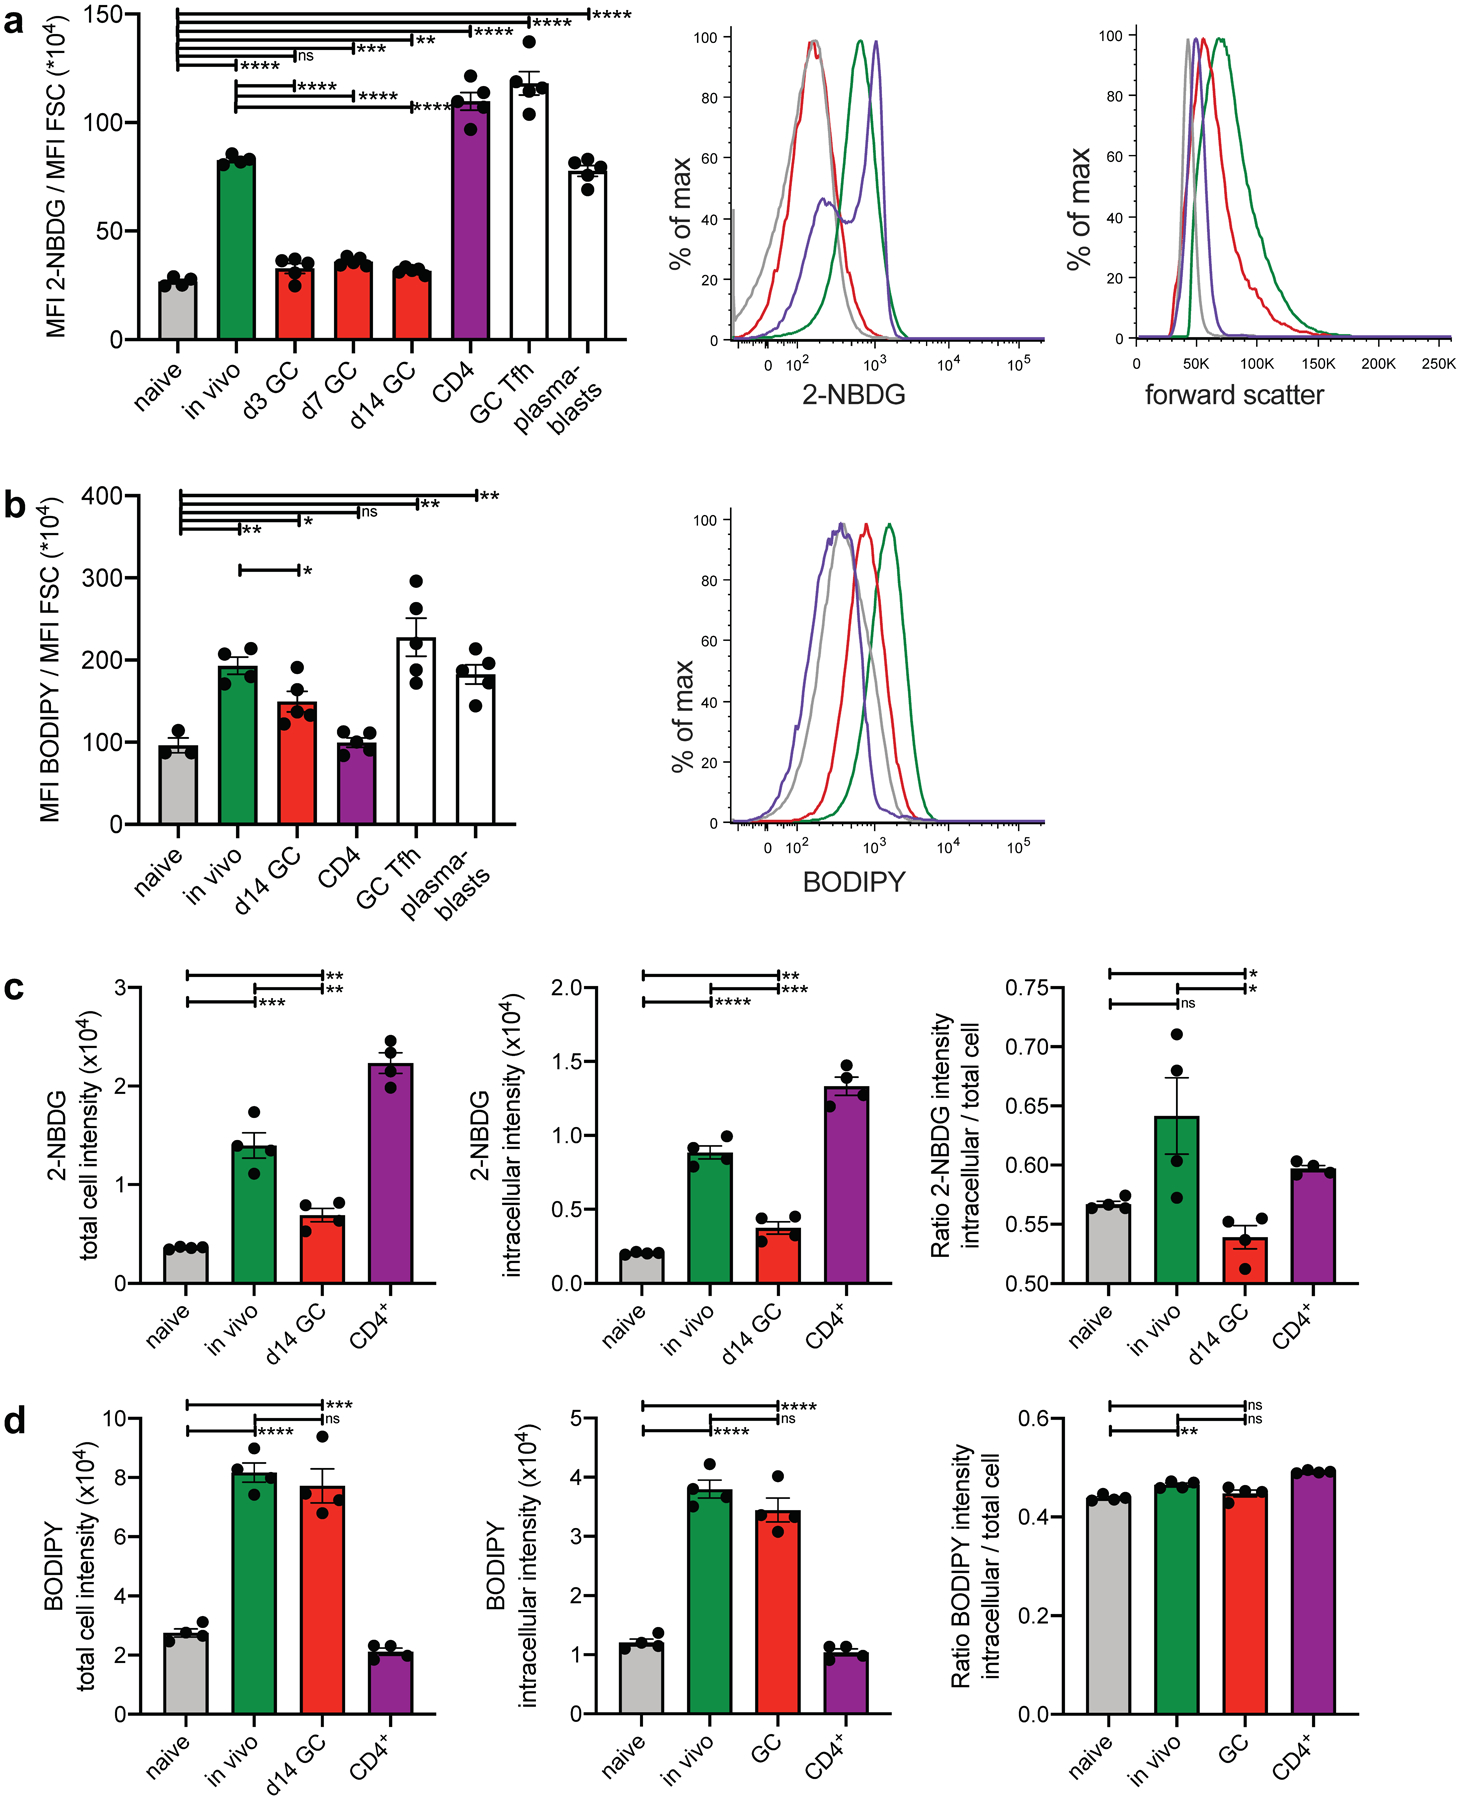
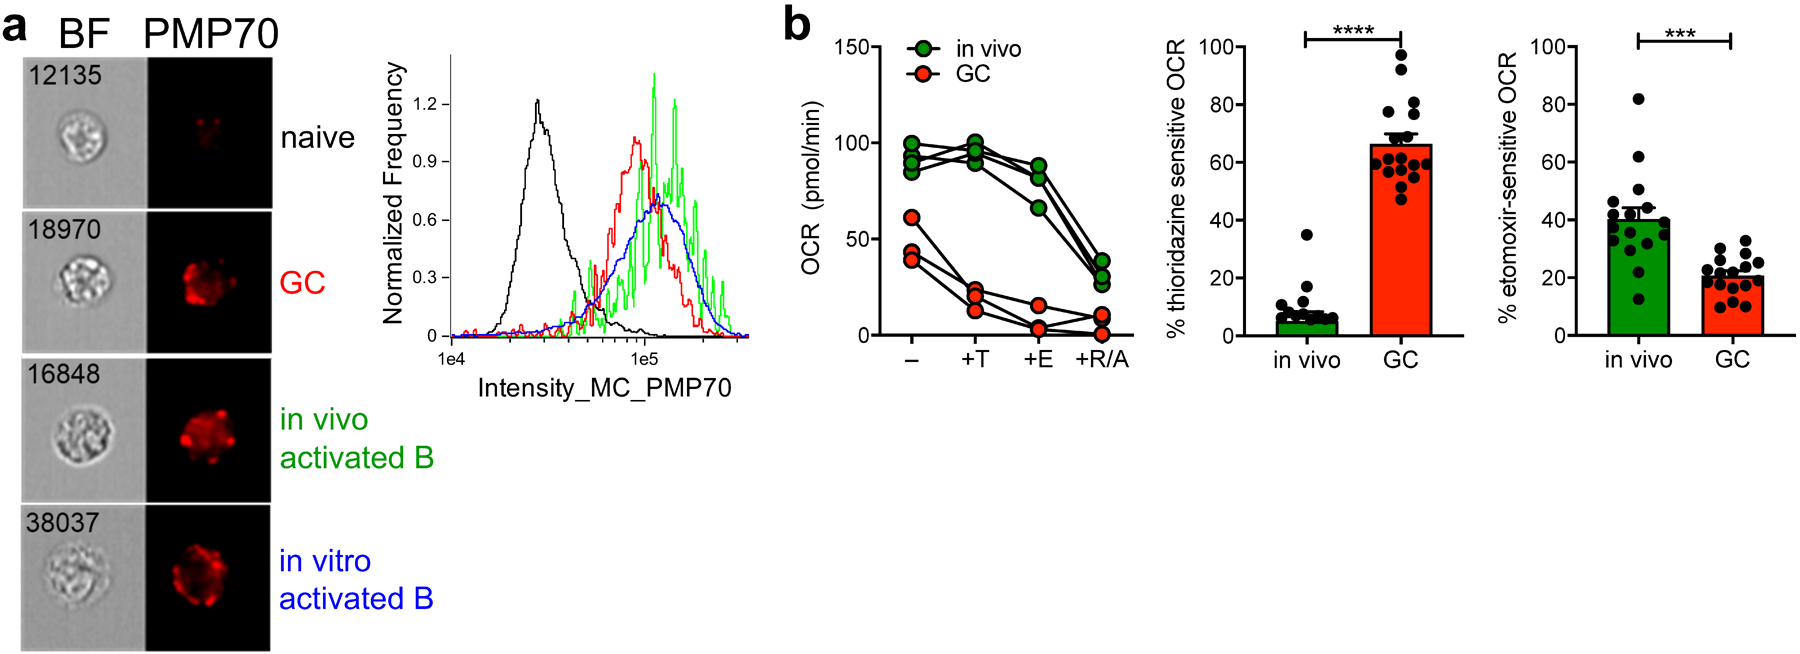
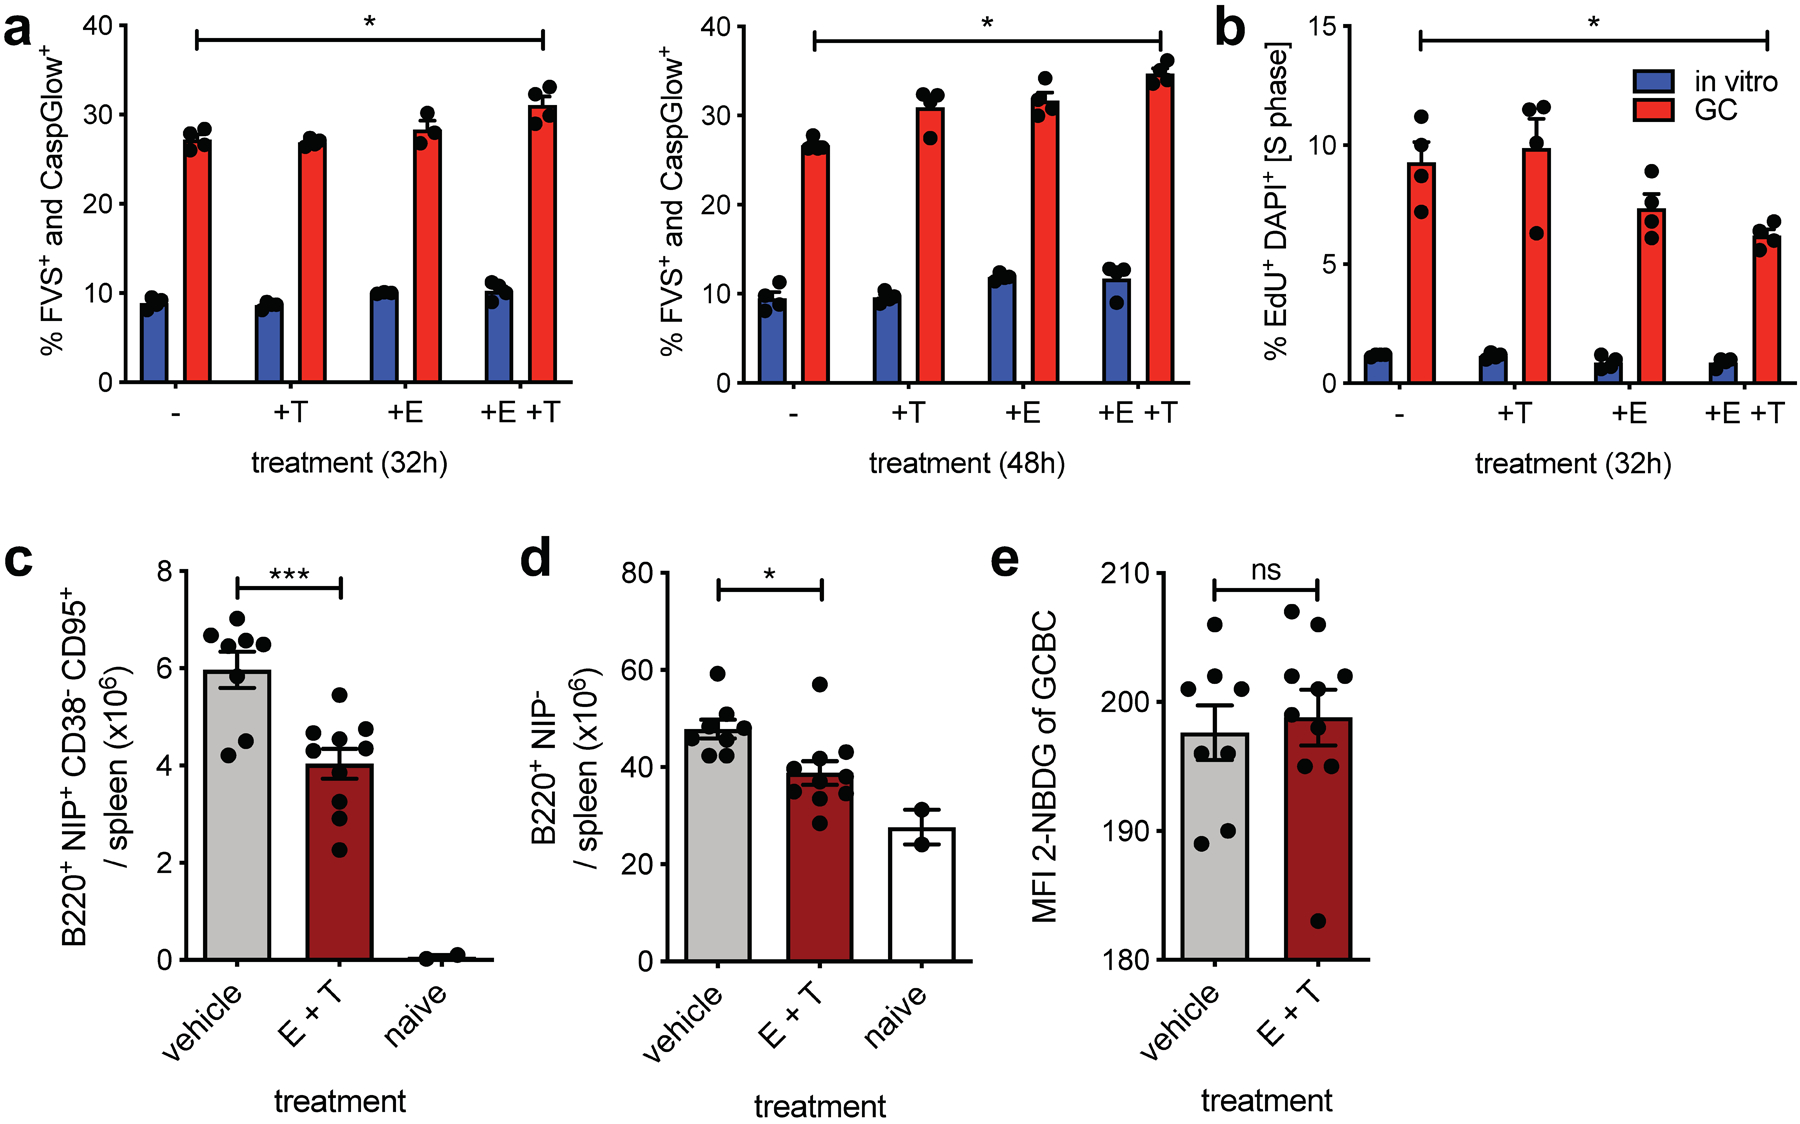
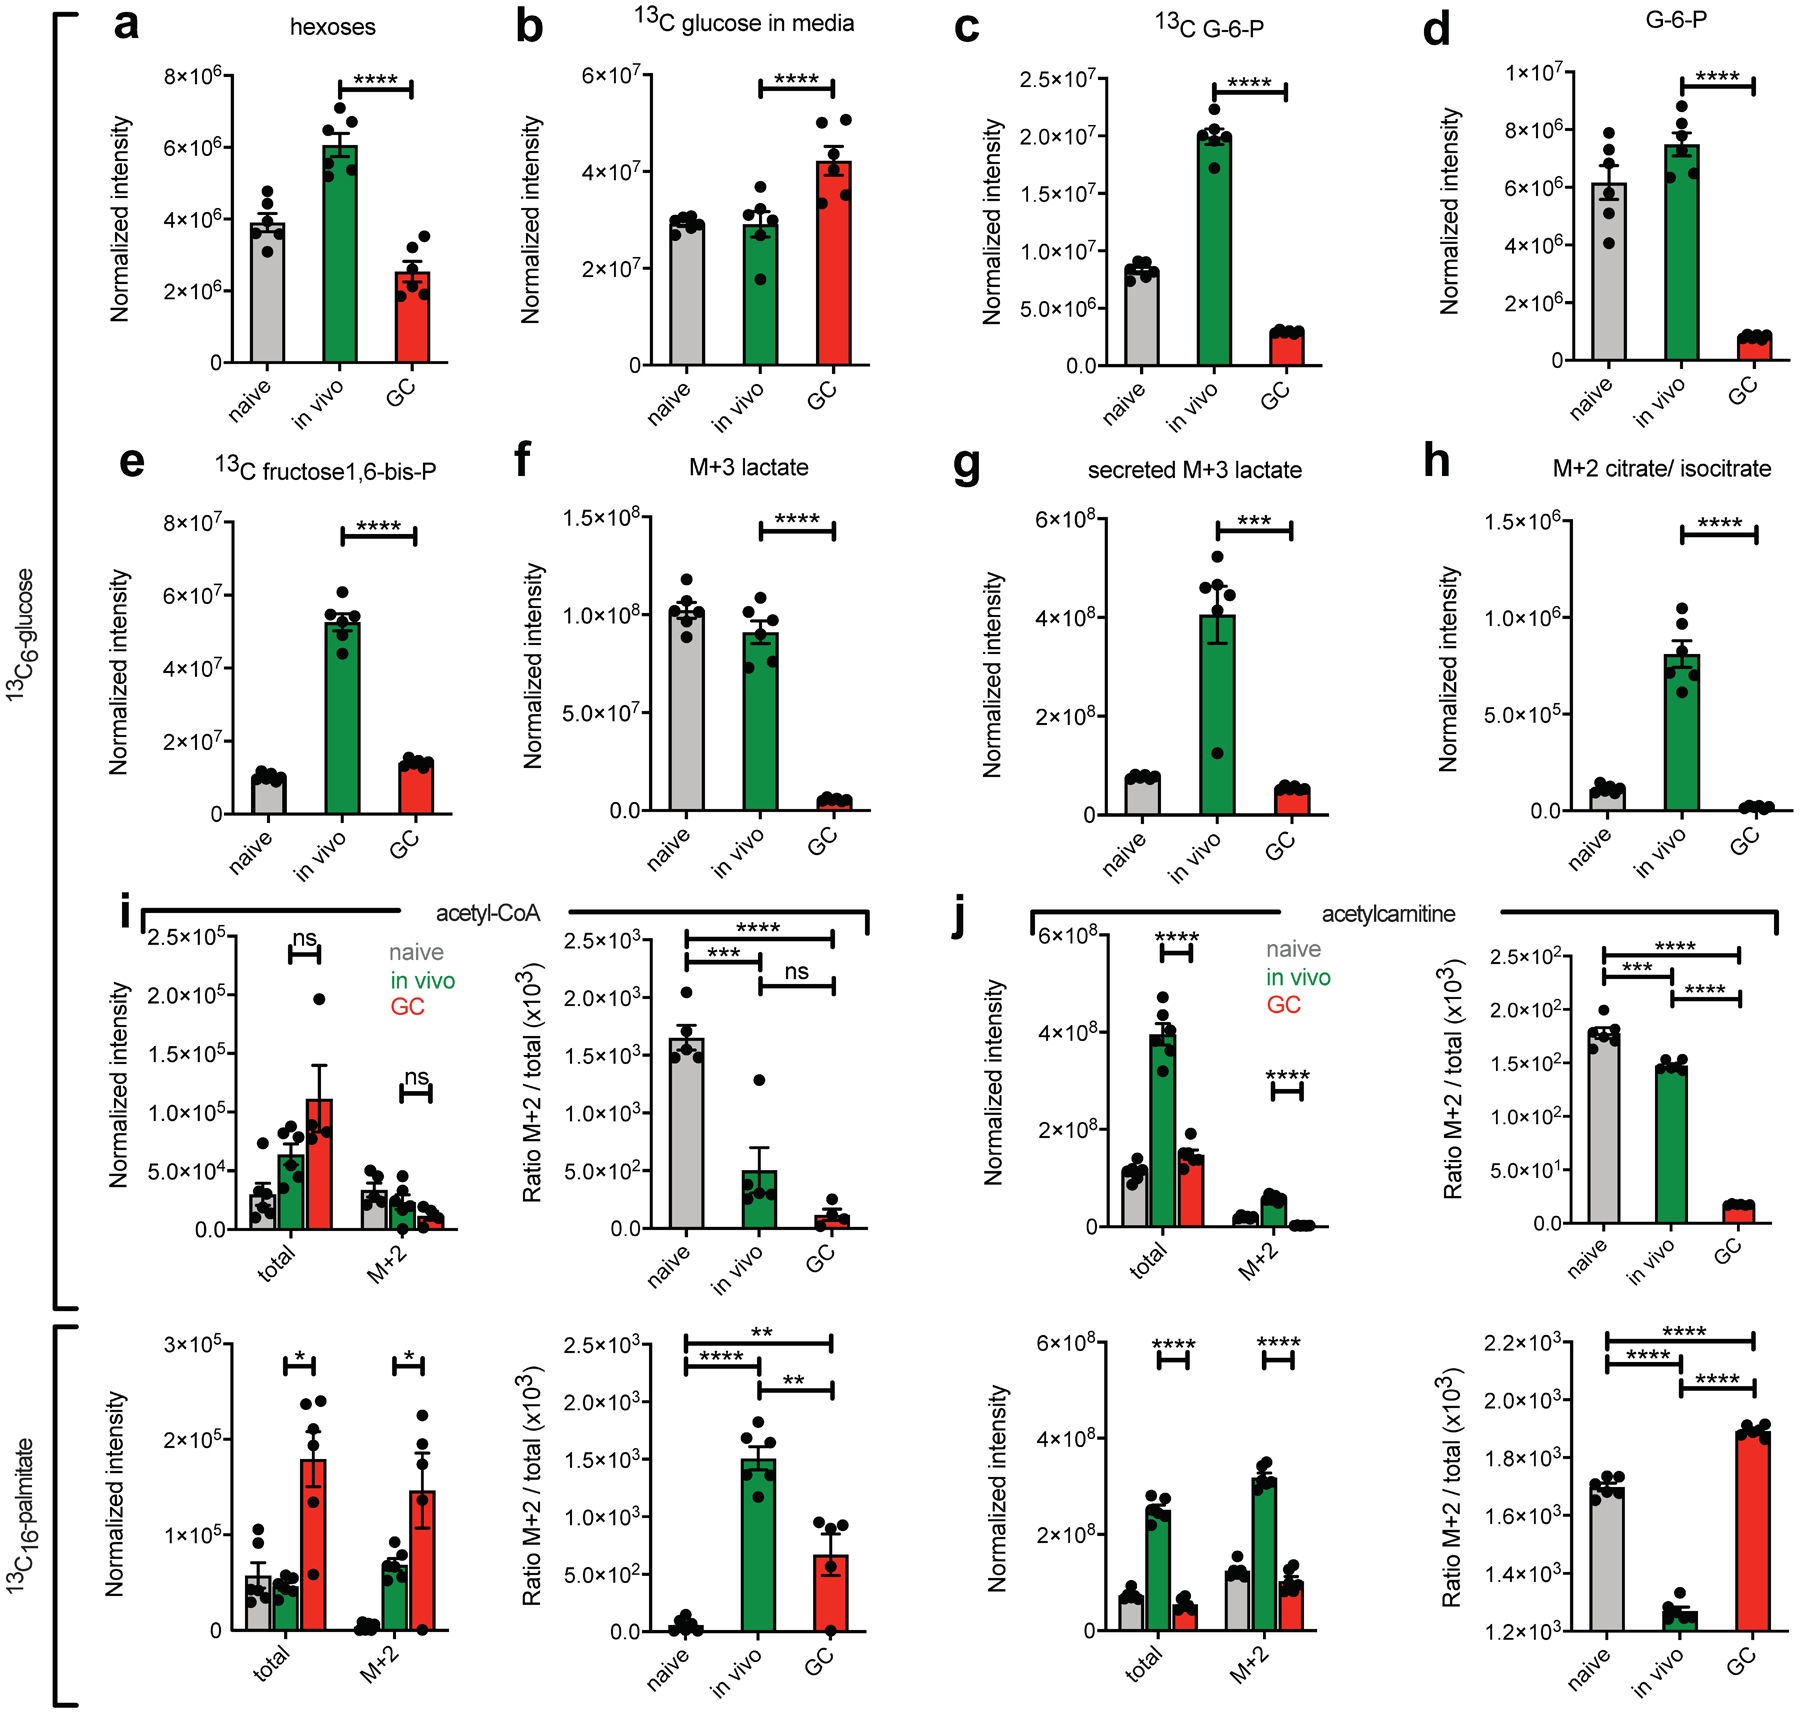
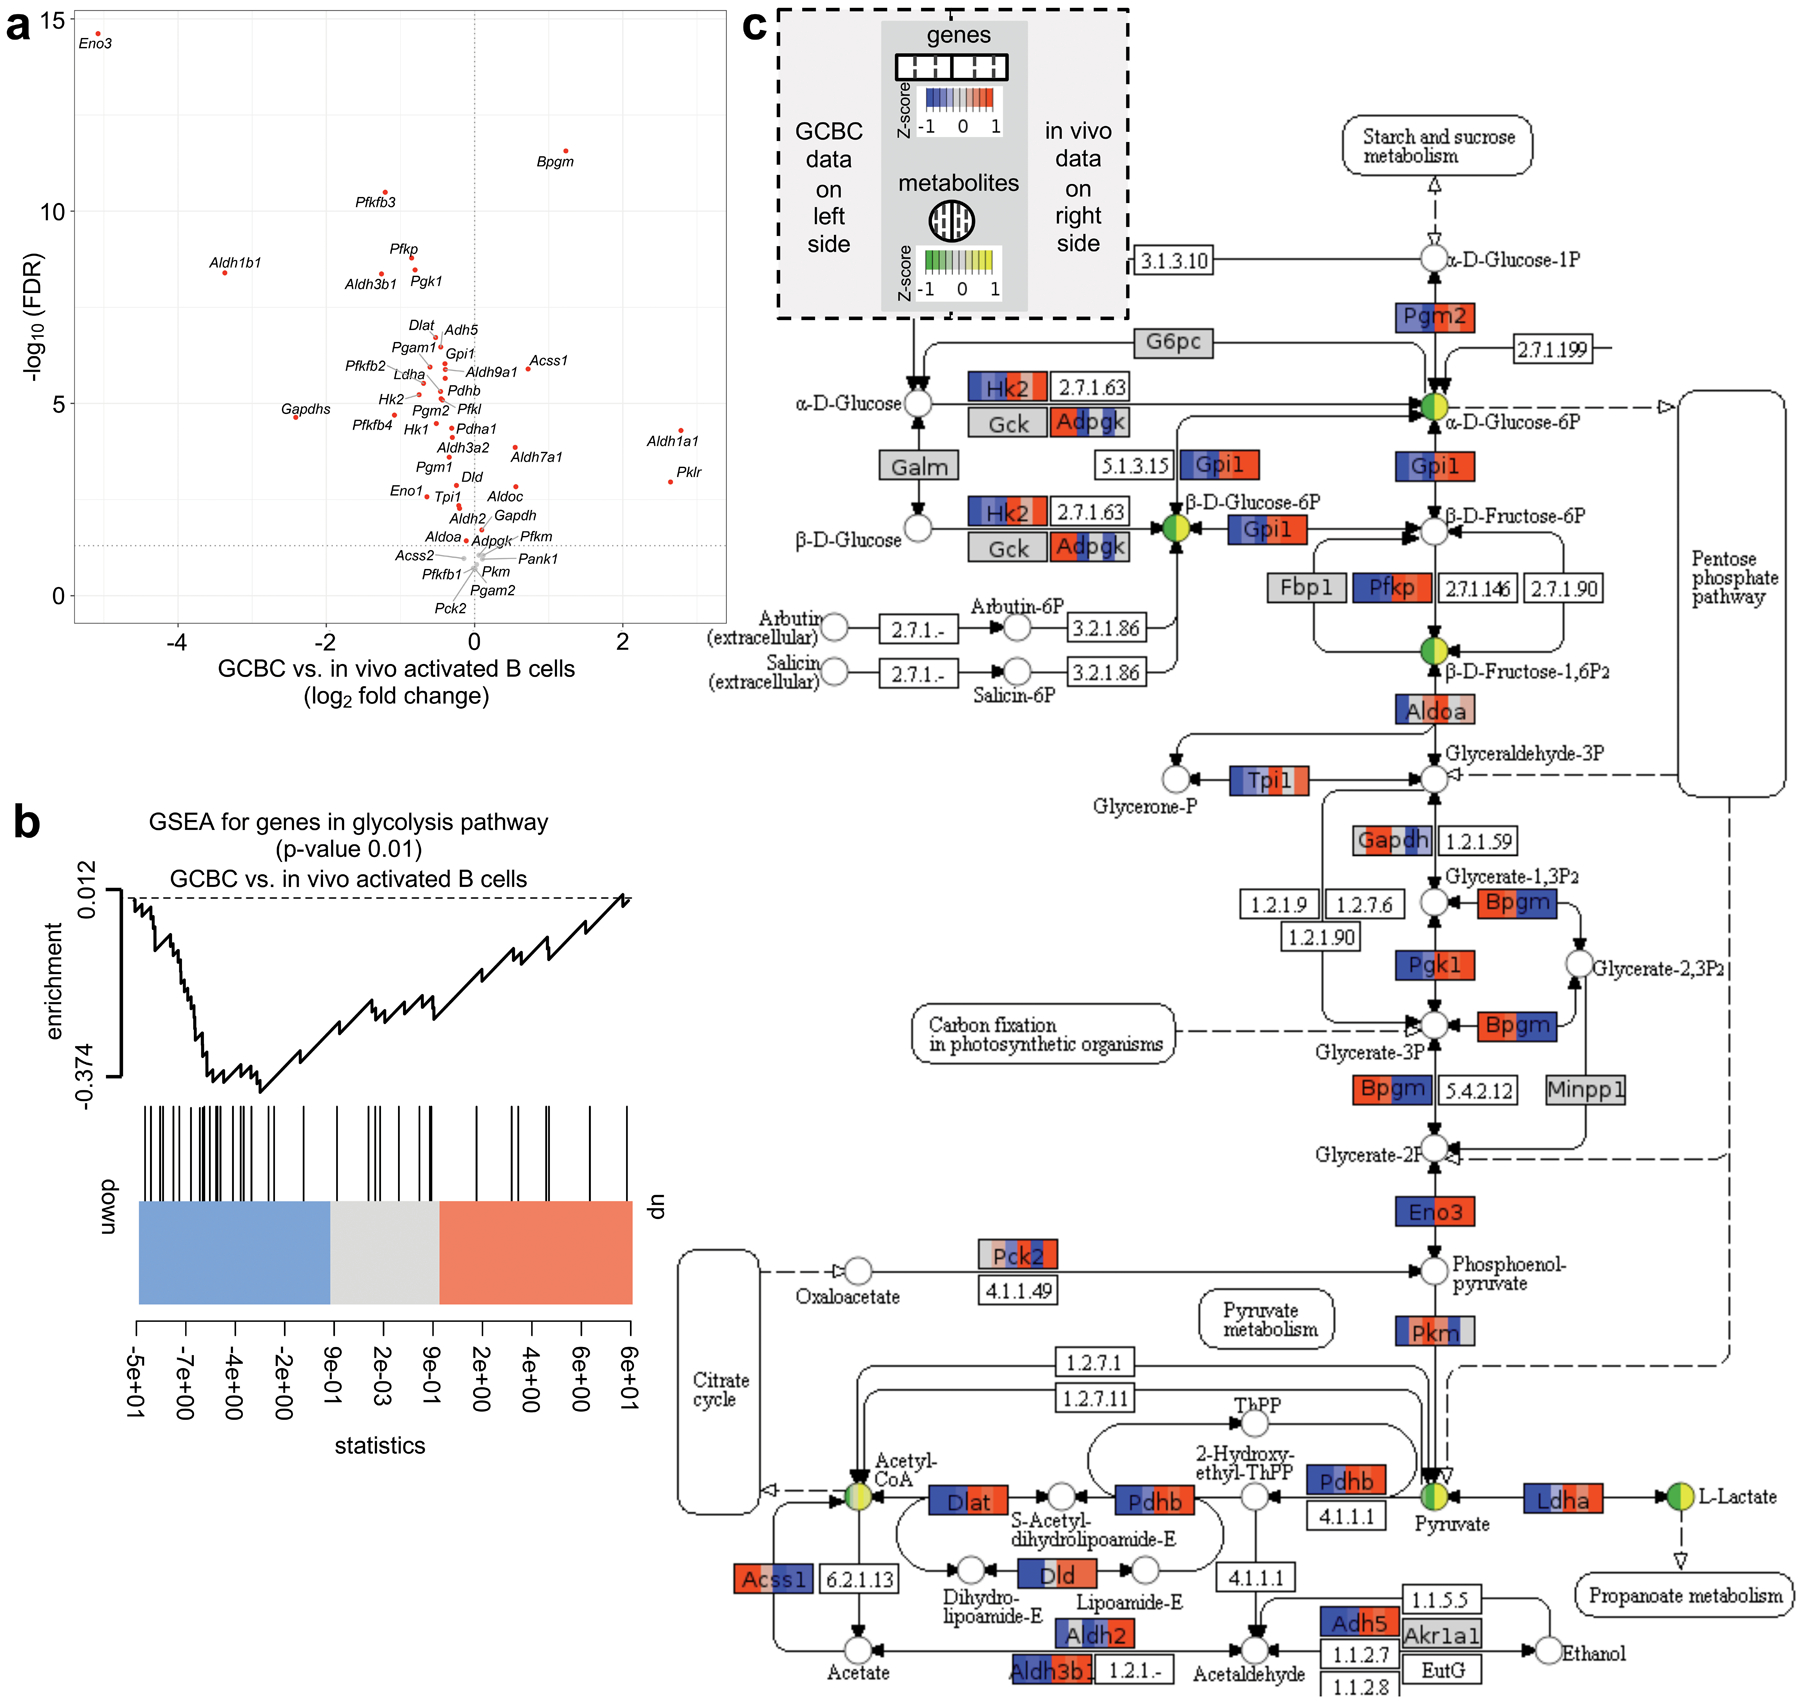
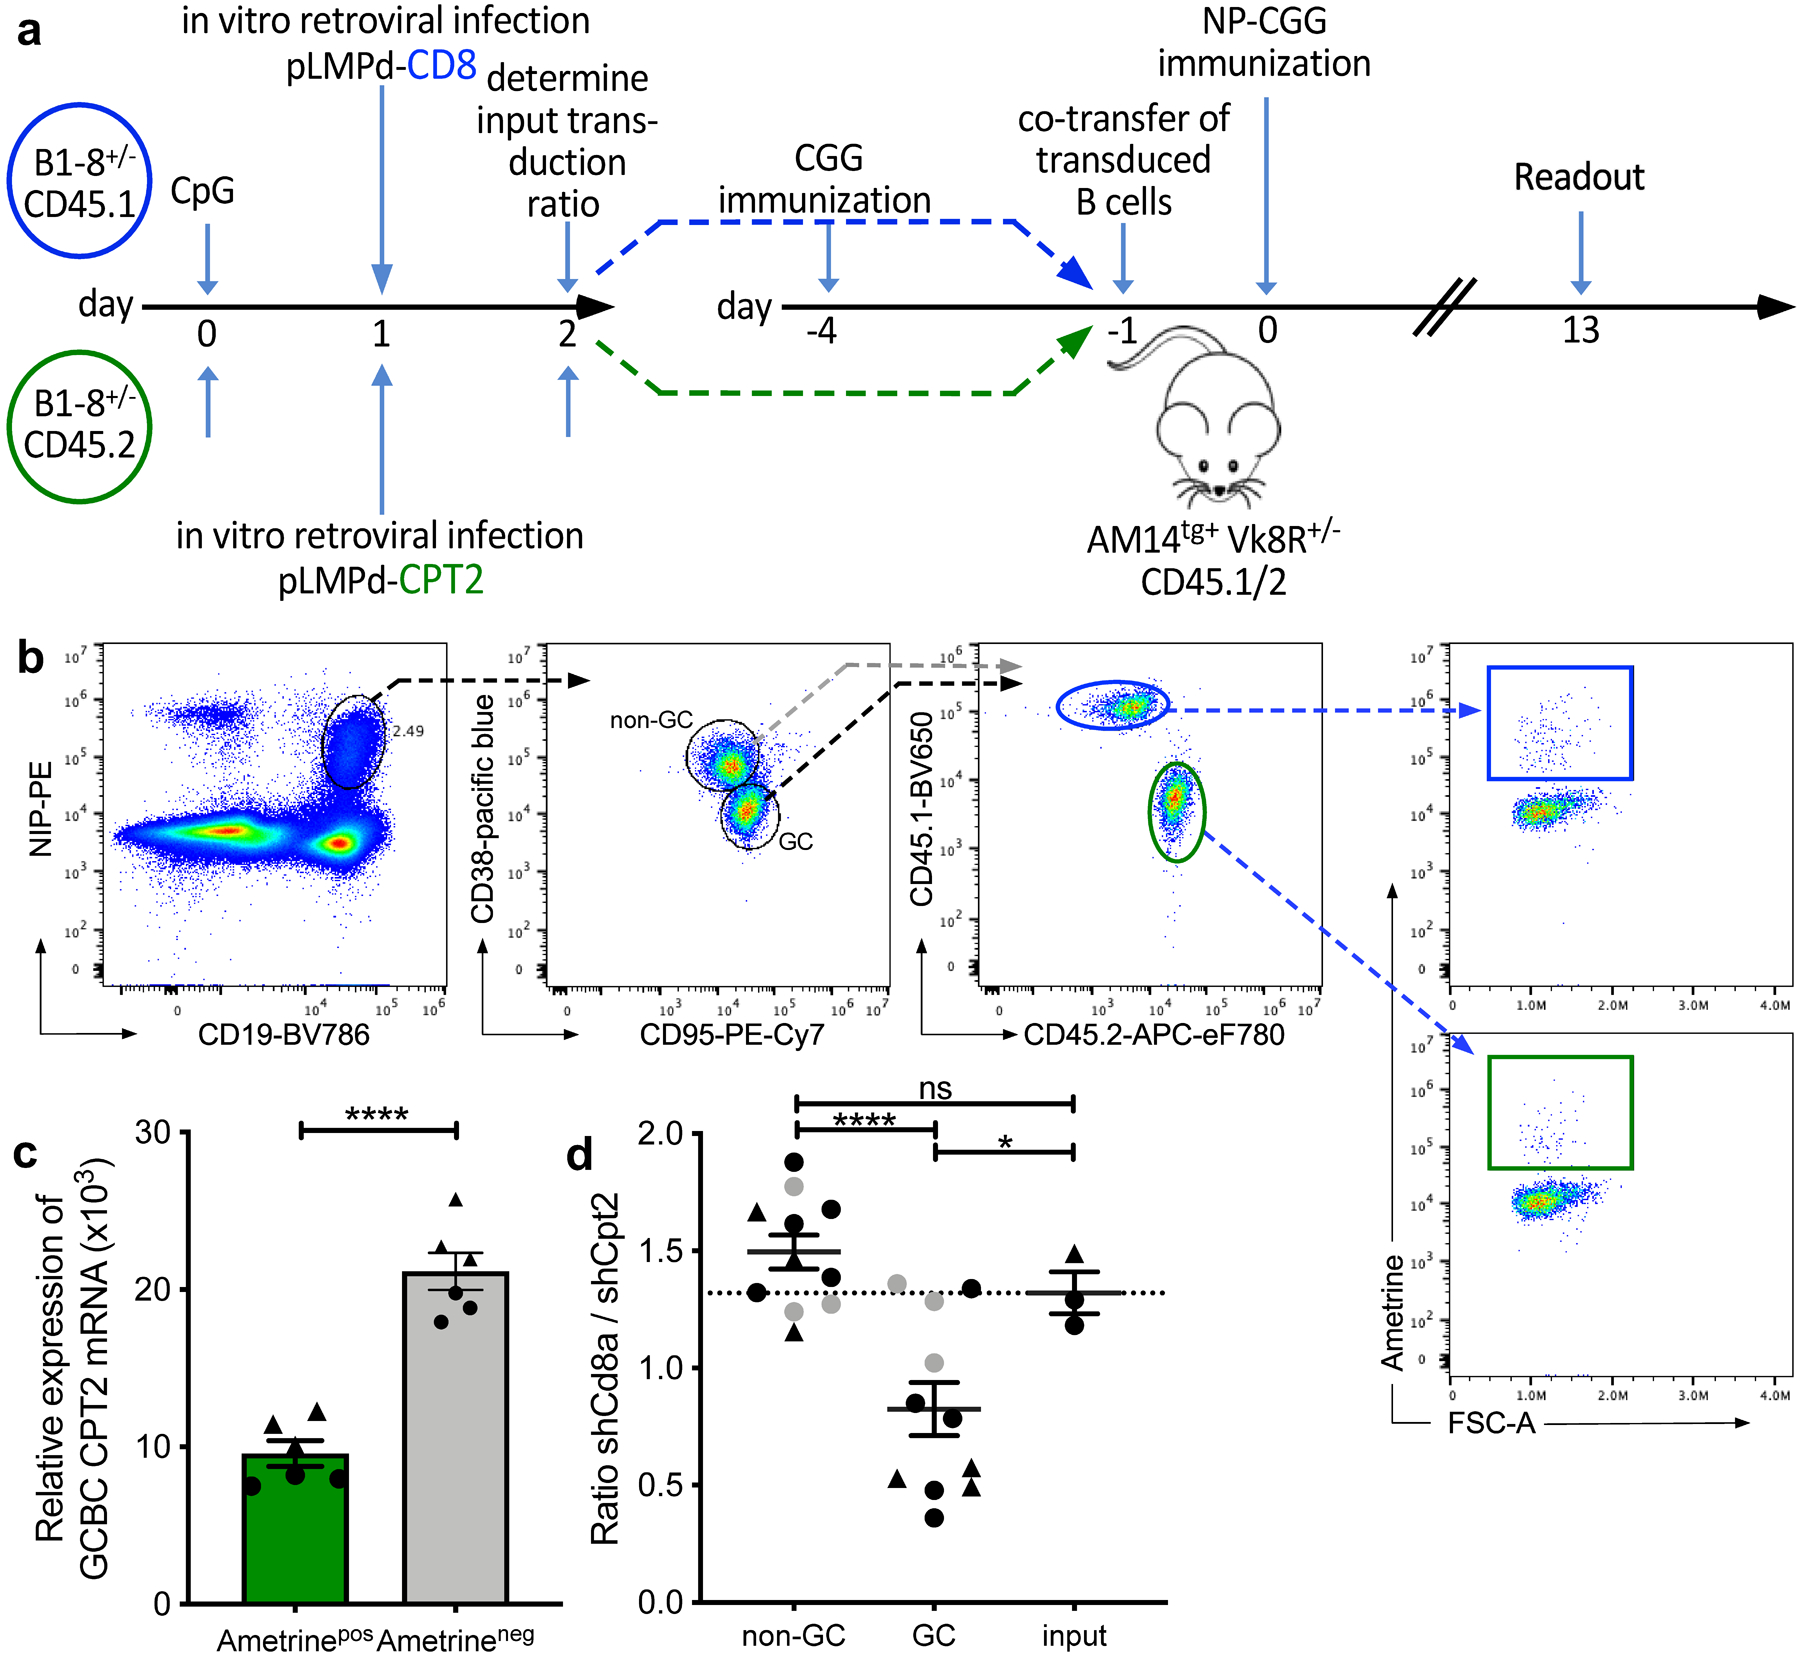
Germinal center B cells (GCBCs) are critical for generating long-lived humoral immunity. How GCBCs meet the energetic challenge of rapid proliferation is poorly understood. Dividing lymphocytes typically rely on aerobic glycolysis over oxidative phosphorylation for energy. Here we report that GCBCs are exceptional among proliferating B and T cells, as they actively oxidize fatty acids (FAs) and conduct minimal glycolysis. In vitro, GCBCs had a very low glycolytic extracellular acidification rate but consumed oxygen in response to FAs. [13C6]-glucose feeding revealed that GCBCs generate significantly less phosphorylated glucose and little lactate. Further, GCBCs did not metabolize glucose into tricarboxylic acid (TCA) cycle intermediates. Conversely, [13C16]-palmitic acid labeling demonstrated that GCBCs generate most of their acetyl-CoA and acetylcarnitine from FAs. FA oxidation was functionally important, as drug-mediated and genetic dampening of FA oxidation resulted in a selective reduction of GCBCs. Hence, GCBCs appear to uncouple rapid proliferation from aerobic glycolysis.


Conflict of interest statement

Competing financial interest

Authors declare that they have no competing financial interest.

Figures

Extended Data Fig. 1
Extended Data Fig. 1. Preparation of B cell populations in support of figures 1, 2, 4, 5, 6, 7 and 8.
Representative FACS plots are shown to determine frequency of indicated target populations (horizontal patterns). Splenocytes were enriched for indicated target population as described in the methods section. After each purification step (columns) cells were subjected to flow cytometric analysis with indicated surface markers to determine purity. Arrows indicate subsequent gating and numbers percent gated population. (RBC; red blood cell)
Extended Data Fig. 2
Extended Data Fig. 2. GCBC show high viability in culture in support of figures 1, 2, 4, 5, 6 and 7.
Indicated cell populations were bead purified and cultured either in RPMI media (a-c) or Seahorse XF Cell Mito Stress test media (d and e) for depicted times. Cell viability was assayed flow-cytometric staining for 7-AAD (a and d) at 120min of culture and their viability was additionally determined at 0, 30 and 60min utilizing Luna-Fl™ automated counting with dual fluorescent microscope optics. Cells were exposed to acridine orange (AO) and propidium iodide (PI) simultaneously (b, c, e). Tabulated data are presented in (a) and (b) of 2 independent experiments depicted in red and blue. (b) shows representative images of the Lina-Fl™ counter for data in (a). ns = not significant; *p ≤ 0.05; **p ≤ 0.01; ***p ≤ 0.001; ****p ≤ 0.0001 by unpaired, two-tailed t-test.
Extended Data Fig. 3
Extended Data Fig. 3. GCBC maintain key transcriptional profile during in vitro culture in support of figures 1, 2, 4, 5 and 6
Comparison of transcriptional profile of 259 most differentially regulated GC genes. Genes shown are most differentially regulated between freshly isolated GCBC and in vivo activated B cells (FDR < 0.01; FC > 4 log2) and therefore serve as GCBC identifier geneset. a, correlation of GCBC identifier genes of freshly isolated GCBC and GCBC cultured for 2h (left; R2=0.96) which matches the conditions of seahorse experiments or GCBC cultured for 4h with aCD40 (right; R2=0.86) which matches our 13C tracing studies. b, heatmap of expression levels of 267 GCBC identifier genes in freshly isolated (left column) and cultured GCBC under depicted conditions. R-correlation of freshly isolated GCBC to all culture conditions is depicted below each column and was computed using R “cor” function with “pearson” method.
Extended Data Fig. 4
Extended Data Fig. 4. GCBC only take up minimal amounts of glucose but physiological amounts of FFA in support of figure 3.
a, tabulated data of mean 2-NBDG fluorescence normalized to cell size (left) and representative flow histograms of 2-NBDG fluorescence (center left) and forward scatter (center right) of indicated cell populations pulsed in vitro for 30 min with 2-NBDG. Right shows an independent repeat of left. b, independent repeat of data presented in Figure 3a. c, tabulated data of mean CD36 fluorescence normalized to cell size (left) and mean CD36 fluorescence of indicated cell populations. Shown are combined data of 2 independent experiments. d, independent repeat of data presented in Figure 3b. e, tabulated data of mean BODIPY fluorescence normalized to cell size (left) and representative flow histograms of BODIPY fluorescence (middle) of indicated cell populations, pulsed in vitro for 30min with BODIPY. Right panel shows an independent repeat of left panel. f and g, representative Amnis ImageStream images of cells presented in Fig. 3c and 3d, respectively. h, representative images of adaptive erode function for 100% (total cell, left) and 70% (intracellular, right). Fluorescence intensity is only calculated from areas colored in blue of the same cells shown in left and right panels. Bars represent mean +/− SEM; ns= not significant; *p ≤ 0.05; **p ≤ 0.01; ***p ≤ 0.001; ****p ≤ 0.0001 by unpaired, two-tailed t-test.
Extended Data Fig. 5
Extended Data Fig. 5. Combined inhibition of mitochondrial and peroxisomal FAO with increased in vivo dosage of etomoxir and thioridazine in support of figure 5
Absolute number of live splenic NP+ GCBC (a) and naïve NP B cells (b) and MFI of 2-NBDG of GCBC after 30min 2-NBDG in vitro pulse (c) of mice at d14 post NP-CGG immunization and in vivo treatment at d9, d11 and d13 with 22 mg/kg etomoxir and 11mg/kg thioridazine or vehicle only as in Fig. 5c–e. Every dot represents and individual mouse and graphs are mean +/−SEM; ns = not significant; ****p<0.0001 by unpaired, two-tailed t-test.
Extended Data Fig. 6
Extended Data Fig. 6. Independent repeat of 13C carbon tracing by LC-HRMS and Hexokinase-2 mRNA expression in support of Fig. 5
(a-g) Bead purified naive, in vivo activated and GC B cells were stimulated with anti-CD40 in glucose and glutamine free RPMI media with the addition of 2 mg/ml [13C6]-glucose for 30min or 4h. Cells (a-e, g) and supernatants (f) were then subjected to LC-HRMS. Depicted is one representative experiment with n=6 per sample. Each n represents a pool of 3 individual wells. (H) qRT-PCR for Hexokinase-2 expression from freshly isolated cell populations relative to RPS9. Bars are means +/−SEM. Normalization was performed as described in the methods section; ns = not significant; *p ≤ 0.05; **p ≤ 0.01; ***p ≤ 0.001; ****p ≤ 0.0001 by unpaired, two-tailed t-test.
Extended Data Fig. 7
Extended Data Fig. 7. In vivo 13C tracing in support of figure 6
LC-HRMS analysis of 13C3 lactate generated from 8h continuous 13C6 glucose infusion using an “insulin clamp”. Mice received a primed (42.5 mU/kg)/continuous (4.5 mU/kg/min) infusion of insulin and a variable infusion of 20% glucose (50% 13C6-glucose : 50% 12C-glucose) to maintain euglycemia for 480 min. Mice were sacrificed and heart and liver were disrupted in liquid nitrogen. B cell populations were isolated as in Extended Data Fig. 1 and all samples were subjected to 13C3-lactate detection by liquid chromatography-high resolution mass spectrometry.
Extended Data Fig. 8
Extended Data Fig. 8. Absence of hypoxia-related gene signatures in the GCBC transcriptome in support of figure 7
Depicted are quantile normalized expression values of HIF1alpha direct target genes that are involved in glycolysis (a) or not involved in glycolysis (b) and control genes that are known to be expressed or absent in GCBC (c). Significant down-regulation of hypoxia-related gene signatures in GCBC transcriptome compared to naïve B cells (left of d) and in vivo activated B cells (right of d). Data were obtained by RNA-sequencing of indicated cell populations as in Extended Data Fig. 1. Shown are averages of 3 independent RNA sequencing reactions per cell population with x-axis showing different cell populations as defined in the text (a-c). Genes are connected by lines for easier visualization and bars are means +/−SEM. Gene set enrichment plots illustrating differentially expressed genes in peak GCBCs compared to naive (left of d) and in vivo activated B cells (right of d; n=3 per group) with respect to genes depicted in a and b. p-values were calculated using the rankSumTestWithCorrelation function in limma with t statistics.
Fig. 1:
Fig. 1:. GCBCs perform oxphos but not aerobic glycolysis.
a, Representative trace (left) and mean data (right) of extracellular acidification rate (ECAR). Values are averages of 5–8 basal ECAR measurements minus average of 3–5 ECAR readings after 2DG treatment of individual wells from indicated cell types subjected to a mitochondrial stress test in the Seahorse XFe96 flux analyzer. See Extended Data Fig. 1 for preparation of these cells. b, Representative trace (left) and mean data (center) of glycolytic ECAR when assayed in minimal media and treated with glucose in-Seahorse. Values are averages of 5 ECAR measurements after glucose stimulation minus averages of 5–8 basal ECAR readings of individual wells from indicated cell types. Glycolytic reserve (right) is the difference between glycolytic capacity and glycolysis rate and was measured as the difference between resulting ECAR values after in-Seahorse exposure to glucose and maximal ECAR values obtained after Oligomycin treatment. c, Representative trace (left) and mean data (center) of oxygen consumption rate from cells as in (a). Values are averages of 5–8 basal OCR measurements minus averages of 3–5 OCR readings after rot/AA treatment of individual wells from indicated cell types. Spare respiratory capacity is the difference between basal OCR values and maximal OCR values obtained after FCCP uncoupling (right). Results are representative of (for sample data) or represent the mean of 3–6 independent experiments. Bars represent mean +/− SEM; ns = not significant; *p ≤ 0.05; **p ≤ 0.01; ***p ≤ 0.001; ****p ≤ 0.0001 by unpaired, two-tailed t-test.
Fig. 2:
Fig. 2:. GCBCs rely on FAO.
a, Measurement of basal OCR values of naive, in vivo–activated or GCBCs, prepared as in Extended Data Fig. 1 and treated with 40uM etomoxir or its vehicle prior to analysis. Raw OCR values (left) from multiple experiments and proportion of total OCR that is etomoxir-sensitive (right; calculated as: [etomoxir inhibited OCR – rotenone/AA OCR] / [basal OCR – rotenone/AA OCR]). b, Representative OCR trace of in vivo activated (left) or GCBCs pre-treated with etomoxir or its vehicle control (center). Symbols are means of three replicate wells and error bars are +/− SEM. Traces marked “palm+BSA” were from wells with added palmitate-conjugated BSA, used to identify the contribution of exogenous fatty acids to etomoxir-sensitive oxygen consumption. Right: Tabulated data that indicate percent contribution of palmitate to etomoxir-sensitive OCR (calculated as: OCRpalm - OCRBSA / OCRpalm - OCReto). c, Percent of FFA-mediated OCR that was stimulated by palmitate addition to in vivo activated or early (d8), peak (d13) and late (d23) GCBCs (calculated as in right of (b)). Bars represent mean +/− SEM; *p ≤ 0.05; **p ≤ 0.01; ***p ≤ 0.001; ****p ≤ 0.0001 by unpaired, two-tailed t-test.
Fig. 3.
Fig. 3.. GCBCs uptake of glucose and FFA.
a, In vivo 2-NBDG uptake. Mice were injected with 2-NBDG then sacrificed 30min later and splenocytes analyzed by flow cytometry. Tabulated data of mean 2-NBDG fluorescence normalized to cell size (left); representative flow histograms of 2-NBDG fluorescence (center) and forward scatter (right) of naive, in vivo activated, and GCBCs, as well as CD4+ T cells. Colors of bars in left histograms correspond to group labels of flow histogram traces in center and right. Only d14 GC are shown in center and right. b, In vivo BODIPY uptake. Mice were injected with BODIPY™ FL C16 then sacrificed 60min later and splenocytes analyzed by flow cytometry. Tabulated data of mean BODIPY™ FL C16 fluorescence normalized to cell size (left) and representative flow histogram of BODIPY™ FL C16 fluorescence (right) of cells as in (a). c and d, cells treated as in (a) and (b) were analyzed by Amnis ImageStream to determine cellular location of the fluorescent probes. The adaptive erode function was used to generate masks encompassing the measurement of fluorescence of either the total cell (100% adaptive erode, left of c and d; see Extended Data Fig. 4g left for representative images) or only the inside of the cell (70% adaptive erode, middle of c and d; see Extended Data Fig. 4g right for representative images of adaptive erode function). The ratios of intracellular to total 2-NBDG (c) and BODIPY™ FL C16 (d) are plotted to the right. (a-d) One representative experiment is presented (results of independent experiments and representative Amnis ImageStream images are shown in Fig. S4). Bars represent mean +/− SEM; *p ≤ 0.05; **p ≤ 0.01; ***p ≤ 0.001; ****p ≤ 0.0001 by unpaired, two-tailed t-test.
Fig. 4.
Fig. 4.. GCBCs upregulate and rely on peroxisomal FAO for oxygen consumption.
a, Representative Amnis ImageStream images (left) and histogram traces (right) of indicated cell types stained intracellularly for the peroxisomal protein PMP70. b, Representative OCR traces (left) of in vivo activated or GCBCs treated in-Seahorse sequentially with 100nM thioridazine (inhibitor of peroxisomal β-oxidation), 40μM etomoxir (inhibitor of mitochondrial FA uptake), and rotenone/antimycin a. Tabulated results (center and right) from four experiments, expressed as a percentage of thioridazine or etomoxir sensitive OCR, computed after subtraction of values measured after rotenone/antimycin a treatment. Bars represent mean +/− SEM; *** p < 0.001, **** p < 0.0001 by unpaired, two-tailed t-test.
Fig. 5.
Fig. 5.. GCBCs are sensitive to dual mitochondrial and peroxisomal FAO in vitro and in vivo.
a, Tabulated cell death data, measured by flow cytometry as fixable viability stain (FVS) and Caspglow™ positive, from in vitro activated or d13 GCBCs cultured with anti-CD40 in the presence of the indicated inhibitors for the indicated times (n=4). b, Cell cycle analysis of cells treated as in (a) pulsed with 25 μM EdU for 30min prior to harvest (n=4). c, d and e, Absolute number of live splenic NP-specific GCBCs (c), naïve NP B cells (d) and MFI of 2-NBDG of GCBCs after 30min 2-NBDG in vitro pulse (e) from mice at d14 post NP-CGG immunization given 22mg/kg etomoxir and 11mg/kg thioridazine or vehicle only at d9 and d13 post-immunization. (a) and (b) depict 1 representative of 2 experiments with 4 replicate cultures of indicated samples. GCBCs were pooled from 19 B1–8+/– Balb/c mice at day 14 after NP-CGG immunization and NBC were pooled from 6 unmanipulated B1–8+/– Balb/c mice to generate in vitro activated B cells. (c-d) are from one experiment with two inhibitor doses, which was replicated with an additional in vivo dose in Extended Data Fig. 5; Bars represent mean +/− SEM; *p ≤ 0.05; ***p ≤ 0.001, **** p ≤ 0.0001 by unpaired, two-tailed t-test.
Fig. 6.
Fig. 6.. 13C carbon tracing of glucose and palmitate in cultured B cells by LC-HRMS.
a-j, Bead-purified naive, in vivo activated and GCBCs were cultured in glucose and glutamine free RPMI media with anti-CD40 stimulation to maintain viability. Cells were either exposed to 2mg/ml ([13C6]-glucose (a-h and upper panels of i and j) or 100mM [13C16]-palmitate and 2mg/ml unlabeled glucose (lower panels of i and j) for 4h. Cell lysates (a, c-j) and supernatants (b) were then subjected to LC-HRMS. Shown are normalized intensities (as described in the Methods section) for depicted molecules and ratios of labeled (M+2) to total amounts. Depicted is one representative experiment with n=3–6 per sample. Each n represents a pool of 3 individual wells with 1×10⁶ cells each. Data from an independent experiment are in Extended Data Fig. 6. Bars represent mean +/− SEM. Statistical comparisons are not shown for naïve cells except for ratios in right panels of (i) and (j). *p ≤ 0.05; **p ≤ 0.01; ***p ≤ 0.001; ****p ≤ 0.0001 by unpaired, two-tailed t-test.
Fig. 7
Fig. 7. Comparison of GCBCs and activated B cells for glycolysis-relevant gene expression.
a, plot depicts the 43 genes expressed at > 10 transcript per million (TPM) in our RNA sequencing datasets (n=3; GSE128710) out of 67 genes annotated in the glycolysis pathway (source: https://rgd.mcw.edu/wg/; PW:0000640). X-axis shows log2-fold change of these genes between GCBCs compared to in vivo activated B cells. Y-axis displays the −log10 transformed FDR values. Significantly differentially expressed genes (FDR < 0.05) are marked in red; p-values were calculated using the moderated t-test implemented in the R limma package. b, gene set enrichment analysis (GSEA) plot illustrating significant (p=0.01) downregulation of glycolysis pathway genes (as in (a)) in GCBCs (n=3) compared to in vivo activated B cells (n=3). The p-value was calculated using rankSumTestWithCorrelation function from R limma package. c, Glycolysis/ Gluconeogenisis KEGG pathway (https://www.genome.jp/kegg-bin/show_pathway?map00010) annotated with gene expression and 13C tracing data using Pathview (https://pathview.uncc.edu/). Genes are represented as boxes and metabolites as circles. Each box and circle is divided into 6 partitions, with the leftmost three representing GCBCs and the rightmost 3 representing in vivo activated B cells. The colors in each segment encode Z-scored log2-transformed normalized gene expression data for all replicates (n = 3) in boxes and Z-scored carbon tracing measurements (first 3 replicates as in Fig. 6) in circles. For genes with multiple isoforms, Z-scores of the highest expressed isoform are shown in boxes. Z-scores are encoded by color intensity according to the scale key at the top of the figure. Genes and metabolites with lower Z-scores are indicated by blue and green, while genes and metabolites with high Z-scores are indicated by orange and yellow, respectively. Genes with < 10 TPM are indicated in gray. Numbers in boxes are either other molecules and chemical compounds as per the KEGG Pathway map or they are not annotated in the Pathview version of KEGG.
Fig. 8.
Fig. 8.. Competitive disadvantage of GCBCs after targeted CPT2 mRNA reduction.
a, Experimental outline of competitive GC development using in vitro-transduced B cells with shRNA retroviral vectors. B cells from CD45.1 or CD45.2 Balb/c mice were transduced with retroviral shRNA vectors targeting the mRNAs encoding CD8 (control gene; CD45.1 in blue) or CPT2 (CD45.2 in green) after stimulation with CpG DNA. Retrovirally transduced cells express the fluorescent reporter protein Ametrine. Transduced cells were co-transferred into NP-unresponsive CD45.1/2 AM14tg+ Vk8R+/– mice that had been CGG carrier-primed 4 days earlier. Recipients were immunized i.p. with NP-CGG in alum and analyzed 13 days later. b, Gating strategy to identify CD8- and CPT2-transfected live Ametrine+ non-GC (CD38+ CD95) and GCBCs (CD38 CD95+) singlets within the same animal. Complete gating strategy is shown for GCBCs only but was also applied for non-GCBCs. c, qRT-PCR of sort-purified GCBCs 7 days post immunization. Shown are 3 replicates of CPT2 mRNA levels of 2 individual mice (indicated as circles or triangles) normalized to GAPDH. d, Competitive ratio of control CD8- to CPT2-targeted B cells in non-GC, GCBCs and input cells. The ratio is the number of shRNAmiR-CD8a transduced CD45.1/1 Ametrine positive B cells divided by the number of shRNAmiR-CPT2 CD45.2/2 transduced Ametrine positive B cells after gating on each compartment. Dashed line represents input transduction ratio at the time of cell transfer. Data are from two independent experiments depicted as circles or triangles; data points in grey represent mice with less than 200 Ametrine positive cells recovered. Statistical comparison with and without data points depicted in grey resulted in the same degrees of statistical significance. Bars represent mean +/− SEM; ***p ≤ 0.001; ****p ≤ 0.0001 by unpaired, two-tailed t-test.

Comment in

References

    1. Herrera E, A CM & Blasco MA Impaired germinal center reaction in mice with short telomeres. EMBO J 19, 472–481 (2000). - PMC - PubMed
    1. Raso F et al. αv Integrins regulate germinal center B cell responses through noncanonical autophagy. J. Clin. Invest 128, 4163–4178 (2018). - PMC - PubMed
    1. Allen CDC, Okada T & Cyster JG Germinal-center organization and cellular dynamics. Immunity 27, 190–202 (2007). - PMC - PubMed
    1. Shlomchik MJ & Weisel F B cell primary immune responses. Immunol Rev 288, 5–9 (2019). - PubMed
    1. Ganeshan K & Chawla A Metabolic Regulation of Immune Responses. Annu Rev Immunol 32, 609–634 (2014). - PMC - PubMed

Publication types

MeSH terms