. 2020 Mar;21(3):343-353.
doi: 10.1038/s41590-020-0602-z. Epub 2020 Feb 17.

Distinct microbial and immune niches of the human colon

Affiliations

Distinct microbial and immune niches of the human colon

Kylie R James et al. Nat Immunol. 2020 Mar.

Abstract

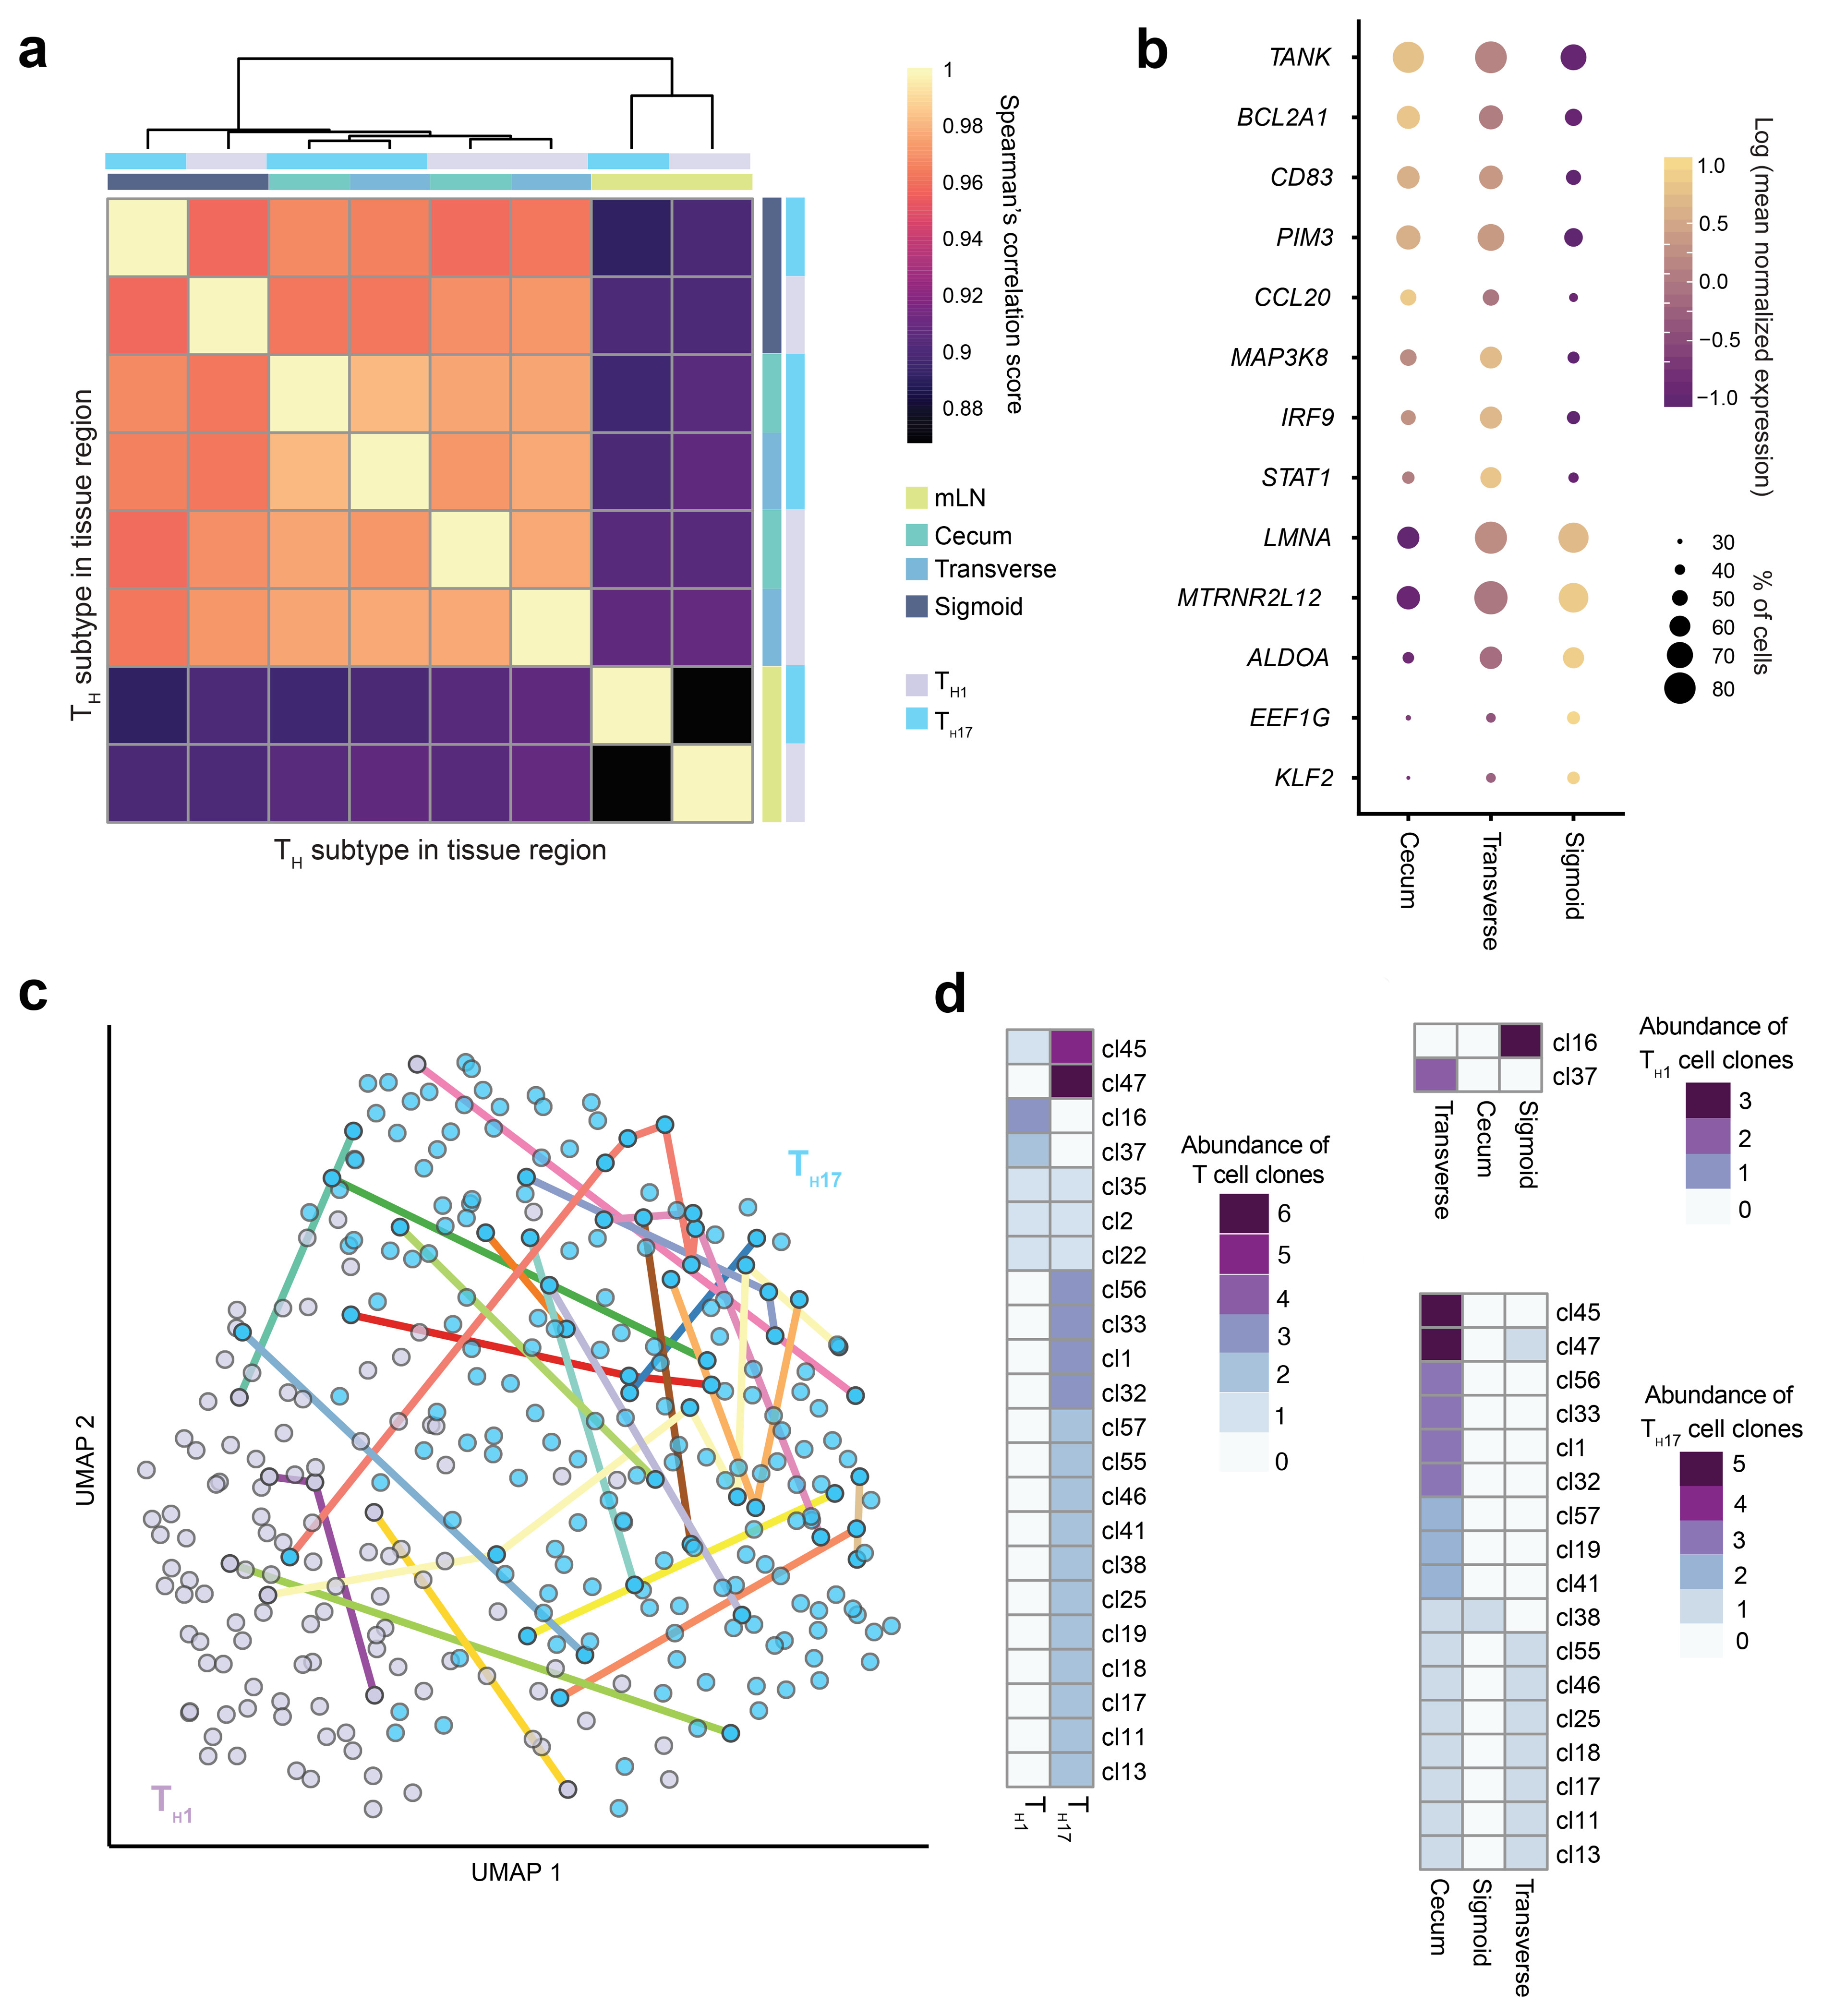
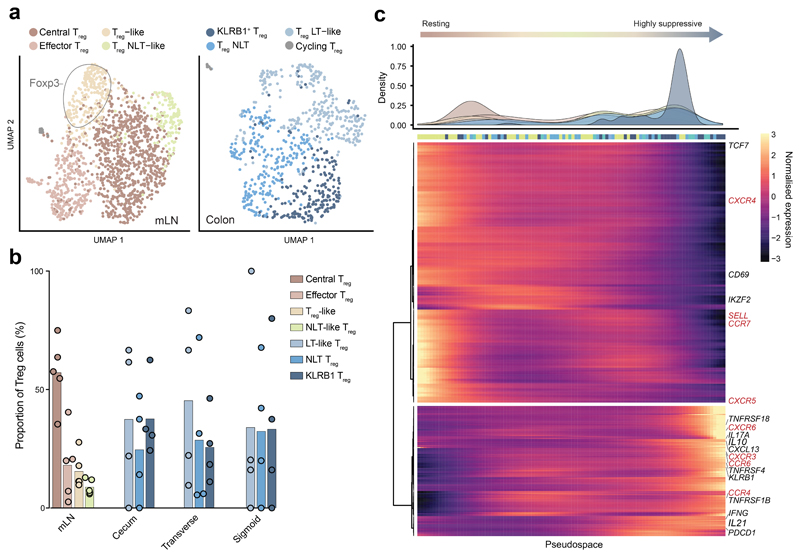
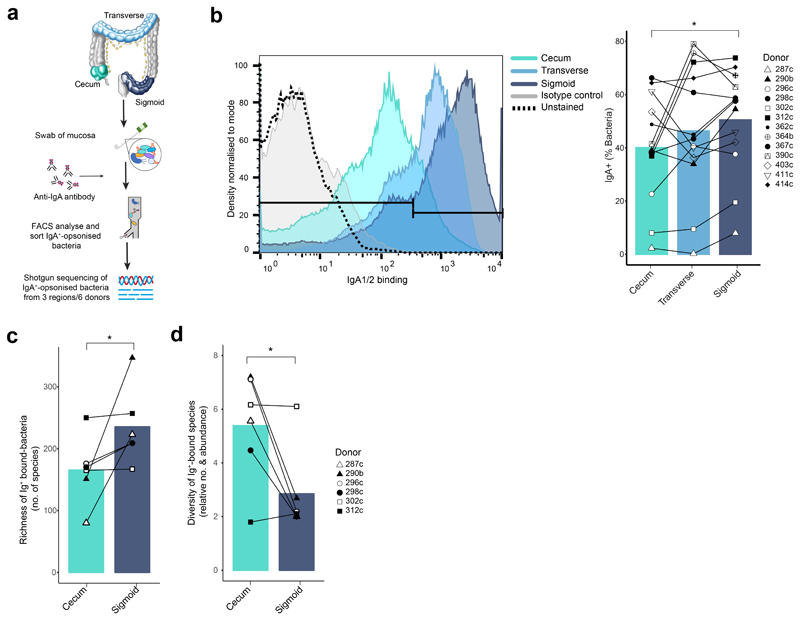
Gastrointestinal microbiota and immune cells interact closely and display regional specificity; however, little is known about how these communities differ with location. Here, we simultaneously assess microbiota and single immune cells across the healthy, adult human colon, with paired characterization of immune cells in the mesenteric lymph nodes, to delineate colonic immune niches at steady state. We describe distinct helper T cell activation and migration profiles along the colon and characterize the transcriptional adaptation trajectory of regulatory T cells between lymphoid tissue and colon. Finally, we show increasing B cell accumulation, clonal expansion and mutational frequency from the cecum to the sigmoid colon and link this to the increasing number of reactive bacterial species.


Conflict of interest statement

Competing interests

S.C.F. and T.D.L. are either employees of, or consultants to, Microbiotica Pty Ltd.

Figures

Figure 1
Figure 1. Variation in the microbiome from proximal to distal colon.
a) Workflow for 16S ribosomal sequencing of matching mucosal microbiomes and scRNA-seq profiling of immune cells from mesenteric lymph node (mLN), and lamina propria of cecum, transverse colon and sigmoid colon. b) Phylogenetic tree representing diversity and mean abundance of bacterial species in the cecum, transverse colon and sigmoid colon. Mean abundance was calculated as the percentage of operational taxonomic units (OTUs) for each species from total as determined by 16S rRNA sequencing and averaged for twelve donors (black scale). Unassigned OTUs are shown as black branches. Bacteria groups of interest are highlighted. c) Relative abundances of OTUs at genus level of bacteria species in colon regions as in (b).
Figure 2
Figure 2. Profiling immune cells along the steady-state colon.
a) UMAP illustration of pooled scRNA-seq data of immune cells of mLN, cecum, transverse colon and sigmoid colon from five donors colored by cell type annotation (left) and tissue of origin (right). b) Heatmap of mean expression of marker genes used to annotate cell types in (a). Point size shows the fraction of cells with nonzero expression. c) Relative percentages of CD4+ T subtypes within all CD4+ T cells for each tissue as in (a). d) Relative percentages of cell types within all non-CD4+ T immune cells for each tissue as in (a), with B lineage cells shown in the left panel and all other cell types in the right panel.
Figure 3
Figure 3. Dissemination of T helper cells in colon and region-determined transcriptional profiles.
a) Correlation matrix of mean transcriptional profiles of TH1 and TH17 cells from cecum, transverse colon, sigmoid colon and mLN (n=5 donors). b) Mean expression level of differentially expressed genes of pooled TH1 and TH17 between cecum, transverse colon and sigmoid colon as in (a). Point size shows the fraction of cells with nonzero expression. c) UMAP projection of Smartseq2 profiled flow-sorted T cells annotated as TH1 and TH17 cells of the cecum, transverse colon and sigmoid colon (n=1 donor). Colored lines connect cells sharing the same CDR3 sequence. d) Heatmap of numbers of members within clonal families in TH1/TH17 subsets (left) and colon region (right) as in (c).
Figure 4
Figure 4. Treg activation pathway from lymphoid to peripheral tissue.
a) UMAP visualization of Treg subtypes in mLN (left) and pooled from cecum, transverse colon and sigmoid colon (right) (n=5 donors). b) Relative proportions of Treg subsets within all Treg cells from mLN and colon tissue regions as in (a). Bars show mean proportion across all donors (circles). c) Density of Treg subclusters as in a across ‘pseudospace’ (top) and expression kinetics of genes contributing to pseudospace smoothed into 100 bins (filtered by qval < 0.001 and expression in >15 cells). Top bar shows the most represented tissue within each bin. Various dynamically expressed immune-related molecules are annotated, with key genes colored red.
Figure 5
Figure 5. B cells are more abundant, clonally expanded and mutated in the sigmoid colon.
a) Mean expression of key differentially expressed genes by IgA+ plasma cells in cecum, transverse colon and sigmoid colon (n=5 donors). Point size shows the fraction of cells with nonzero expression. b) Proportion of CD27+ B cells of total B cells from cecum, transverse colon and sigmoid colon determined by flow cytometry (n=4 donors). Bar represents the mean and connected points represents values of each donor. Analysis is a two-tailed paired t test. c) UMAP visualization of B cells for which matched single-cell VDJ libraries were derived using 10x Genomics 5’ scRNA-seq (n=2 donors) colored by cell type annotation (left), tissue (middle) and antibody isotype (right). Bar plot of antibody isotype frequencies per annotated cell type (far right). d) UMAP visualization of somatic hypermutation frequencies of IgH sequences as in (c). e) Quantitation of somatic hypermutation frequencies of IgH sequences from B cell types and gut regions as in (c). f) Estimated clonal abundances per donor for members of expanded B cell clones in B cell types and gut regions as in (c). g) Binary count of co-occurrence of expanded B cell clones identified by single-cell VDJ analysis shared across gut regions as in (c). h) Co-occurrence of expanded B cell clones identified by bulk B cell receptor sequencing across gut regions (n=3 donors). Statistics in (e) and (f) are calculated with two-sided Wilcoxon signed-rank tests. Rows and columns in (g) and (H) are ordered by hierarchical clustering. * P <0.05; ** P <0.01; *** P <0.001; **** P <0.0001
Figure 6
Figure 6. Increasing number of microbiota species recognized by antibodies in the sigmoid colon.
a) Experimental workflow for assessing Ig-opsonized colon bacterial species. b) Representative histogram of IgA1/2-bound Hoechst+ bacteria and summary plot of bound bacteria as a proportion of total bacteria (n=13 donors). Positive binding is set against an isotype control. c) Richness of bacteria species determined as the number of unique species and d) diversity of species identified from shotgun sequencing of Ig-opsonized bacteria from (b) (n=6 donors). P values were calculated using one-tailed paired t tests. * P <0.05

Comment in

References

    1. Halfvarson J, et al. Dynamics of the human gut microbiome in inflammatory bowel disease. Nat Microbiol. 2017;2 17004. - PMC - PubMed
    1. Donaldson GP, Lee S Melanie, Mazmanian SK. Gut biogeography of the bacterial microbiota. Nature Reviews Microbiology. 2016;14:20–32. - PMC - PubMed
    1. Wang X, Heazlewood SP, Krause DO, Florin THJ. Molecular characterization of the microbial species that colonize human ileal and colonic mucosa by using 16S rDNA sequence analysis. J Appl Microbiol. 2003;95:508–520. - PubMed
    1. Mowat AM, Agace WW. Regional specialization within the intestinal immune system. Nat Rev Immunol. 2014;14:667–685. - PubMed
    1. Denning TL, et al. Functional Specializations of Intestinal Dendritic Cell and Macrophage Subsets That Control Th17 and Regulatory T Cell Responses Are Dependent on the T Cell/APC Ratio, Source of Mouse Strain, and Regional Localization. The Journal of Immunology. 2011;187:733–747. - PMC - PubMed

Publication types