. 2020 Mar;21(3):298-308.
doi: 10.1038/s41590-019-0589-5. Epub 2020 Feb 17.

CD36-mediated metabolic adaptation supports regulatory T cell survival and function in tumors

Affiliations

CD36-mediated metabolic adaptation supports regulatory T cell survival and function in tumors

Haiping Wang et al. Nat Immunol. 2020 Mar.

Abstract

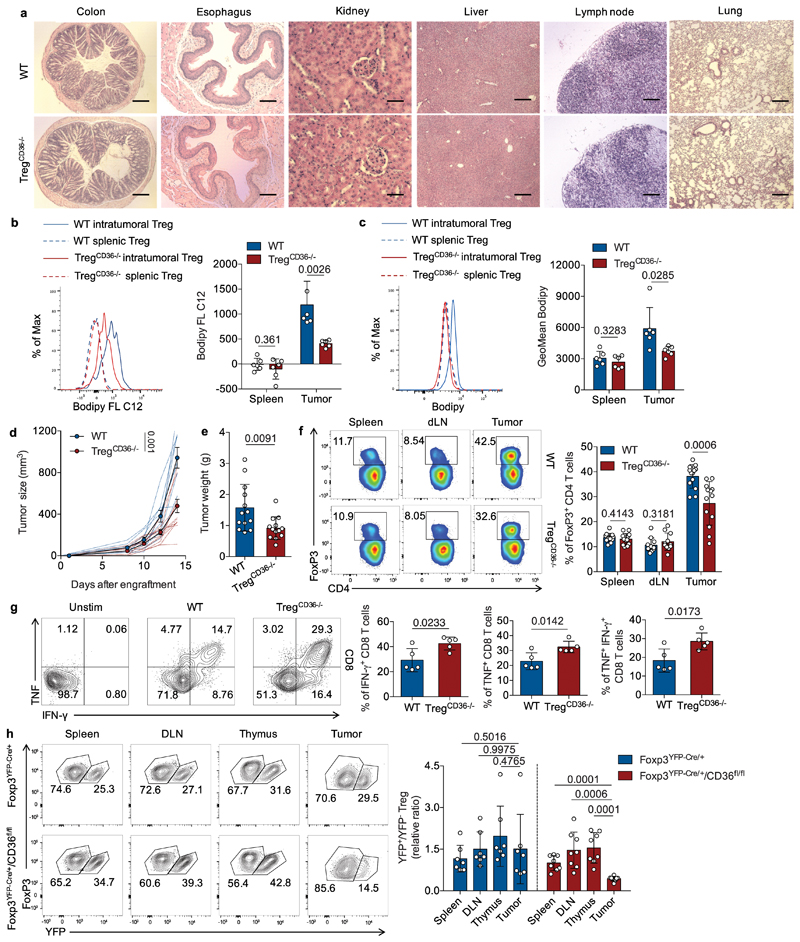
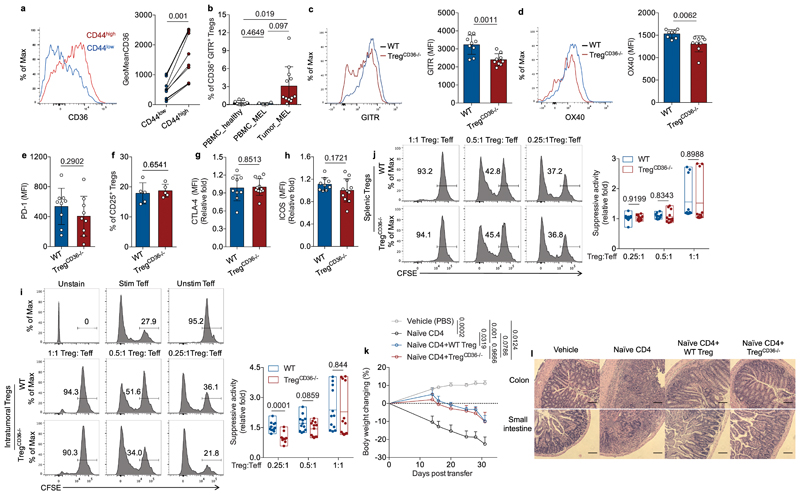
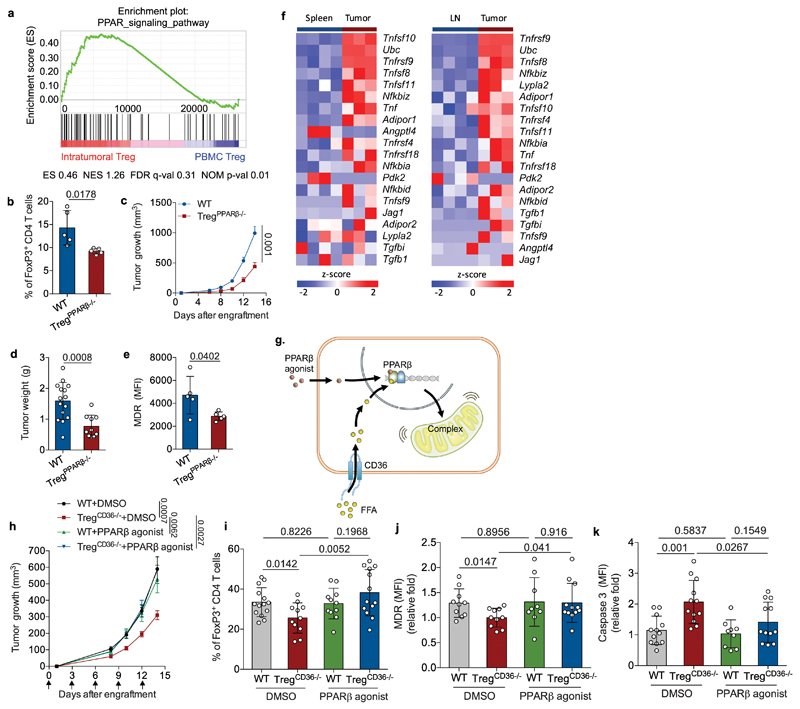
Depleting regulatory T cells (Treg cells) to counteract immunosuppressive features of the tumor microenvironment (TME) is an attractive strategy for cancer treatment; however, autoimmunity due to systemic impairment of their suppressive function limits its therapeutic potential. Elucidating approaches that specifically disrupt intratumoral Treg cells is direly needed for cancer immunotherapy. We found that CD36 was selectively upregulated in intrautumoral Treg cells as a central metabolic modulator. CD36 fine-tuned mitochondrial fitness via peroxisome proliferator-activated receptor-β signaling, programming Treg cells to adapt to a lactic acid-enriched TME. Genetic ablation of Cd36 in Treg cells suppressed tumor growth accompanied by a decrease in intratumoral Treg cells and enhancement of antitumor activity in tumor-infiltrating lymphocytes without disrupting immune homeostasis. Furthermore, CD36 targeting elicited additive antitumor responses with anti-programmed cell death protein 1 therapy. Our findings uncover the unexplored metabolic adaptation that orchestrates the survival and functions of intratumoral Treg cells, and the therapeutic potential of targeting this pathway for reprogramming the TME.


Conflict of interest statement

Competing Interests Statement

H.W. and P.-C.H. are inventors of patent application related to targeting CD36 in cancer immunotherapy. P.-C.H. is serving as a member of scientific advisory board for Elixiron Immunotherapeutics and receiving research grants from Roche and Idorsia. J.D.W. is serving as a consultant for Adaptive Biotech; Advaxis; Amgen; Apricity; Array BioPharma; Ascentage Pharma; Astellas; Bayer; Beigene; Bristol Myers Squibb; Celgene; Chugai; Elucida; Eli Lilly; F Star; Genentech; Imvaq; Janssen; Kyowa Hakko Kirin; Kleo Pharma; Linneaus;MedImmune; Merck; Neon Therapuetics; Northern Biologics; Ono; Polaris Pharma; Polynoma; Psioxus; Puretech; Recepta; Takara Bio; Trieza; Sellas Life Sciences; Serametrix; Surface Oncology; Syndax; Synthologic. J.D.W. received research support from Bristol Myers Squibb; Medimmune; Merck Pharmaceuticals; Genentech and has equity in Potenza Therapeutics; Tizona Pharmaceuticals; Adaptive Biotechnologies; Elucida; Imvaq; Beigene; Trieza; Linneaus. P.C.H. received honorarium from Pfizer and Chugai and J.D.W received honorarium from Esanex.

Figures

Extended Data Fig. 1
Extended Data Fig. 1. Lipid accumulation and increased CD36 expression in intratumoral Treg cells.
a, b, Quantitative results of geometric mean (GeoMean) fluorescent intensity of Bodipy FL C12 (a) and Bodipy 493/503 (Bodipy) (b) in Treg cells from paired TILs and PBMCs of non-small cell lung cancer (NSCLC) patients (n=6 per group). c, d, Quantitative results of GeoMean fluorescent intensity of Bodipy FL C12 (c) and Bodipy 493/503 (d) in Treg cells from paired PBMC and tumor infiltrated lymph nodes (TILNs) of melanoma patients (n=19). e, f, Quantitative results of fluorescent intensity of Bodipy FL C12 in Treg cells from indicated tissues of B16 melanoma-bearing mice (dLN, n=7; Spleen, n=6; Thymus, n=7; Tumor, n=6) (e), and MC38 colon carcinoma-bearing mice (n=8) (f). g, Quantitative result of GeoMean fluorescent intensity of CD36 surface staining in Treg cells from paired TILs and PBMCs of NSCLC patients (n=6) h, i, j, k, Quantitative results of surface expression of CD36 in Treg cells of indicated tissues from B16-OVA melanoma-bearing B6 mice (n=6, one outlier was removed from dLN) (h), inducible Braf/Pten melanoma-bearing mice (n=9) (i), K-rasLSL-G12D/+/p53fl/fl mouse model of NSCLC (Blood, n=8; Tumor, n=13) (j), and MC38 colon cancer (n=8) (k). l, CD36 expression in iTreg cells cultured in different indicated conditions for 48h. (RPMI: normal cell culture RPMI 1640 medium indicated in methods; CM, cancer cell conditioned medium, n=4 per group). m, CD36 expression in iTreg cells cultured in cancer cell-conditioned medium treated with control procedure or lipid removal procedure for 48h. (n=6 per group). Data are representative result of at least two independent experiments with similar results (l, m) or cumulative results from at least two independent experiments (a, b, c, d, e, f, g, h, i, j, k). Each symbol represents one individual. Data are mean ± S.D. and were analyzed by two-tailed, unpaired Student’s t-test (e, f, h, i, j, k, l, m) or two-tailed, paired Student’s t-test (a, b) or one-tailed, paired Student’s t-test (c, d, g).
Extended Data Fig. 2
Extended Data Fig. 2. CD36 expression supports the accumulation and suppressive function of intratumoral Treg cells.
a, Body weight of WT and TregCd36-/- mice at the age of 21-23 weeks (WT male, n=4; TregCd36-/- male, n=6; WT female, n=6; TregCd36-/- female, n=5;). b, Representative plots (left) and quantitative frequency of CD44hi/CD62Llow CD4+ or CD8+ T cells (right) in aged WT and TregCd36-/- mice (n=7 per group). c, Representative images of hematoxylin and eosin (H&E) staining for indicated tissues from WT or TregCd36-/- mice at the age of 21-23 weeks. Scale bar, 200 µm. d, e, Tumor growth of B16-OVA melanoma (n=7 per group) (d) or MC38 colon carcinoma (n=6 per group) (e) from WT or TregCd36-/- mice. f, g, h, Absolute number of FoxP3+ Treg cells per gram tumor (f), percentage of CD8+ T cells out of CD3+ T cells among tumor-infiltrating T cells (g), and the ratio of CD8+ to Treg cell TIL density (h) of YUMM1.7 melanoma-bearing WT and TregCd36-/- mice (n=11 per group). i, Representative plots (left) and percentage of indicated cytokine-producing CD4+ T cells among total tumor-infiltrating CD4+ T cells from indicated mice (right) (n=5 per group). Data are representative result of at least two independent experiments with similar results (c, d, e, i) or cumulative results from at least two independent experiments (a, b, f, g, h) Each symbol represents one individual. Data are mean ± S.D. (a, b, f, g, h, i) or ± S.E.M. (d, e) and were analyzed by two-tailed, unpaired Student’s t-test.
Extended Data Fig. 3
Extended Data Fig. 3. Effects of CD36 in expression of activation markers and stability of intratumoral Treg cells.
a, Representative images of guts (a) and spleens (b) from indicated group of Rag1-/- mice. c, d, e, Expression of CD44 (n=17) (c), CD103 (n=5) (d), and KLRG1 (n=5) (e) in intratumoral Treg cells of YUMM1.7 melanoma-bearing WT and TregCd36-/- mice. f, The expression of YFP in intratumoral Treg cells of YUMM1.7 melanoma-bearing WT and TregCd36-/- mice (n=15). g, h, i, Representative plots of IFNγ and TNF production among total intratumoral Treg cells from indicated mice (g), and quantitative result of percentage of IFNγ-producing (n=19 per group) (h) and TNF-producing (n=18, one outlier was removed from TregCd36-/-) (i) Treg cells among total intratumoral Treg cells of indicated mice. j, Expression of Ki67 in intratumoral Treg cells of YUMM1.7 melanoma-bearing WT and TregCd36-/- mice (n=10 per group). k, Representative histograms (left) and quantitative analysis (right) of Annexin V staining in intratumoral Treg cells from WT and TregCd36-/- tumor-bearing mice (n=14 per group). l, Quantitative analysis of cleaved caspase-3 levels in Treg cells of indicated tissues from WT (n=13 per group except for thymus, n=9) and TregCd36-/- (n=14 per group except for thymus, n=9) tumor-bearing mice. LN: non-draining lymph node; DLN: draining lymph node. Data are representative results of two independent experiments with similar results (a, b, d, e) or cumulative results from at least three independent experiments (c, f, g, h, i, j, k, l). Each symbol represents one individual. Data are mean ± S.D. (c, d, e, f, h, i, j, k, l) and were analyzed by two-tailed, unpaired Student’s t-test.
Extended Data Fig. 4
Extended Data Fig. 4. CD36-deficiency results in a metabolic shift and elevated apoptosis in Treg cells.
a, Indicated iTreg cells cultured in cancer cell-conditioned medium for 48 hrs (n=3 per group). Oxygen consumption rate (OCR) of indicated iTreg cells was measured and then followed by treatment with oligomycin, FCCP, and antimycin A plus Rotenone (n≥4 per group). b, Indicated iTreg cells cultured in cancer cell-conditioned medium for 48 hrs (n≥4 per group) and then media were refreshed with Seahorse Flux assay media without glucose. Basel extracellular acidification rate (ECAR) of indicated iTreg cells was measured and then followed by treatment with glucose, oligomycin, FCCP and 2-DG (n=4 per group). c, Quantitative result of glycolysis and glycolytic capacity based on the measurement of b. d, The viability of either WT or TregCd36-/- iTreg cells cultured under indicated conditions for 72 hrs (n=6 per group). Data are representative results of three independent experiments with similar results (a, b, c, d). Data are mean ± S.D. and were analyzed by two-tailed, unpaired Student’s t-test (c, d).
Extended Data Fig. 5
Extended Data Fig. 5. Intratumoral Treg cells require PPAR-β, not PPAR-γ, signaling for metabolic adaptation.
a, Enrichment plots of signals controlling mitochondrial matrix (left) and mitochondrial envelope in intratumoral Treg (n=4) compared to PBMC Treg cells (n=6), identified by GSEA computational method. ES: enrichment score; NES: normalized enrichment score; FDR: false discovery rate; NOM p-val: Nominal p value. b, c, d, Percentage of FoxP3+ Treg cells among CD4+ tumor-infiltrating T lymphocytes (n=5) (b), tumor growth (n=5) (c) and tumor weight (n=7) (d) from tumor-bearing WT and TregPPARγ-/- mice. e, Percentage of CD8+ T cells among tumor-infiltrating T cells from tumor-bearing WT and TregPPARβ-/- mice (n=10). f, Quantitative result of CD36+ intratumoral Treg cells from YUMM1.7 melanoma-bearing WT and TregPPARβ-/- mice (WT, n=14; TregPPARβ-/-, n=11). g, NAD/NADH ratio of indicated iTreg cells cultured in cancer cell-conditioned medium with DMSO or PPAR-β agonist for 48h (DMSO, n=8; PPAR-β agonist, n=10). Data are representative results of at least two independent experiments with similar results (b, c, d) or cumulative results from at least two independent experiments (e, f, g). Each symbol represents one individual. Data are mean ± S.D. (b, d, e, f, g) or ± S.E.M. (c) and were analyzed by two-tailed, unpaired Student’s t-test.
Extended Data Fig. 6
Extended Data Fig. 6. CD36-targeting unleashes host antitumor immunity.
a, b, c, d, Absolute number of FoxP3+ Treg cells per gram tumor (n=10 per group) (a), percentage of CD8+ T cells among tumor-infiltrating T cells (n=10 per group) (b) and representative plots and percentage of indicated cytokine-producing CD8+ T cells among total tumor-infiltrating CD8+ T cells (c) and CD4+ T cells among total tumor-infiltrating CD4+ T cells (d) from YUMM1.7 melanoma-bearing mice treated with indicated treatments (n=10 per group). e, f, Tumor growth (e) and survival curves (f) of YUMM1.7 melanoma-bearing B6 mice treated with indicated treatments (Ctrl, n = 10; α-PD1, n = 10; α-CD36, n = 11; α-CD36 + αPD-1, n = 11). Arrows indicate the date of treatment. Dotted lines indicate the tumor volume of 800 mm3. Data are cumulative results from at least two independent experiments. Each symbol represents one individual. Data are mean ± S.D. and were analyzed by two-tailed, unpaired Student’s t-test (a, b, c, d). Difference between survival curves was analyzed by Log-rank (Mantel-Cox) test (f).
Fig. 1
Fig. 1. Intratumoral Treg cells elevates expression of CD36 and genes involved in lipid metabolism.
a, Pathway enrichment analysis focusing on metabolic machineries for RNA expression in Treg cells from breast cancers (n=4) and PBMC (n=6) of breast cancer patients. Pathways with significant differential expression between intratumoral and PBMC Treg cells (Nominal p value<0.05) were presented based on gene hit size. b, Enrichment plots of fatty acid metabolic process (top) and lipid binding (bottom) pathways in intratumoral Treg cell compared to PBMC Treg cells, identified by gene set enrichment analysis (GSEA) computational method. Columns indicate individual samples, and rows are each gene. Red represents a high expression level, and blue indicates a low expression level. c, d, Representative histogram (left) and quantitative results of geometric mean (GeoMean) fluorescent intensity (right) of Bodipy FL C12 (n=6, one outlier was removed from the thymus group) (c) and Bodipy 493/503 (Bodipy) (n=5) (d) in Treg cells from indicated tissues of Yumm1.7 melanoma-bearing B6 mice. DLN: draining lymph node; spleen; thymus; tumor. e, f, Representative histogram (left) and quantitative results of geometric mean (GeoMean) fluorescent intensity of CD36 surface staining in Treg cells from PBMC and tumor infiltrated lymph nodes (TILNs) of melanoma patients (n=12) (e) and from indicated tissues of Yumm1.7 melanoma-bearing B6 mice (DLN, n=15; spleen, n=15; thymus, n=9; tumor, n=15) (f). TILs: tumor-infiltrating lymphocytes. Data are representative results of three independent experiments with similar results (c, d) or cumulative results from three independent experiments (e, f). Each symbol represents one individual. ES: enrichment score; NES: normalized enrichment score; FDR: false discovery rate; NOM p-val: Nominal p value. Data are mean ± S.D. and were analyzed by two-tailed, unpaired Student’s t-test (c, d, f) or by two-tailed, paired Student’s t-test (e).
Fig. 2
Fig. 2. Disruption of CD36 selectively impairs the accumulation and suppressive function of intratumoral Treg cells.
a, Representative images of haematoxylin and eosin (H&E) staining for indicated tissues from wild-type (WT) or TregCd36-/- mice at the age of 21-23 weeks. Scale bar, 200 µm. b, c, Representative histogram (left) and quantitative results of geometric mean (GeoMean) fluorescent intensity (right) of Bodipy FL C12 (b) and Bodipy 493/503 (c) in splenic and intratumoral Treg cells from Yumm1.7 melanoma-bearing WT or TregCD36-/- mice (n=6 per group). d, e, Tumor growth (WT, n=9; TregCd36-/-, n=10) (d) and tumor weight (n=13) (e) of YUMM1.7 melanoma from WT or TregCd36-/- mice. Foxp3YFP-Cre mice were used as WT mice. f, Representative plots (left) and percentage of FoxP3+ Treg cells among CD4+ T cells in indicated tissues of tumor-bearing WT and TregCd36-/- mice (spleen and tumor n=13; dLN, n=11). g, Representative plots (left) and percentage of indicated cytokine-producing CD8+ T cells among total tumor-infiltrating CD8+ T cells from indicated mice (right) (n=5 per group). h, Representative plots (left) and quantitative ratios (right) of CD36-deficient/WT Treg cells in tumors and indicated tissues from either Foxp3YFP-Cre/+/Cd36fl/fl female mice (n=8) or Foxp3YFP-Cre/+ female mice (n=7). Data are representative result of two independent experiments with similar results (b, c, g) or cumulative results from at least two independent experiments (d, e, f, h). Each symbol represents one individual. Data are mean ± S.D. (b, c, e, f, g, h) or ± S.E.M. (d) and were analyzed by two-tailed, unpaired Student’s t-test (b, c, d, e, f, g, h).
Fig. 3
Fig. 3. CD36 expression selectively supports suppressive activity of intratumoral Treg cells.
a, Representative histogram (left) and quantitative results of geometric mean (GeoMean) fluorescent intensity (right) of CD36 in CD44lo and CD44hi intratumoral Treg cells from Yumm1.7 melanoma-bearing WT mice (n=10). b, Percentage of CD36+ Treg cells among GITR+/FoxP3+ Treg cells of PBMCs from healthy donors (n=9) or melanoma patients (n=4) or TILs from melanoma patients (n=12). c, d, Representative histograms and quantitative results of geometric mean fluorescent intensity (MFI) of GITR (c) and OX40 (d) in intratumoral Treg cells from indicated mice (n=9 per group, one outlier was removed from OX40_WT group). e, f, g, h, Expression of PD-1 in intratumoral Treg cells (n=9 per group) (e), percentage of CD25+/FoxP3+ Treg cells among total intratumoral Treg cells population (n=5 per group) (f), and expression of CTLA-4 (g) and ICOS (h) (Foxp3YFP-Cre, n=9; TregCd36-/-, n=11) in intratumoral Treg cells of YUMM1.7 melanoma-bearing WT and TregCD36-/- mice. i, j, Ex vivo suppression of CFSE-labeled WT naïve CD8+ T cell proliferation by WT and TregCd36-/- Treg cells sorted from tumors (i) or spleens (j) with annotated ratios (n=12). k, Body weight measurement in Rag1-/- mice receiving naïve CD4+ T cell alone or in combination with either WT or TregCD36-/- Treg cells (vehicle, n=4; naïve CD4, n=7; WT Treg, n=6; TregCd36-/-, n=6). l, Representative images of haematoxylin and eosin (H&E) staining of colon and small intestine from indicated group of Rag1-/- mice. Scale bar, 200 µm. Data are representative result of three independent experiments with similar results (l, f) or cumulative results from at least two independent experiments (a, b, c, d, e, g, h, i, j, k). Each symbol represents one individual. Data are mean ± S.D. (a, b, c, d, e, f, g, h, i, j) or ± S.E.M. (k) and were analyzed by two-tailed, unpaired Student’s t-test (b, c, d, e, f, g, h, i, j, k) or two-tailed, paired Student’s t-test (a).
Fig. 4
Fig. 4. CD36 deficiency stimulates apoptosis in intratumoral Treg cells.
a, Representative histograms (left) and quantitative analysis (right) of cleaved caspase-3 levels in intratumoral Treg cells from WT (n=13) and TregCd36-/- tumor-bearing mice (n=14). b, Representative histograms (left) and quantitative analysis (right) of MitoTracker Deep Red (MDR) staining in Treg cells of spleen, non-draining lymph node (LN), draining lymph node (DLN), blood, thymus, and tumor from tumor-bearing WT and TregCd36-/- mice (n=11 per group). c, d, Representative electron microscope images (left) and quantitative plots (right) of mitochondrion number (c) and crista density (d) in splenic and intratumoral Treg cells from tumor-bearing WT and TregCd36-/- mice. Photo of individual cells was taken with EM for the mitochondrial calculation (WT spleen, n=15; WT tumor, n=16, TregCd36-/- spleen, n=14; TregCd36-/- tumor, n=17). Scale bars: 500 nm in (c) and 200 nm in (d). e, Expression of genes encoding mitochondrial tRNAs in WT and TregCd36-/- intratumoral Treg cells, assessed by RNA-seq (n=3 per group). f, OCR of indicated iTreg cell cultured in cancer cell-conditioned medium for 48 hrs (n=3 per group). g, The viability of either WT or TregCd36-/- iTreg cell cultured in cancer cell-conditioned medium as above and then treated with indicated concentration of lactic acids for another 72 hrs (n=4 in RPMI group; n=5 in other groups). h, NAD/NADH ratio of indicated iTreg cell cultured in cancer cell-conditioned medium for 48 hrs (n=16). i, Relative viability of either WT or TregCd36-/- iTreg cells treated with cancer cell-conditioned medium with or without NR (400 μM) for 72 hrs (n=11 per group). Results were normalized to the survival cells of control treatment in indicated group. NR: nicotinamide riboside. Data are representative result of three independent experiments with similar results (f, g) or cumulative results of three independent experiments (a, b, e, h, i). Data are mean ± S.D. and were analyzed by two-tailed, unpaired Student’s t-test.
Fig. 5
Fig. 5. PPAR-β signaling is required for metabolic adaptation in intratumoral Treg cells.
a, Enrichment plots of PPAR signaling pathways in intratumoral Treg cells (n=4) compared to PBMC Treg cells (n=6), identified by GSEA computational method. ES: enrichment score; NES: normalized enrichment score; FDR: false discovery rate; NOM p-val: Nominal p value. b, Percentage of FoxP3+ Treg cells among CD4+ tumor-infiltrating T lymphocytes from tumor-bearing WT and TregPPARβ-/- mice (n=5). c, d, Tumor growth (c) and tumor weight (d) of YUMM1.7 melanoma from WT or TregPPARβ-/- mice (WT, n=15; TregCd36-/-, n=10). Foxp3YFP-Cre mice were used as WT mice. e, Quantitative result of geometric MFI of MDR staining in intratumoral Treg cells from WT and TregPPARβ-/- mice (n=5 per group). f, Expression of target genes of PPAR-β in Treg cells from spleens, draining lymph nodes (LN) and tumor, assessed by RNA-seq. g, Illustration of postulated signaling cascade and the rationale for applying PPAR-β agonist in TregCd36-/- mice. h, i, WT and TregCd36-/- mice were engrafted with YUMM1.7 melanoma cells and then treated with either DMSO or PPARβ agonist as described in methods. Tumor growth (WT+DMSO, n=6; TregCd36-/-+DMSO, n=11; WT+PPAR-β agonist, n=5; TregCd36-/-+PPAR-β agonist, n=9) (h) and percentage of FoxP3+ Treg cells among CD4+ tumor-infiltrating T lymphocytes (WT+DMSO, n=14; TregCd36-/-+DMSO, n=11; WT+PPAR-β agonist, n=11; TregCd36-/-+PPAR-β agonist, n=13) (i) were analyzed. j, k, Quantitative analysis of MitoTracker Deep Red (MDR) staining (DMSO, n=10; PPAR-β agonist, n=12) (j) and expression of cleaved caspase-3 (k) in intratumoral Treg cells of WT and TregCd36-/- mice treated with indicated treatments (n=9 in WT+PPAR-β agonist group; n=12 in other groups). Data are representative result of three independent experiments with similar results (b, e) or cumulative results from at least three independent experiments (c, d, f, h, i, j, k). Data are mean ± S.D. (b, d, e, i, j, k) or ± S.E.M. (c, h) and were analyzed by two-tailed, unpaired Student’s t-test.
Fig. 6
Fig. 6. CD36-targeting impairs intratumoral Treg cells and primes tumors to PD-1 blockade.
a, b, c, Tumor growth (a) (Ctrl, n=4; α-CD36 Ab, n=6), percentage of FoxP3+ Treg cells among CD4+ T cells of indicated tissues (n=4) (b), and expression of cleaved caspase-3 in Treg cells isolated from indicated tissues (n=4) (c) of YUMM1.7 melanoma-bearing B6 mice treated with the indicated treatments. d, Tumor growth of YUMM1.7 melanoma-bearing WT and TregCd36-/- mice treated with either control vehicle (Ctrl) or α-CD36 mAb (WT+Ctrl, n=12; WT+α-CD36 Ab, n=10; TregCd36-/-+Ctrl, n=11; TregCd36-/-+α-CD36 Ab, n=10). e, f, Tumor growth (e) and survival curves (f) of YUMM1.7 melanoma-bearing WT and TregCd36-/- mice treated with the indicated treatments (WT, n=5; TregCd36-/-, n=4; WT+α-PD1, n=4; TregCd36-/-+α-PD1, n=4). Comparison between TregCd36-/- and TregCd36-/-+α-PD1 was done based on the readouts on day 16 and other comparisons were done based on the readouts on day 14. g, Tumor growth of inducible Braf/Pten melanoma-bearing mice treated with indicated treatments (Ctrl, n = 10; α-PD1, n = 11; α-CD36, n = 11; α-CD36 + αPD-1, n = 11). Arrows indicate the date of treatment. Data are representative result of at least two independent experiments with similar results (a, b, c, e, f) or cumulative results from at least two independent experiments (d, g). Each symbol represents one individual. Data are mean ± S.D. (b, c) or ± S.E.M. (a, d, e) and were analyzed by two-tailed, unpaired Student’s t-test. Difference between survival curves was analyzed by Log-rank (Mantel-Cox) test (f).

Comment in

References

    1. Roychoudhuri R, Eil RL, Restifo NP. The interplay of effector and regulatory T cells in cancer. Current opinion in immunology. 2015;33:101–111. doi: 10.1016/j.coi.2015.02.003. - DOI - PubMed
    1. Delgoffe GM, et al. Stability and function of regulatory T cells is maintained by a neuropilin-1-semaphorin-4a axis. Nature. 2013;501:252–256. doi: 10.1038/nature12428. - DOI - PMC - PubMed
    1. Saito T, et al. Two FOXP3(+)CD4(+) T cell subpopulations distinctly control the prognosis of colorectal cancers. Nat Med. 2016;22:679–684. doi: 10.1038/nm.4086. - DOI - PubMed
    1. Rech AJ, et al. CD25 blockade depletes and selectively reprograms regulatory T cells in concert with immunotherapy in cancer patients. Sci Transl Med. 2012;4:134ra162. doi: 10.1126/scitranslmed.3003330. - DOI - PMC - PubMed
    1. Sutmuller RP, et al. Synergism of cytotoxic T lymphocyte-associated antigen 4 blockade and depletion of CD25(+) regulatory T cells in antitumor therapy reveals alternative pathways for suppression of autoreactive cytotoxic T lymphocyte responses. J Exp Med. 2001;194:823–832. doi: 10.1084/jem.194.6.823. - DOI - PMC - PubMed

Publication types

MeSH terms