. 2020 Mar;27(3):240-248.
doi: 10.1038/s41594-020-0380-1. Epub 2020 Feb 17.

FANCD2-FANCI is a clamp stabilized on DNA by monoubiquitination of FANCD2 during DNA repair

Affiliations

FANCD2-FANCI is a clamp stabilized on DNA by monoubiquitination of FANCD2 during DNA repair

Pablo Alcón et al. Nat Struct Mol Biol. 2020 Mar.

Abstract

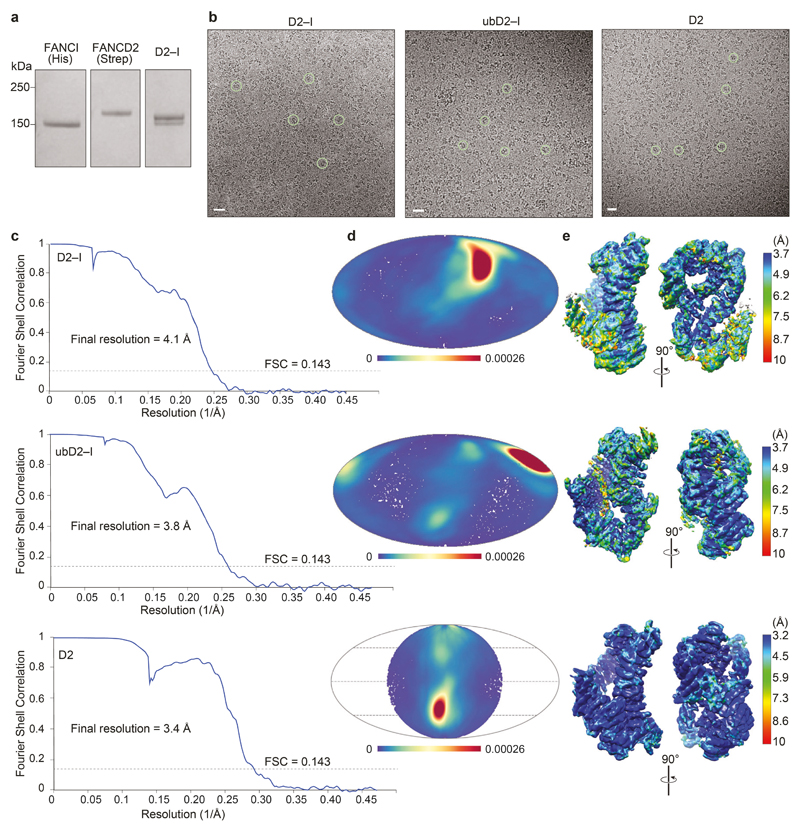
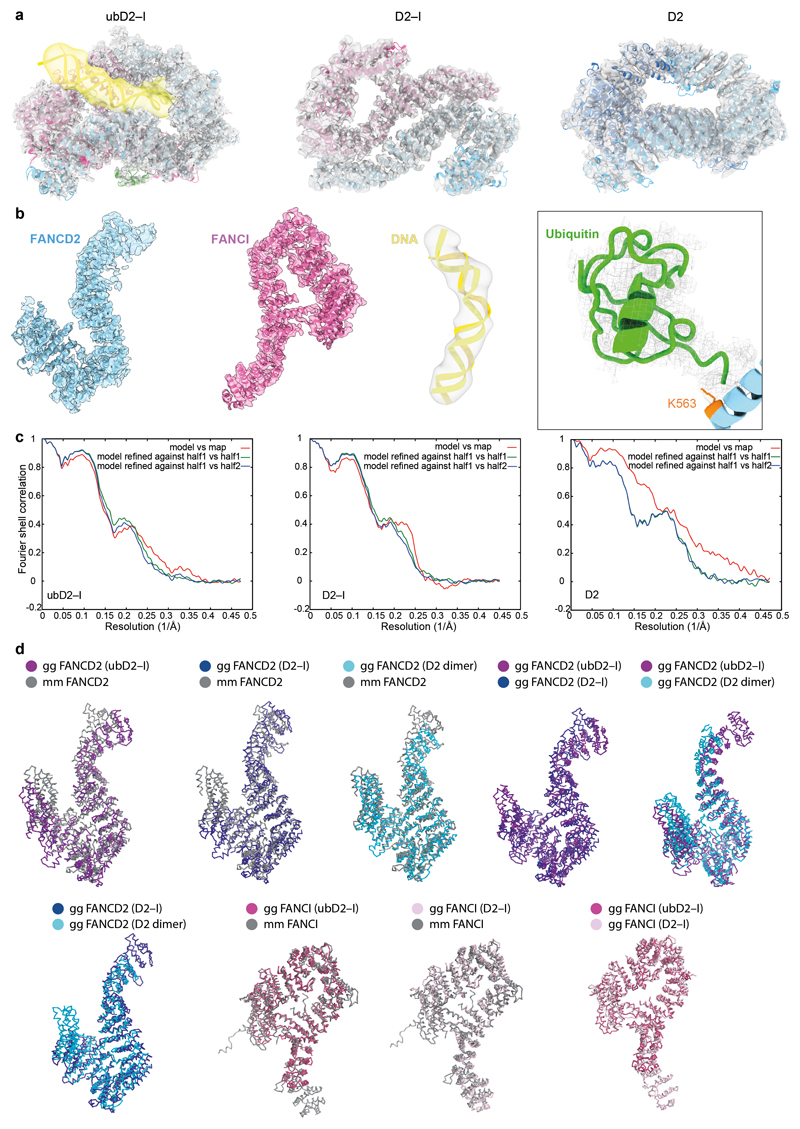
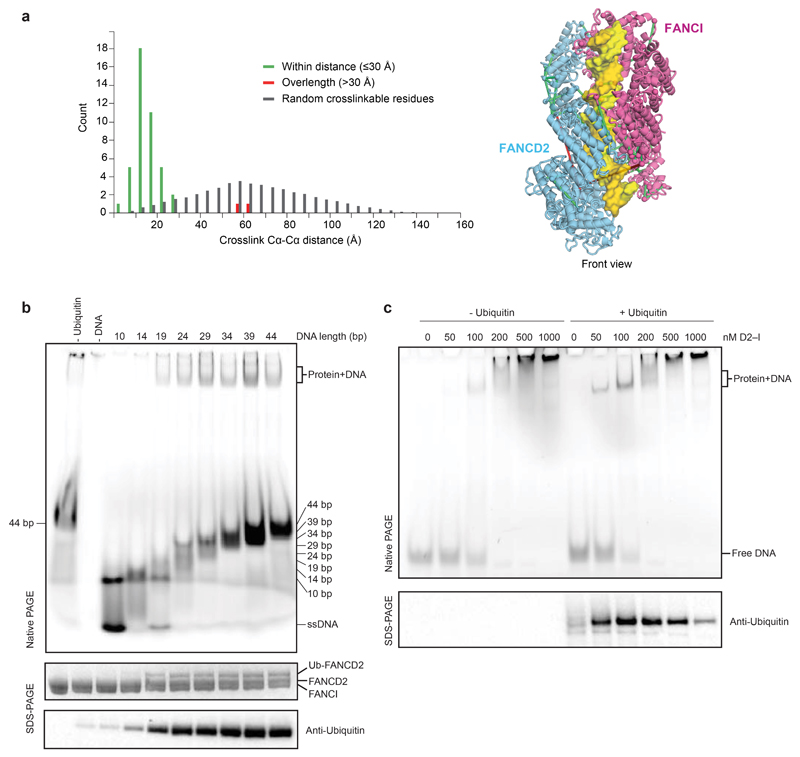
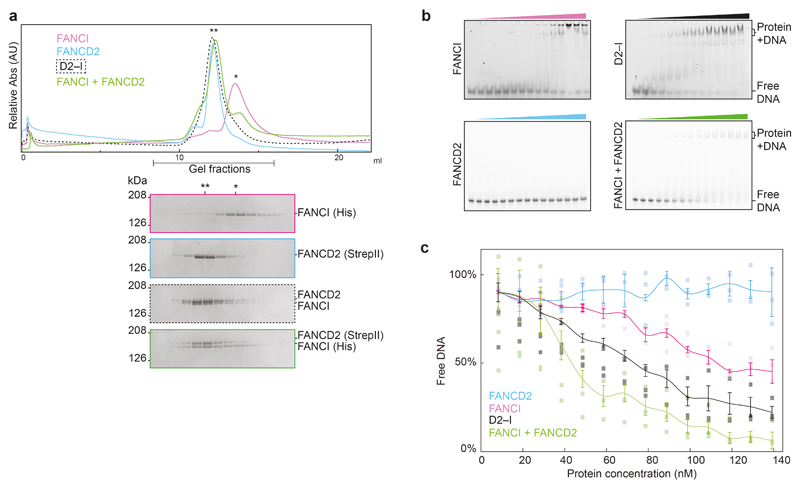
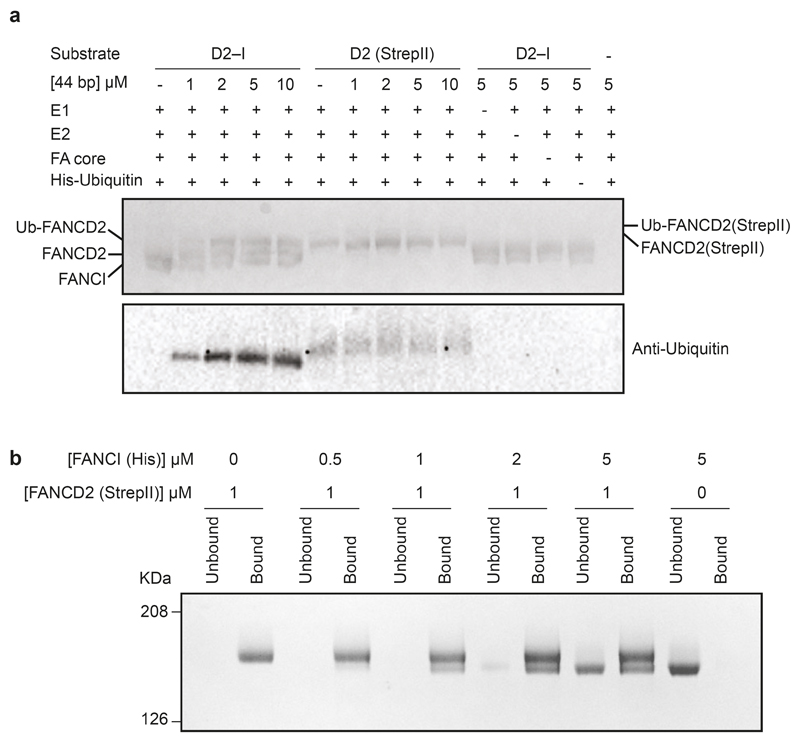
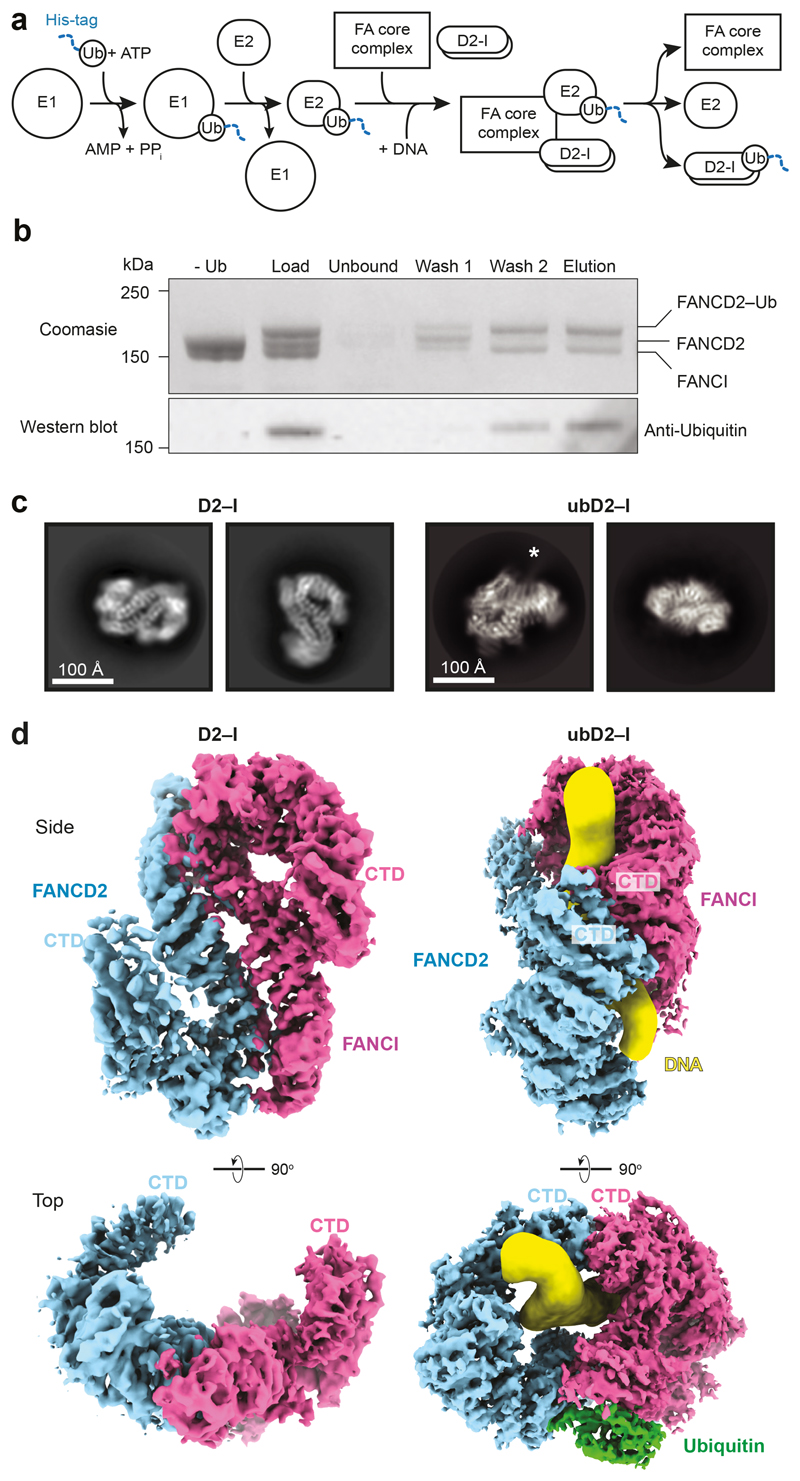
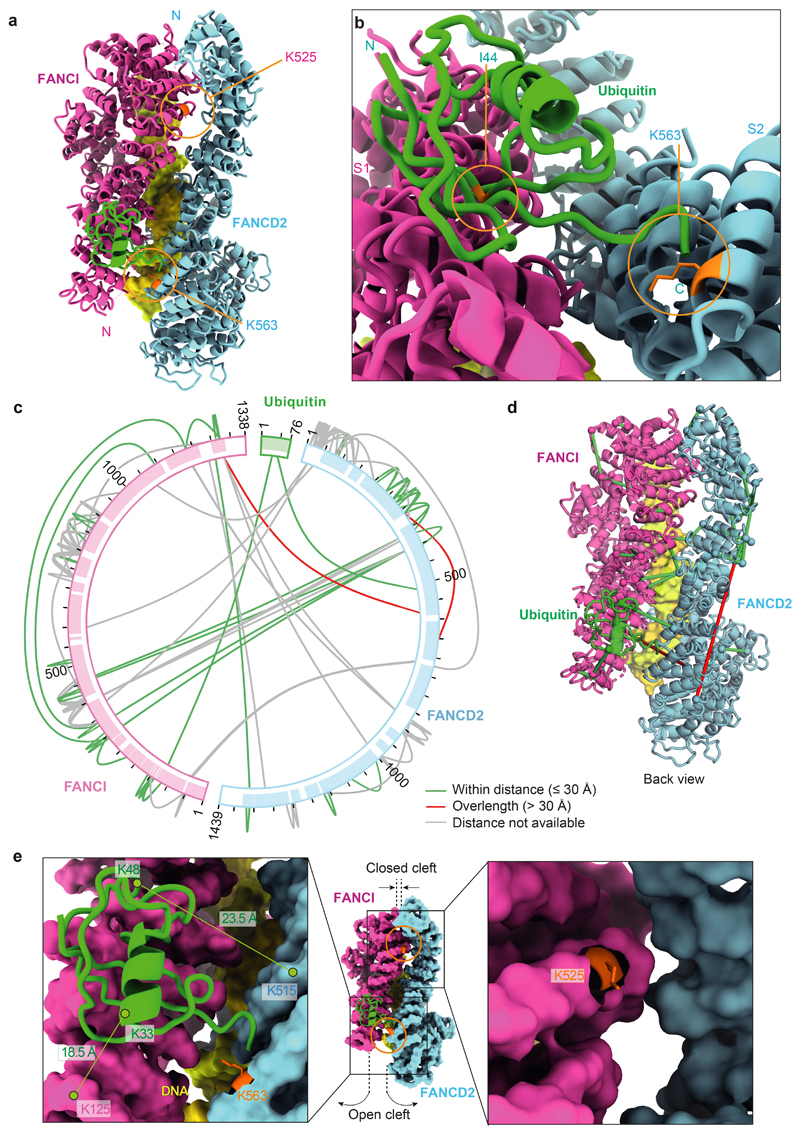
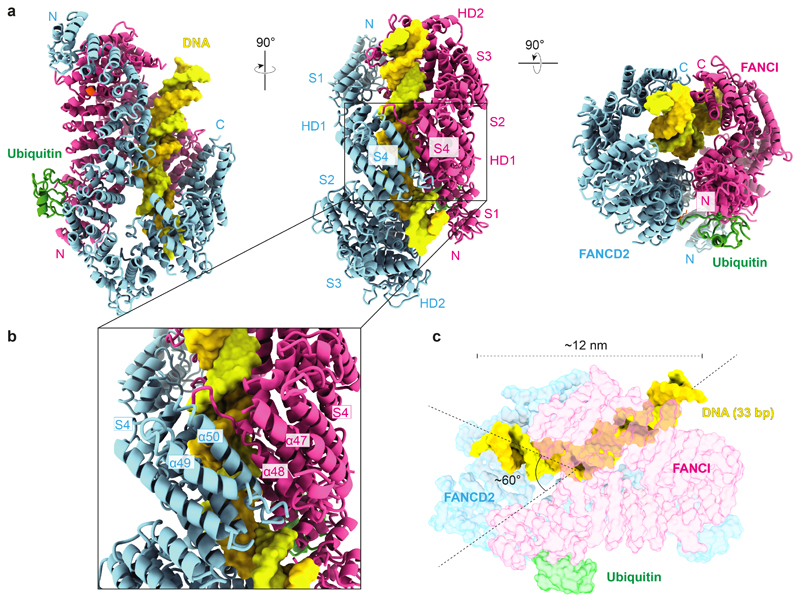
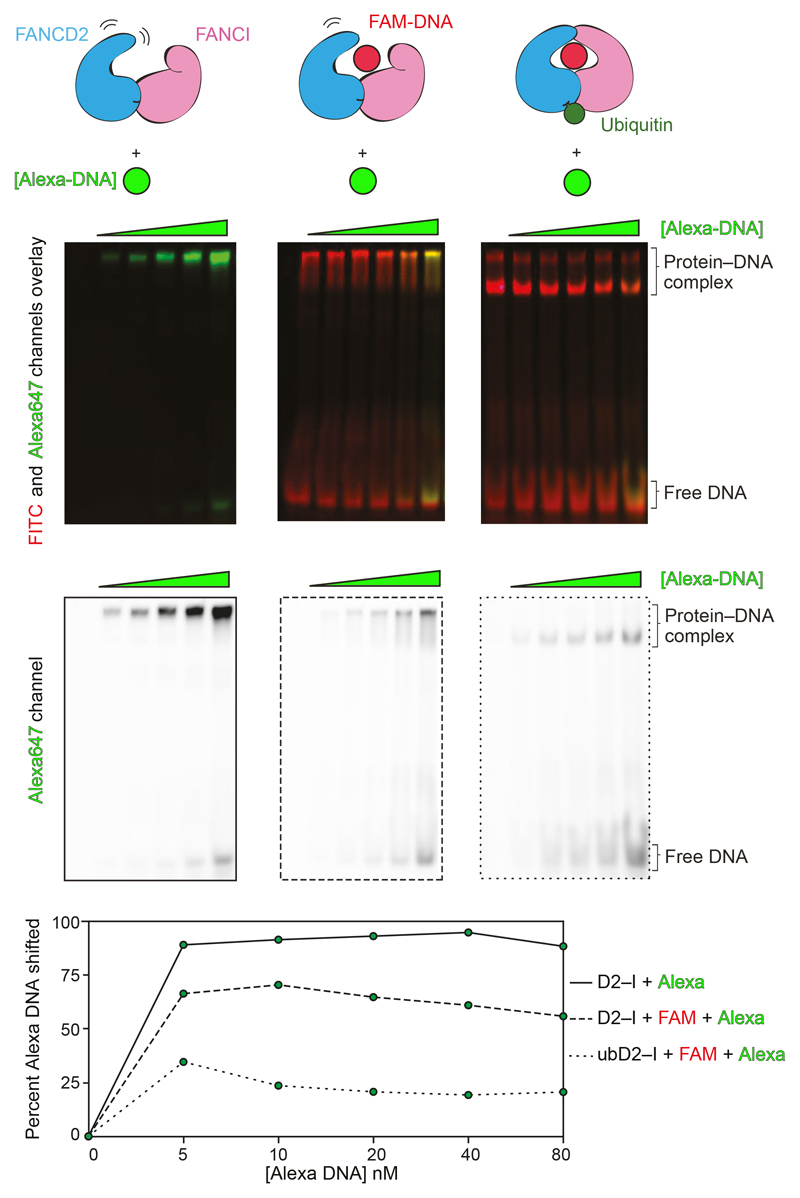
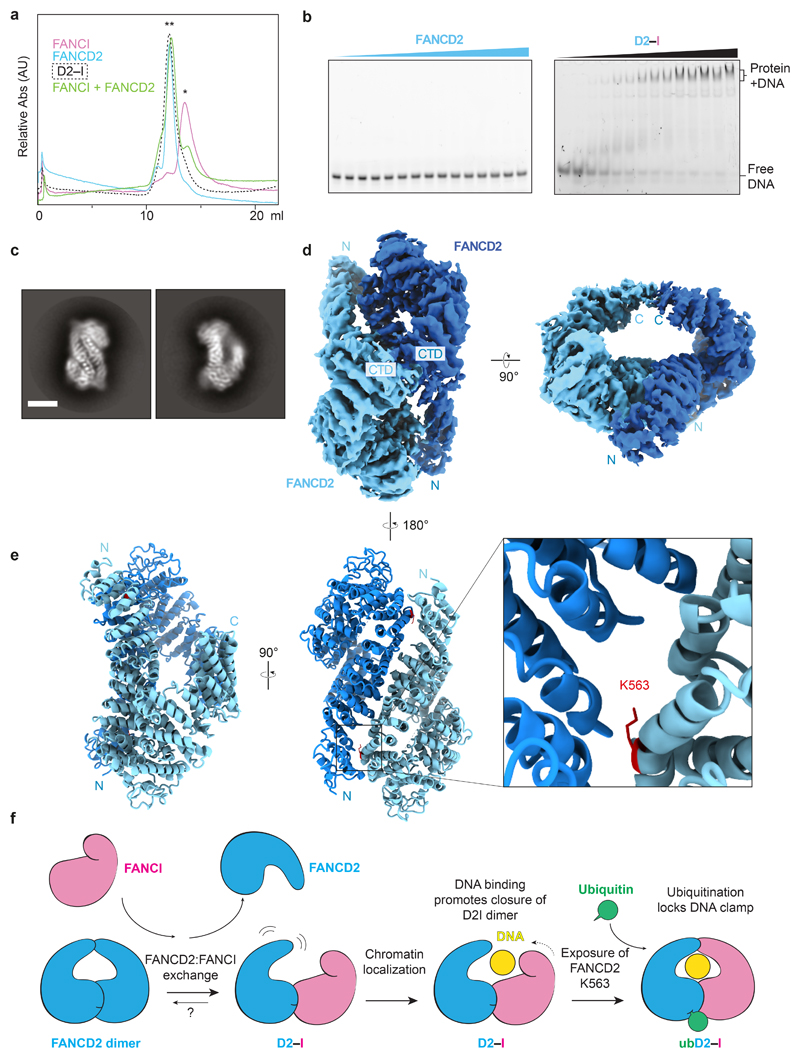
Vertebrate DNA crosslink repair excises toxic replication-blocking DNA crosslinks. Numerous factors involved in crosslink repair have been identified, and mutations in their corresponding genes cause Fanconi anemia (FA). A key step in crosslink repair is monoubiquitination of the FANCD2-FANCI heterodimer, which then recruits nucleases to remove the DNA lesion. Here, we use cryo-EM to determine the structures of recombinant chicken FANCD2 and FANCI complexes. FANCD2-FANCI adopts a closed conformation when the FANCD2 subunit is monoubiquitinated, creating a channel that encloses double-stranded DNA (dsDNA). Ubiquitin is positioned at the interface of FANCD2 and FANCI, where it acts as a covalent molecular pin to trap the complex on DNA. In contrast, isolated FANCD2 is a homodimer that is unable to bind DNA, suggestive of an autoinhibitory mechanism that prevents premature activation. Together, our work suggests that FANCD2-FANCI is a clamp that is locked onto DNA by ubiquitin, with distinct interfaces that may recruit other DNA repair factors.


Conflict of interest statement

Competing Interests: The authors declare no competing interests.

Figures

Extended Data Fig. 1
Extended Data Fig. 1. Purification of FANCI, FANCD2 and D2–I, and cryoEM of D2–I, ubD2–I and D2 dimer.
a Coomassie gel showing purified His-tagged FANCI, StrepII-tagged FANCD2 and D2–I after gel filtration. b–e CryoEM of D2–I, ubD2–I and D2. b Representative micrographs. Selected individual particles are marked with green circles. Scale bars are 25 nm. c Fourier shell correlation curves for gold-standard refinements. d Angular distribution density plots of particles used in 3D reconstructions calculated using cryoEF. Every point is a particle orientation and the color scale represents the normalized density of views around this point. The color scale runs from 0 (low, blue) to 0.00026 (high, red). All complexes had a preferred orientation. Note that C2 symmetry was applied for FANCD2. e Local resolution estimates calculated using ResMap. Uncropped image for panel a is available in Supplementary Fig. 1.
Extended Data Fig. 2
Extended Data Fig. 2. Model fitting.
a Overall fitting of model to map for ubD2–I, D2–I and D2 (FANCD2 is colored blue; FANCI magenta, ubiquitin green, and DNA yellow). b Representative fits of model to map for FANCD2, FANCI, DNA and ubiquitin in the ubD2–I structure. c FSC curves for model versus map. d FANCD2 and FANCI structures from Gallus gallus (gg) were aligned with each other and the with Mus musculus (mm) crystal structures using PDBeFOLD (http://www.ebi.ac.uk/msd-srv/ssm/) and figures were prepared with Pymol (The PyMOL Molecular Graphics System, Version 2.0, Schrödinger, LLC).
Extended Data Fig. 3
Extended Data Fig. 3. Crosslinking mass spectrometry and analysis of DNA binding by FANCD2 and FANCI.
a Distribution histogram of Cα-Cα distances between linked residue pairs in the 3D model of ubD2–I (left). Crosslinks with Cα-Cα distances below the theoretical crosslinking limit (30 Å) are shown in green. Overlength crosslinks (>30 Å) are shown in red. The distribution of Cα-Cα distances between random crosslinkable residue pairs in the 3D model is shown in grey. Crosslinks mapped onto the front view of the 3D structure are shown on the right. b Monoubiquitination assays were assembled in the presence of 5 μM linear double-stranded DNA of differing lengths (10–44 bp). DNA binding was analyzed by EMSA (top) after loading the reactions onto native gels and imaging of the fluorescently-labeled DNA. Monoubiquitination efficiency was analyzed by Coomassie blue (middle) and Western blotting the His-tagged ubiquitin (bottom). Controls lacking ubiquitin or DNA are indicated. These data are representative of experiments performed three times. c Monoubiquitination assays were assembled without (left) and with (right) ubiquitin, both in the presence of a 39 bp double-stranded DNA at 100 nM and increasing amounts of D2–I (0–1000 nM). Assays were analyzed by EMSA (top, imaging for the fluorescently-labeled DNA) or Western blotting His-tagged ubiquitin (bottom). We cannot exclude that other proteins may interact with DNA in these assays, but the migration positions of the shifted bands are similar to the experiment in Fig. 4 where ubD2–I was purified away from all other proteins. These data are representative of experiments performed three times. Uncropped images for panels b and c are available in Supplementary Fig. 1.
Extended Data Fig. 4
Extended Data Fig. 4. FANCD2 and FANCI oligomerization state and DNA binding activity.
a Size-exclusion chromatogram as shown in Fig. 5a (top). Peak fractions were analyzed by SDS-PAGE (bottom). A single asterisk (*) indicates the migration position for monomers. A double asterisk (**) indicates the migration position for dimers. These results are representative of experiments performed three times. b DNA binding of FANCI, FANCD2, D2–I, and FANCI mixed with FANCD2 was analyzed by EMSAs performed with 20 nM 39-bp double-stranded DNA and 0–140 nM protein. Representative gels of experiments performed independently three times. The FANCD2 and D2–I gels are same as in Fig 5b. c Quantification of mean intensities of free DNA from panel b. Error bars represent the standard deviation. Individual data points (n=3 independent experiments) are shown. The means are connected by lines for clarity. Uncropped images for panels a and b are available in Supplementary Fig. 1. Data for the plot in c are available as source data.
Extended Data Fig. 5
Extended Data Fig. 5. FANCD2 dimers cannot be ubiquitinated and exchange with FANCI to form a D2–I heterodimer.
a Monoubiquitination assays of D2–I and FANCD2 homodimer. The FANCD2 homodimer had a StrepII-tag and was therefore larger than D2 in the D2–I complex. Monoubiquitination efficiency was analyzed by Coomassie blue SDS-PAGE (top) and Western blotting the His-tagged ubiquitin (bottom). b Exchange assay. The FANCD2 homodimer was immobilized on Streptactin resin and incubated with free FANCI. The resin was washed, then bound and unbound fractions were analyzed by SDS-PAGE. These data are representative of experiments performed twice. Uncropped images are available in Supplementary Fig. 1.
Fig. 1
Fig. 1. Purification and structures of D2–I and ubD2–I.
a Scheme for monoubiquitination of D2–I using fully recombinant components. The His-tag on ubiquitin is shown as a blue dashed line. b ubD2–I was enriched from the monoubiquitination mixture by purification of His-tagged ubiquitin on Ni-NTA. The load, unbound fraction, two wash fractions and elution were analyzed by Coomassie-stained SDS-PAGE (top) and Western blotting with an anti-Ubiquitin antibody (bottom). A control reaction lacking ubiquitin is also shown. Uncropped gel and blot are available in Supplementary Fig. 1. These results are representative of experiments performed three times. c Selected 2D reference-free class averages of D2–I (left) and ubD2–I (right). Both samples were prepared with DNA. An asterisk marks density extending from the side of the ubD2–I complex that we assign to DNA. d CryoEM maps of D2–I (left) and ubD2–I (right), segmented into FANCD2 (blue), FANCI (magenta), ubiquitin (green) and DNA (yellow).
Fig. 2
Fig. 2. Ubiquitin is anchored to K563 on FANCD2 but also contacts FANCI.
a The ubiquitin moiety attached to FANCD2 makes extensive contacts with FANCI. b Close-up view of the monoubiquitination site. Ile44 (orange) of ubiquitin is shown. c Map of crosslinks identified in the ubD2–I complex. Crosslinking mass spectrometry revealed 122 crosslinks (1% false discovery rate) between residues that are in close proximity. Crosslinks are colored by Cα-Cα distance between linked residue pairs measured in the 3D model of ubD2–I. Two crosslinks are not compatible with the model but are consistent with the flexibility observed within this complex (Supplementary Video 1). Proteins are shown as curved bars and residues that are present in the 3D model are highlighted. d Crosslinks within expected distance (green) and exceeding expected distance (overlength, red) mapped onto the ubD2–I structure. e Details of lysines K563 in FANCD2 (left) and K525 in FANCI (right) within the ubD2–I structure, shown in sticks for lysines (orange), as a surface representation of the model for FANCD2 (blue) and FANCI (magenta), and in cartoon for ubiquitin (green). The residues crosslinked between ubiquitin and FANCD2 and FANCI are labeled.
Fig. 3
Fig. 3. ubD2–I is a DNA clamp.
a Models for FANCD2 (blue), FANCI (magenta) and ubiquitin (green) built into the ubD2–I cryoEM map. The N- and C-termini, solenoids 1–4 (S1–S4) and helical domains (HD1, HD2) of FANCD2 and FANCI are indicated. The monoubiquitinated lysine in FANCD2 and the lysine that can be monoubiquitinated in FANCI are shown in orange. b Close-up view of the C-terminal domains (S4) of ubD2–I that clamp around DNA. c Model of 33 bp double-stranded DNA (yellow) in the ubD2–I map. DNA is kinked within the ubD2–I complex.
Fig. 4
Fig. 4. Monoubiquitination locks the D2–I clamp onto DNA.
A 44-bp FAM-labeled dsDNA (red) was incubated with D2–I (30 nM) or used to form ubD2–I complex (30 nM). Then, an Alexa-labeled DNA (green) of the same length and sequence was added in increasing concentrations (0–80 nM) to these complexes. Overlays of the FITC and Alexa647 channels (top) and the Alexa647 channel alone (middle) are shown.. The intensities of total Alexa-DNA and the fraction incorporated into the complex (shifted) were quantified and the percentage of shifted Alexa-DNA was plotted in the bottom panel. These data are representative of experiments performed twice. Uncropped gels are available in Supplementary Fig. 1. Data for plot is available as source data.
Fig. 5
Fig. 5. FANCI forms a monomer and binds DNA whereas FANCD2 is dimeric and does not bind DNA.
a Size exclusion chromatography analysis of purified FANCI, FANCD2, D2–I, and FANCI mixed with FANCD2. A single asterisk (*) indicates the migration position for monomers. A double asterisk (**) indicates the migration position for dimers. This experiment was performed three times and a representative chromatogram is shown. b DNA binding of FANCD2 and D2–I was analyzed by EMSAs performed with 20 nM 39 bp double-stranded DNA and 0–140 nM protein. Representative gels of experiments independently performed three times are shown. Uncropped gels are available in Supplementary Fig. 1. c Selected 2D reference-free class averages of FANCD2. Scale bar is 100 Å. d CryoEM map of FANCD2 homodimer. The locations of the N- and C-termini are marked. e Model of FANCD2 dimer. The buried K563 residue (red) on FANCD2 is shown in close-up. f Model for regulation of FANCD2 and FANCI in DNA crosslink repair. Isolated FANCD2 purifies as a homodimer that is closed, does not bind DNA, and is not monoubiquitinated. Upon incubation with purified (monomeric) FANCI, this exchanges into a D2–I complex with an open conformation. D2–I binds and encircles DNA, converting the complex into a closed conformation, and thereby acting as a DNA clamp. The ubiquitination site on FANCD2 is exposed in the closed conformation, allowing access to the FA core complex and E2 enzyme. Ubiquitin locks the D2–I clamp in a closed conformation so it is not readily released from DNA.

Comment in

References

    1. Kottemann MC, Smogorzewska A. Fanconi anaemia and the repair of Watson and Crick DNA crosslinks. Nature. 2013;493:356–363. doi: 10.1038/nature11863. - DOI - PMC - PubMed
    1. Crossan GP, Patel KJ. The Fanconi anaemia pathway orchestrates incisions at sites of crosslinked DNA. J Pathol. 2012;226:326–337. doi: 10.1002/path.3002. - DOI - PubMed
    1. Walden H, Deans AJ. The Fanconi anemia DNA repair pathway: structural and functional insights into a complex disorder. Annu Rev Biophys. 2014;43:257–278. doi: 10.1146/annurev-biophys-051013-022737. - DOI - PubMed
    1. Knipscheer P, Raschle M, Scharer OD, Walter JC. Replication-coupled DNA interstrand cross-link repair in Xenopus egg extracts. Methods Mol Biol. 2012;920:221–243. doi: 10.1007/978-1-61779-998-3_16. - DOI - PMC - PubMed
    1. Alpi A, et al. UBE2T, the Fanconi anemia core complex, and FANCD2 are recruited independently to chromatin: a basis for the regulation of FANCD2 monoubiquitination. Mol Cell Biol. 2007;27:8421–8430. doi: 10.1128/MCB.00504-07. - DOI - PMC - PubMed

Publication types

MeSH terms

Substances