. 2020 Mar;23(3):327-336.
doi: 10.1038/s41593-020-0589-7. Epub 2020 Feb 17.

Gut-seeded α-synuclein fibrils promote gut dysfunction and brain pathology specifically in aged mice

Affiliations

Gut-seeded α-synuclein fibrils promote gut dysfunction and brain pathology specifically in aged mice

Collin Challis et al. Nat Neurosci. 2020 Mar.

Abstract

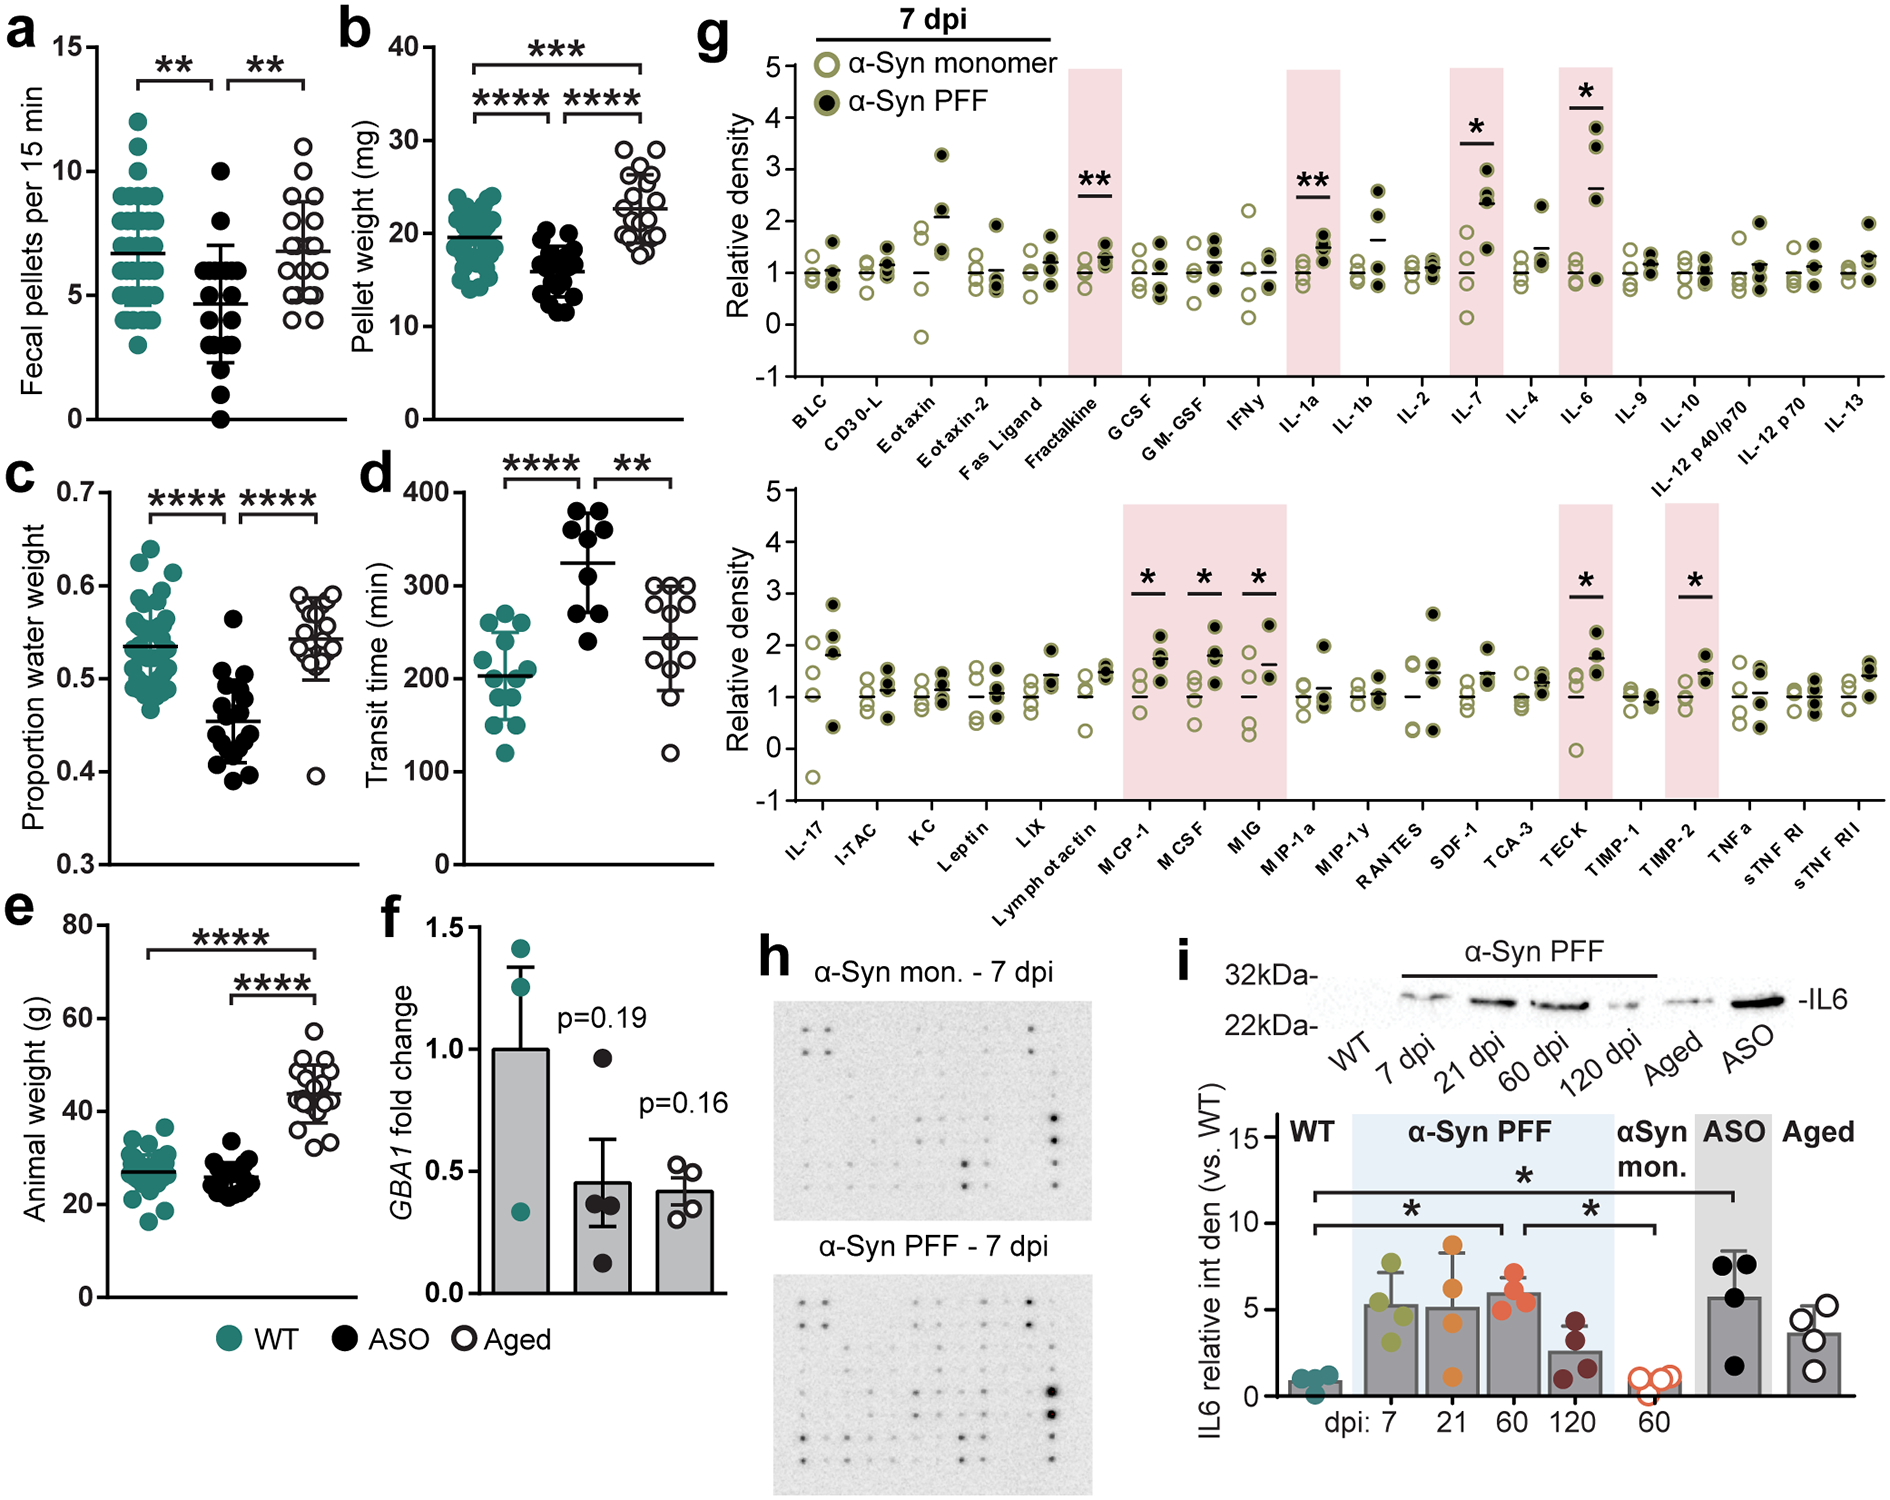
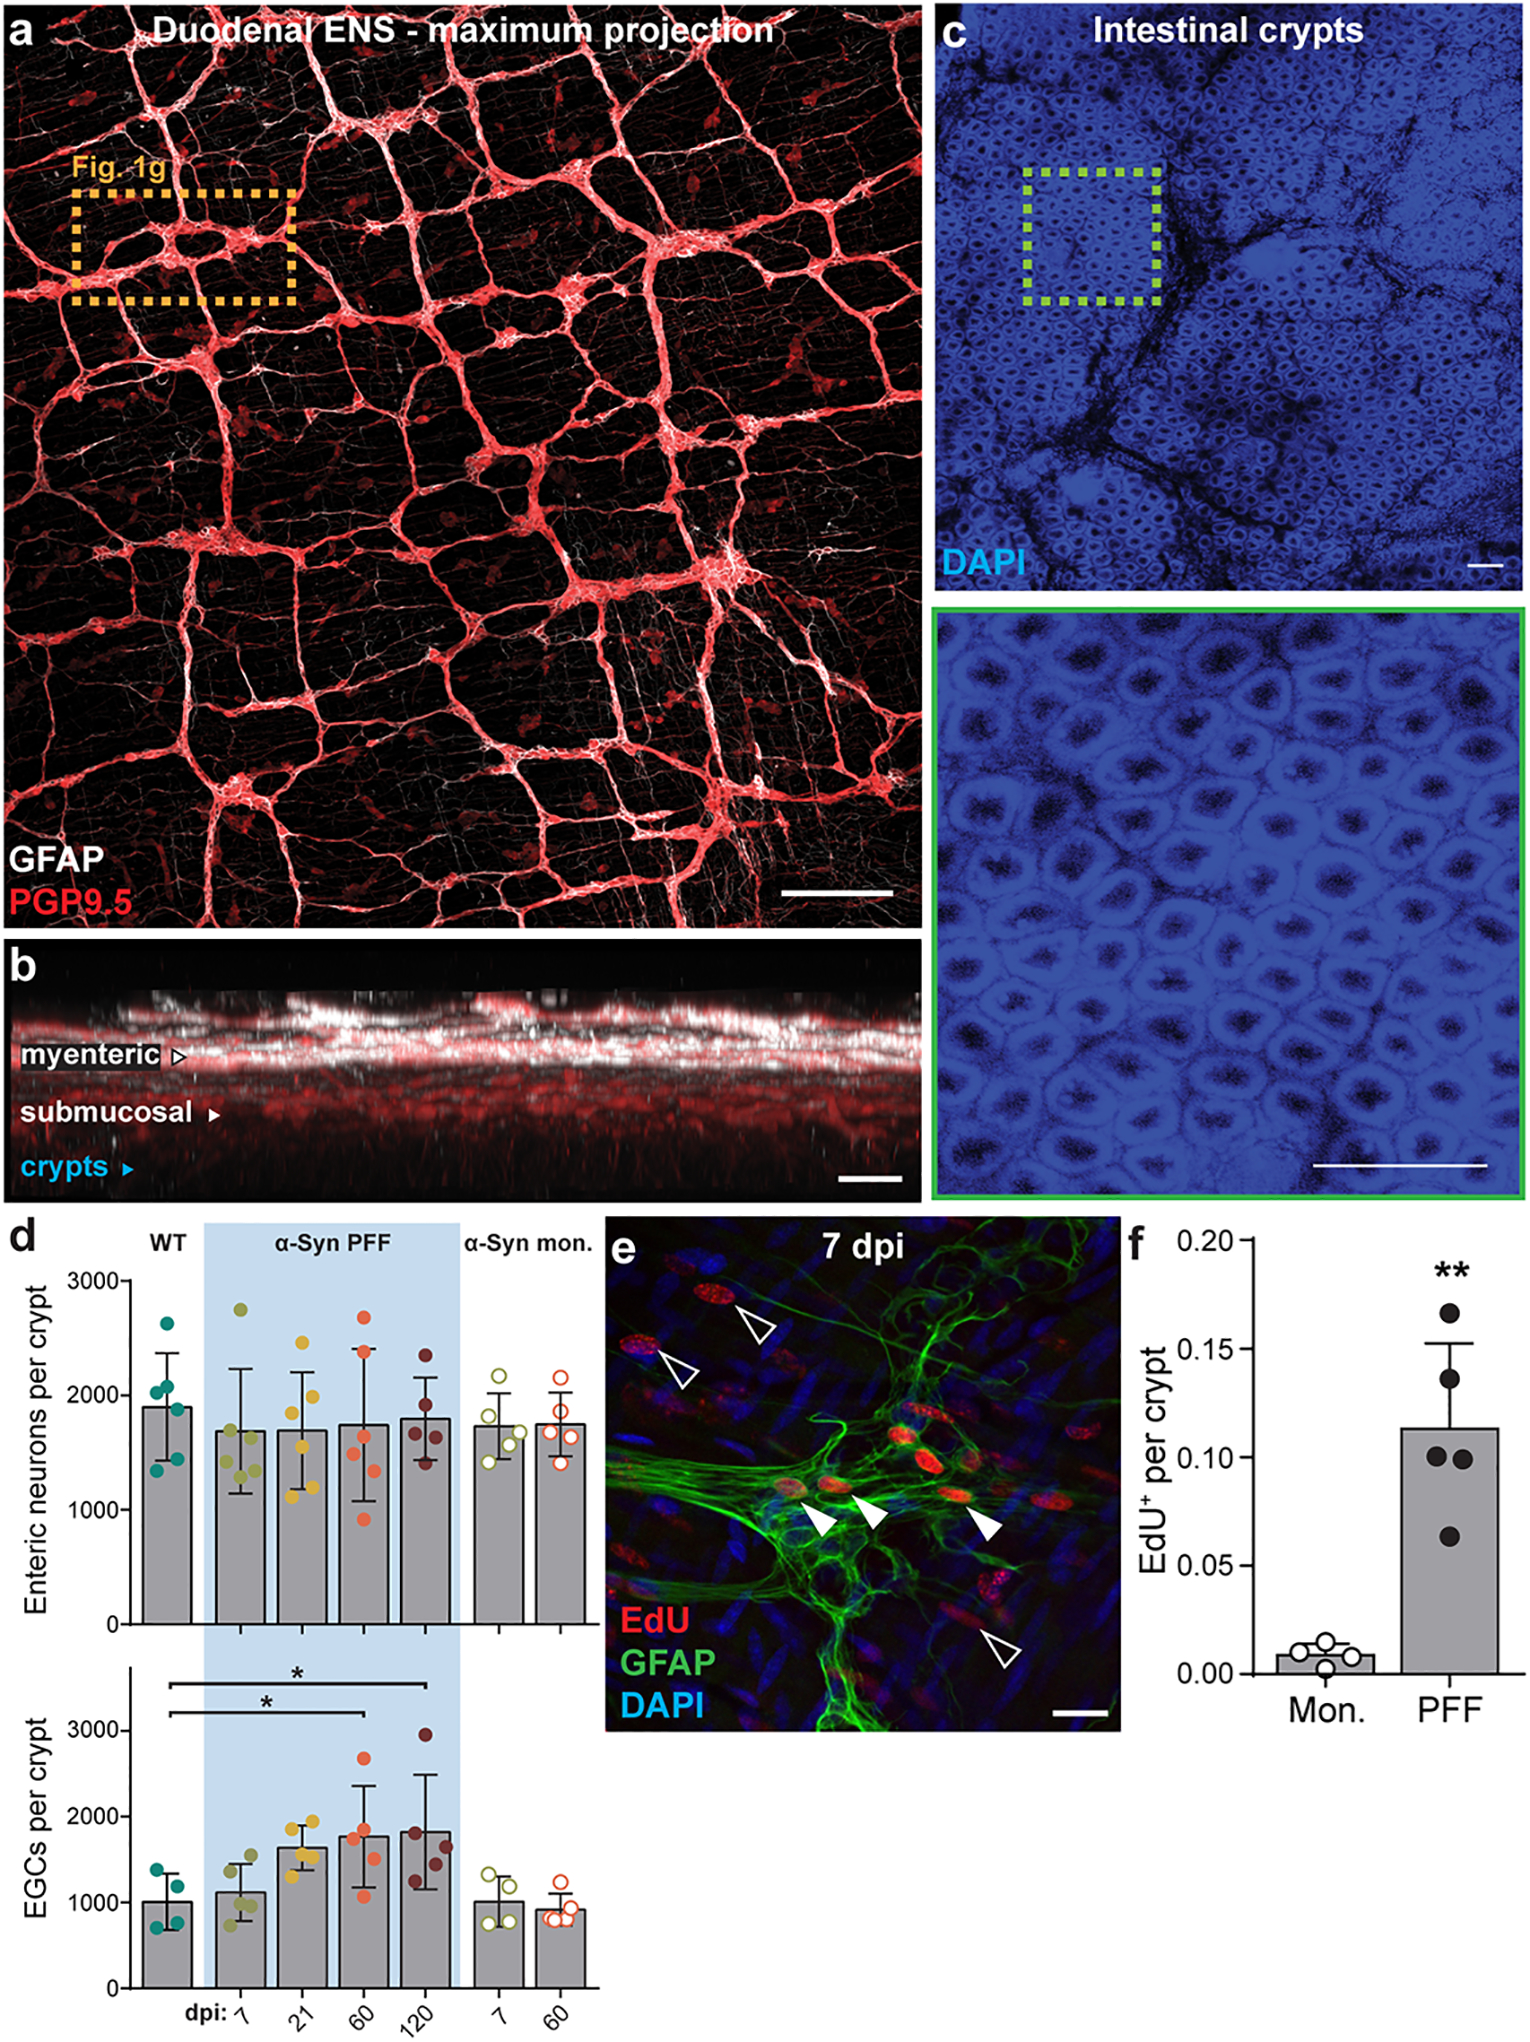
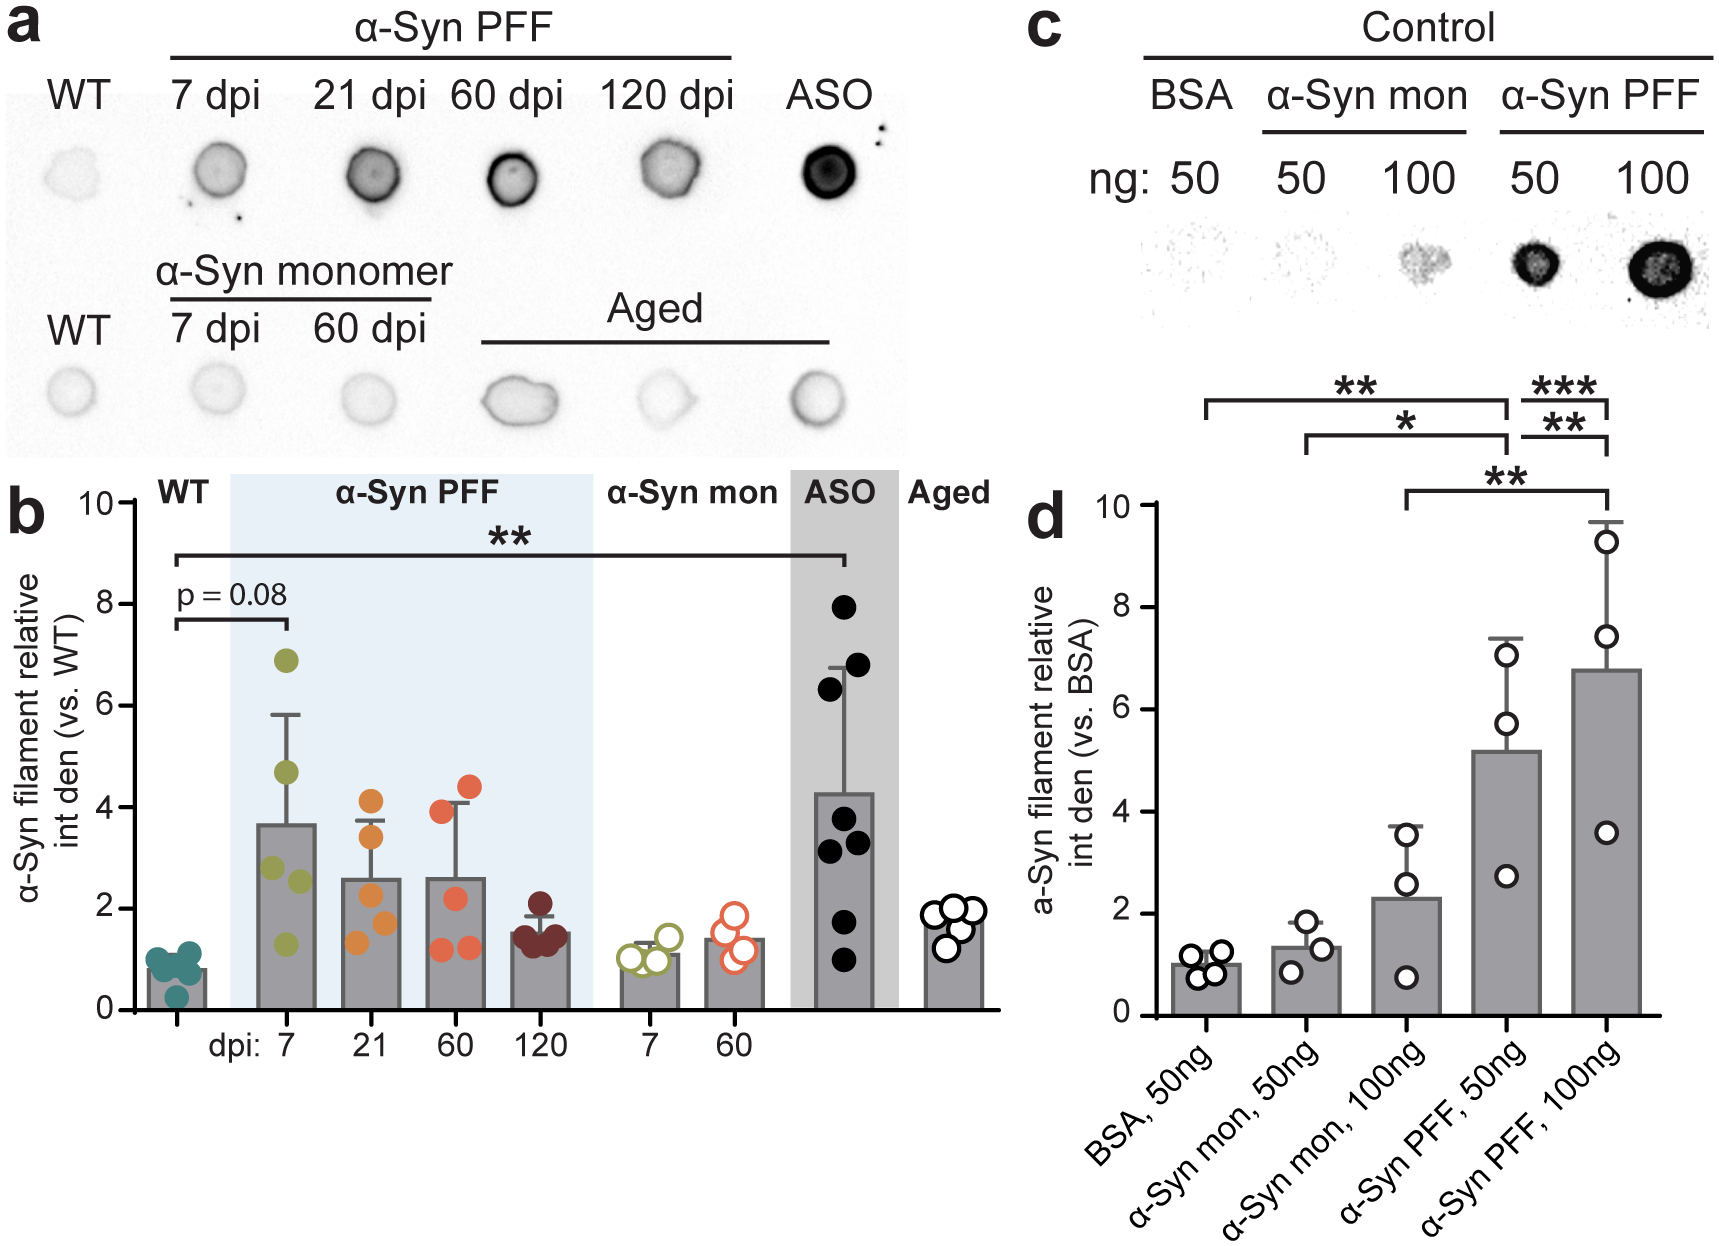
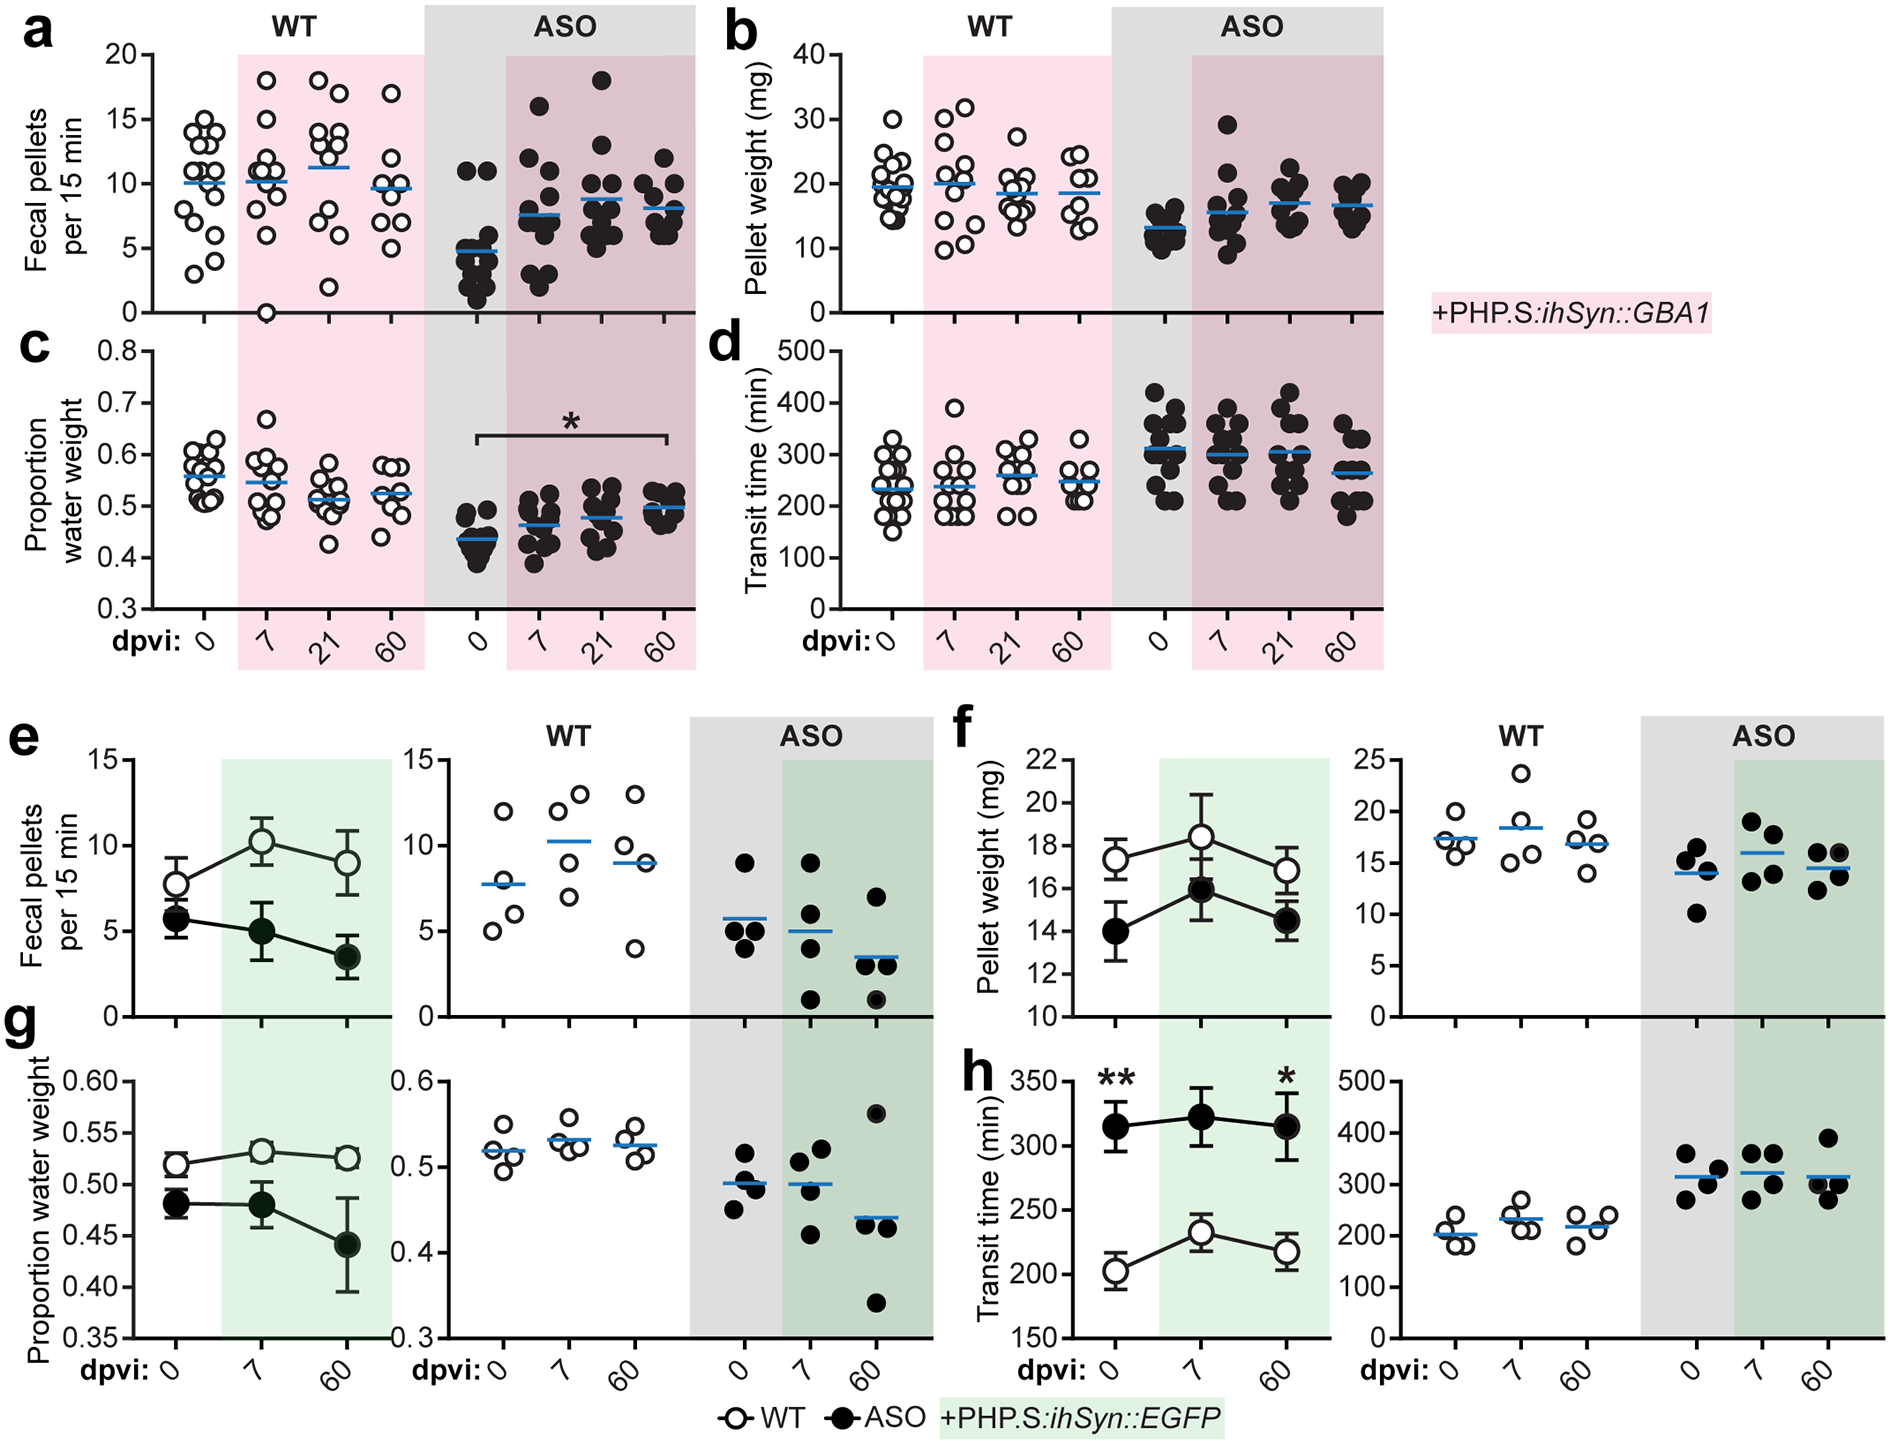
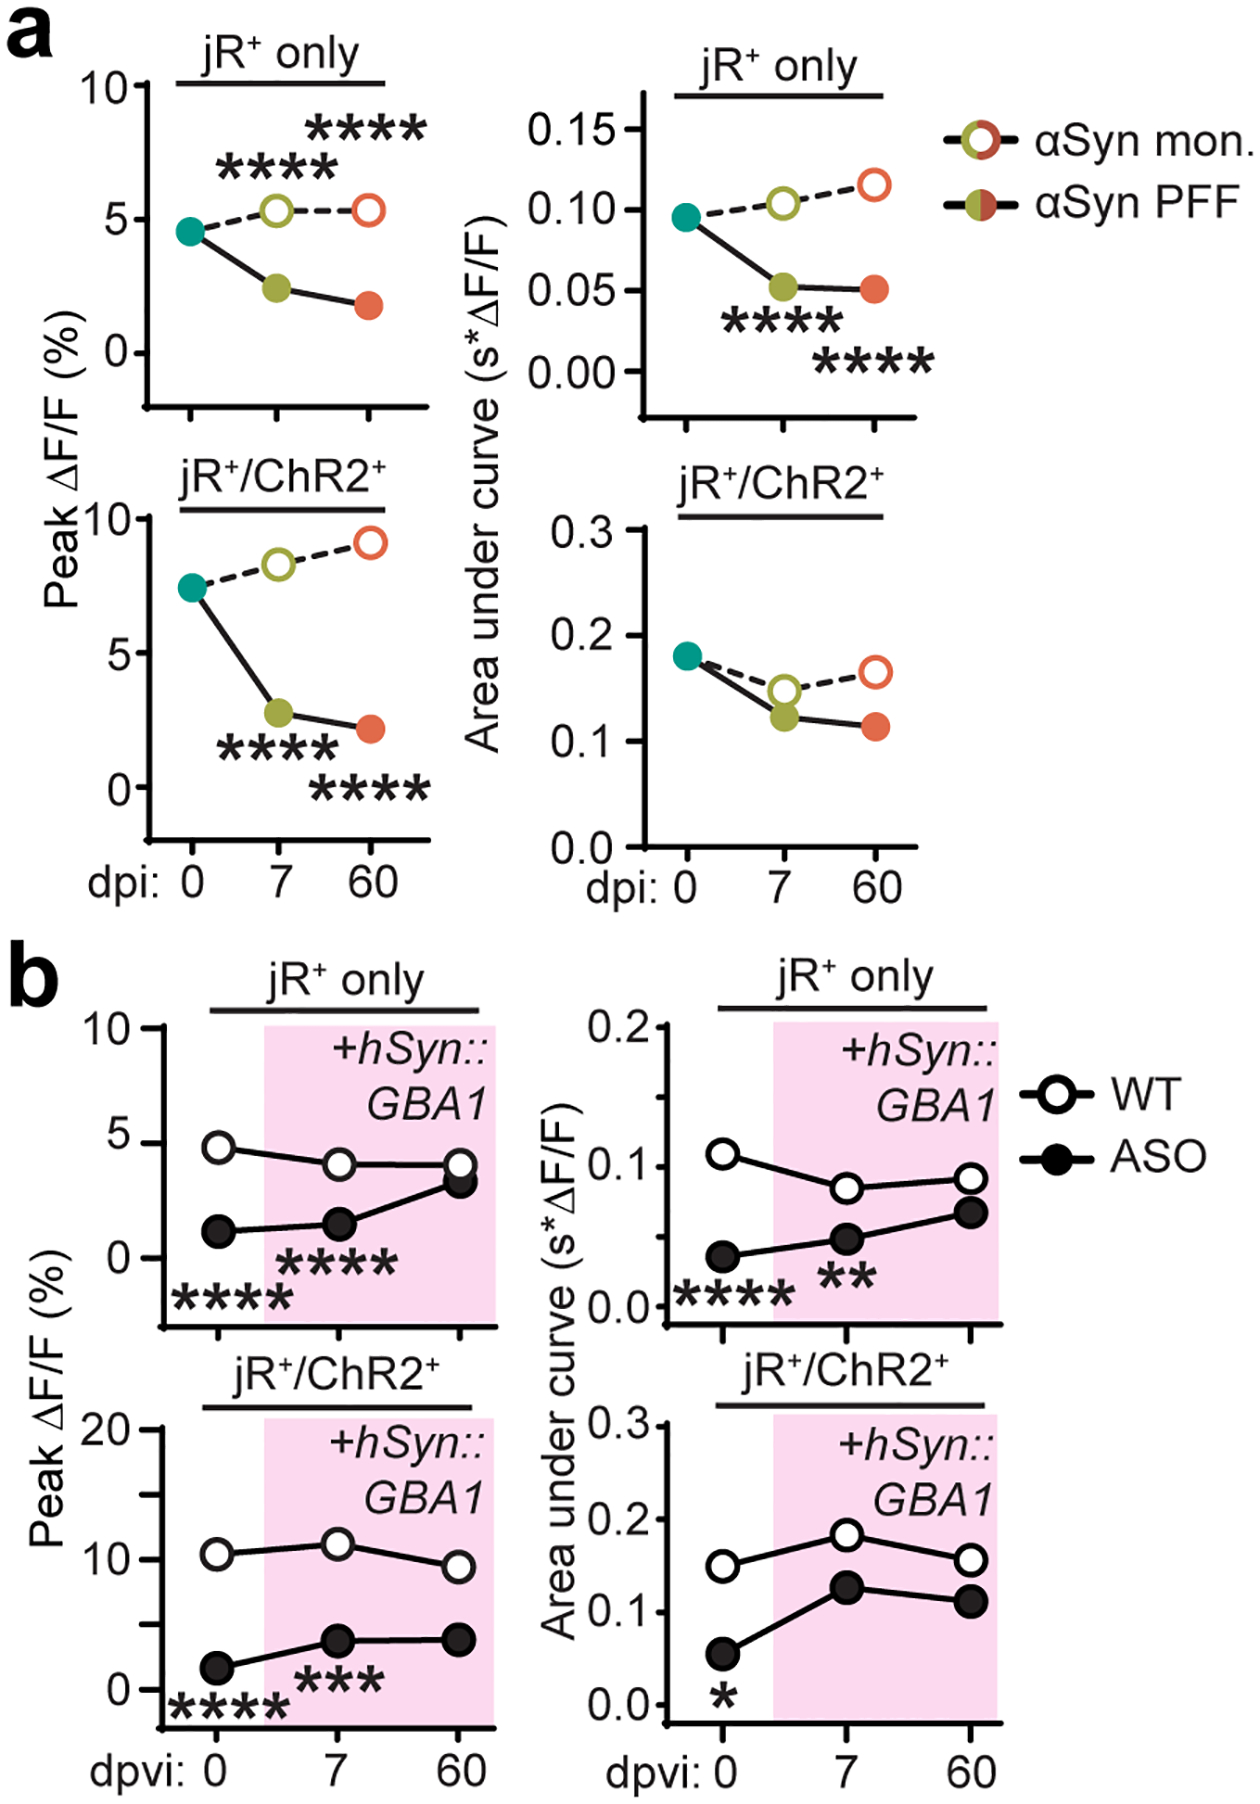
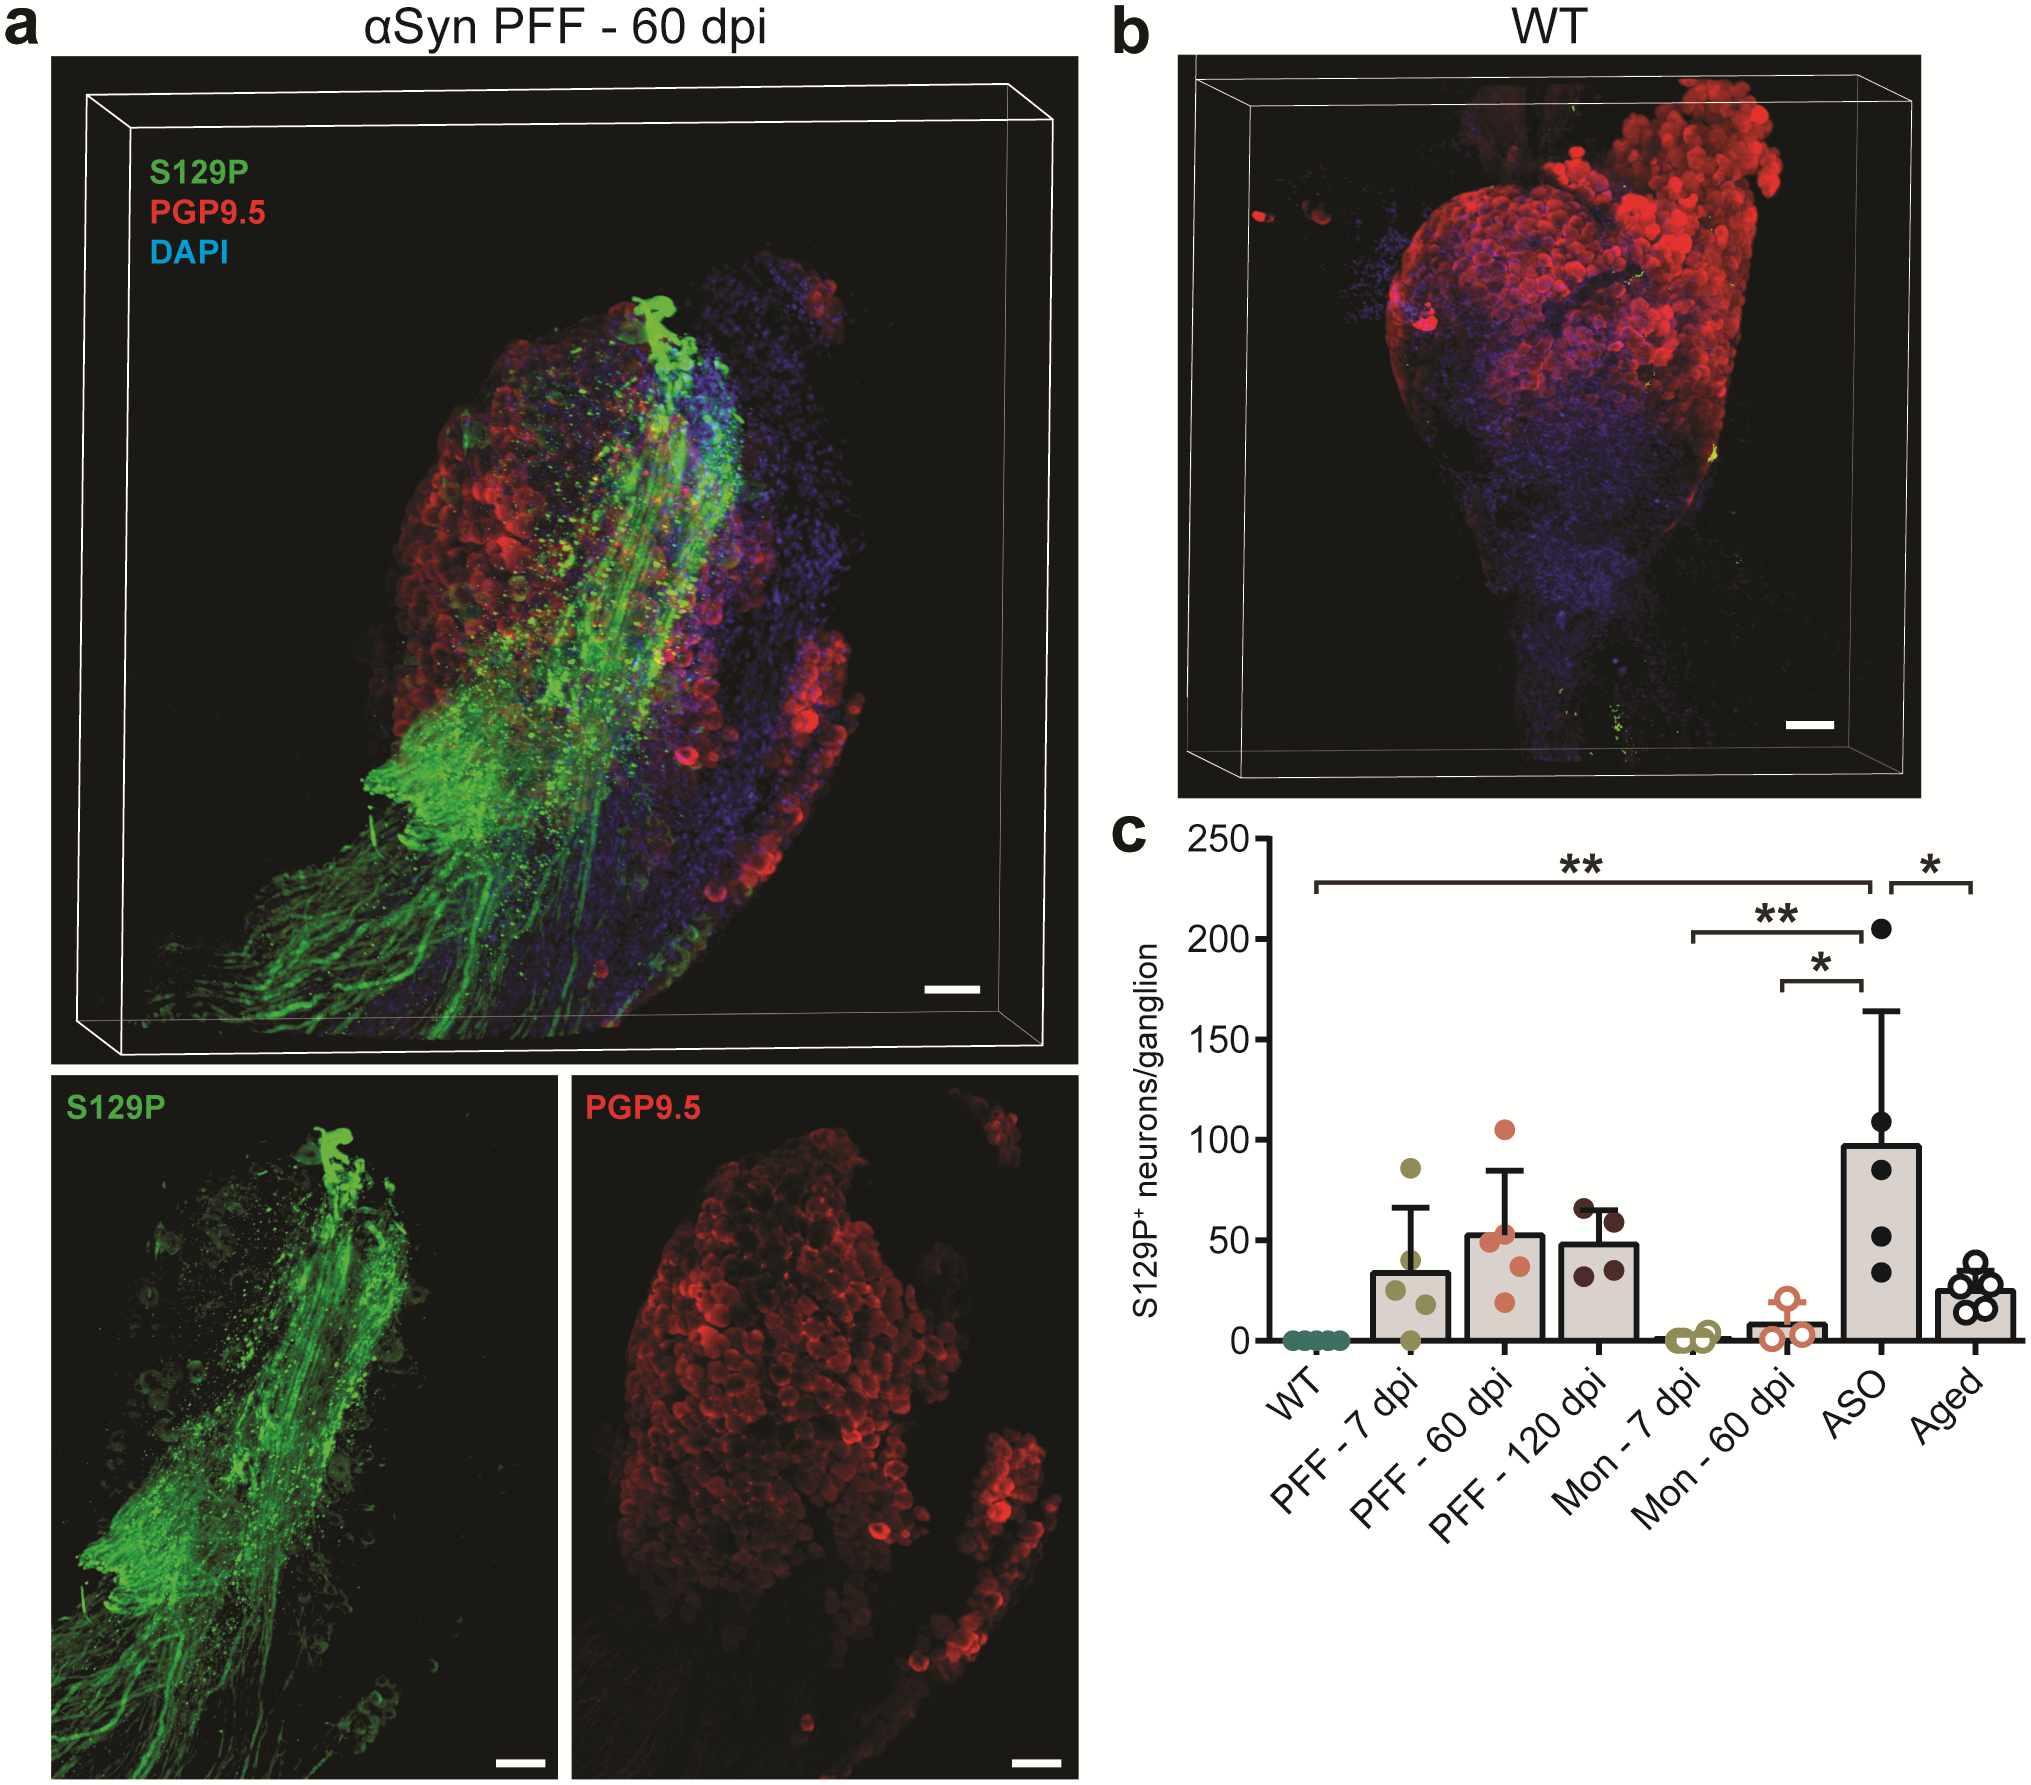
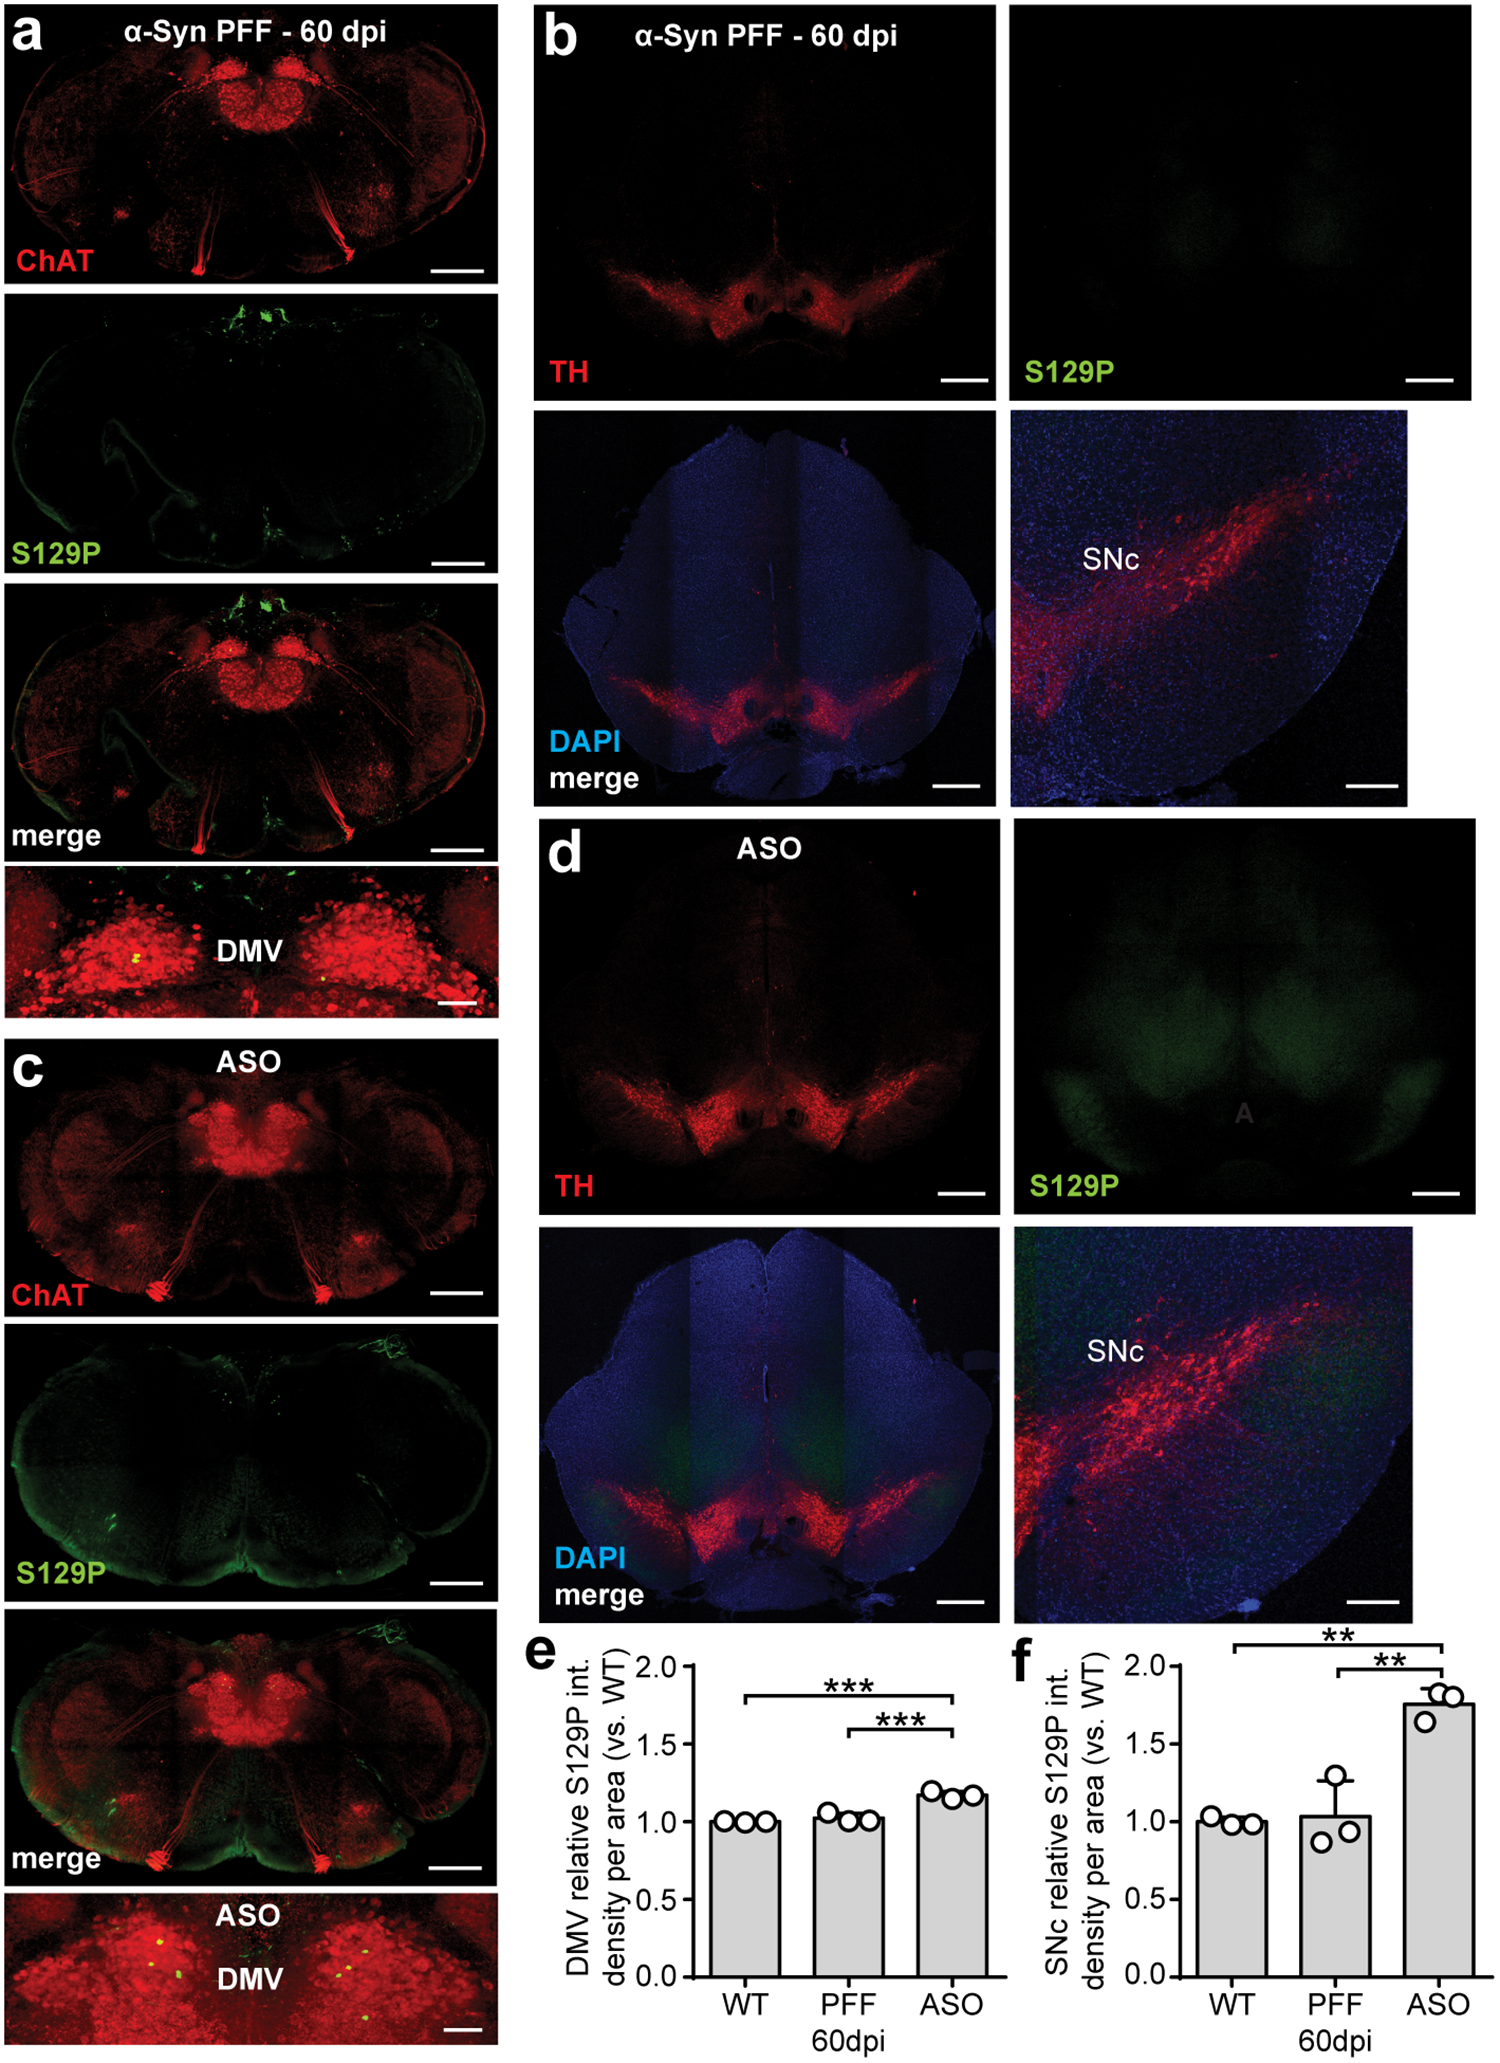
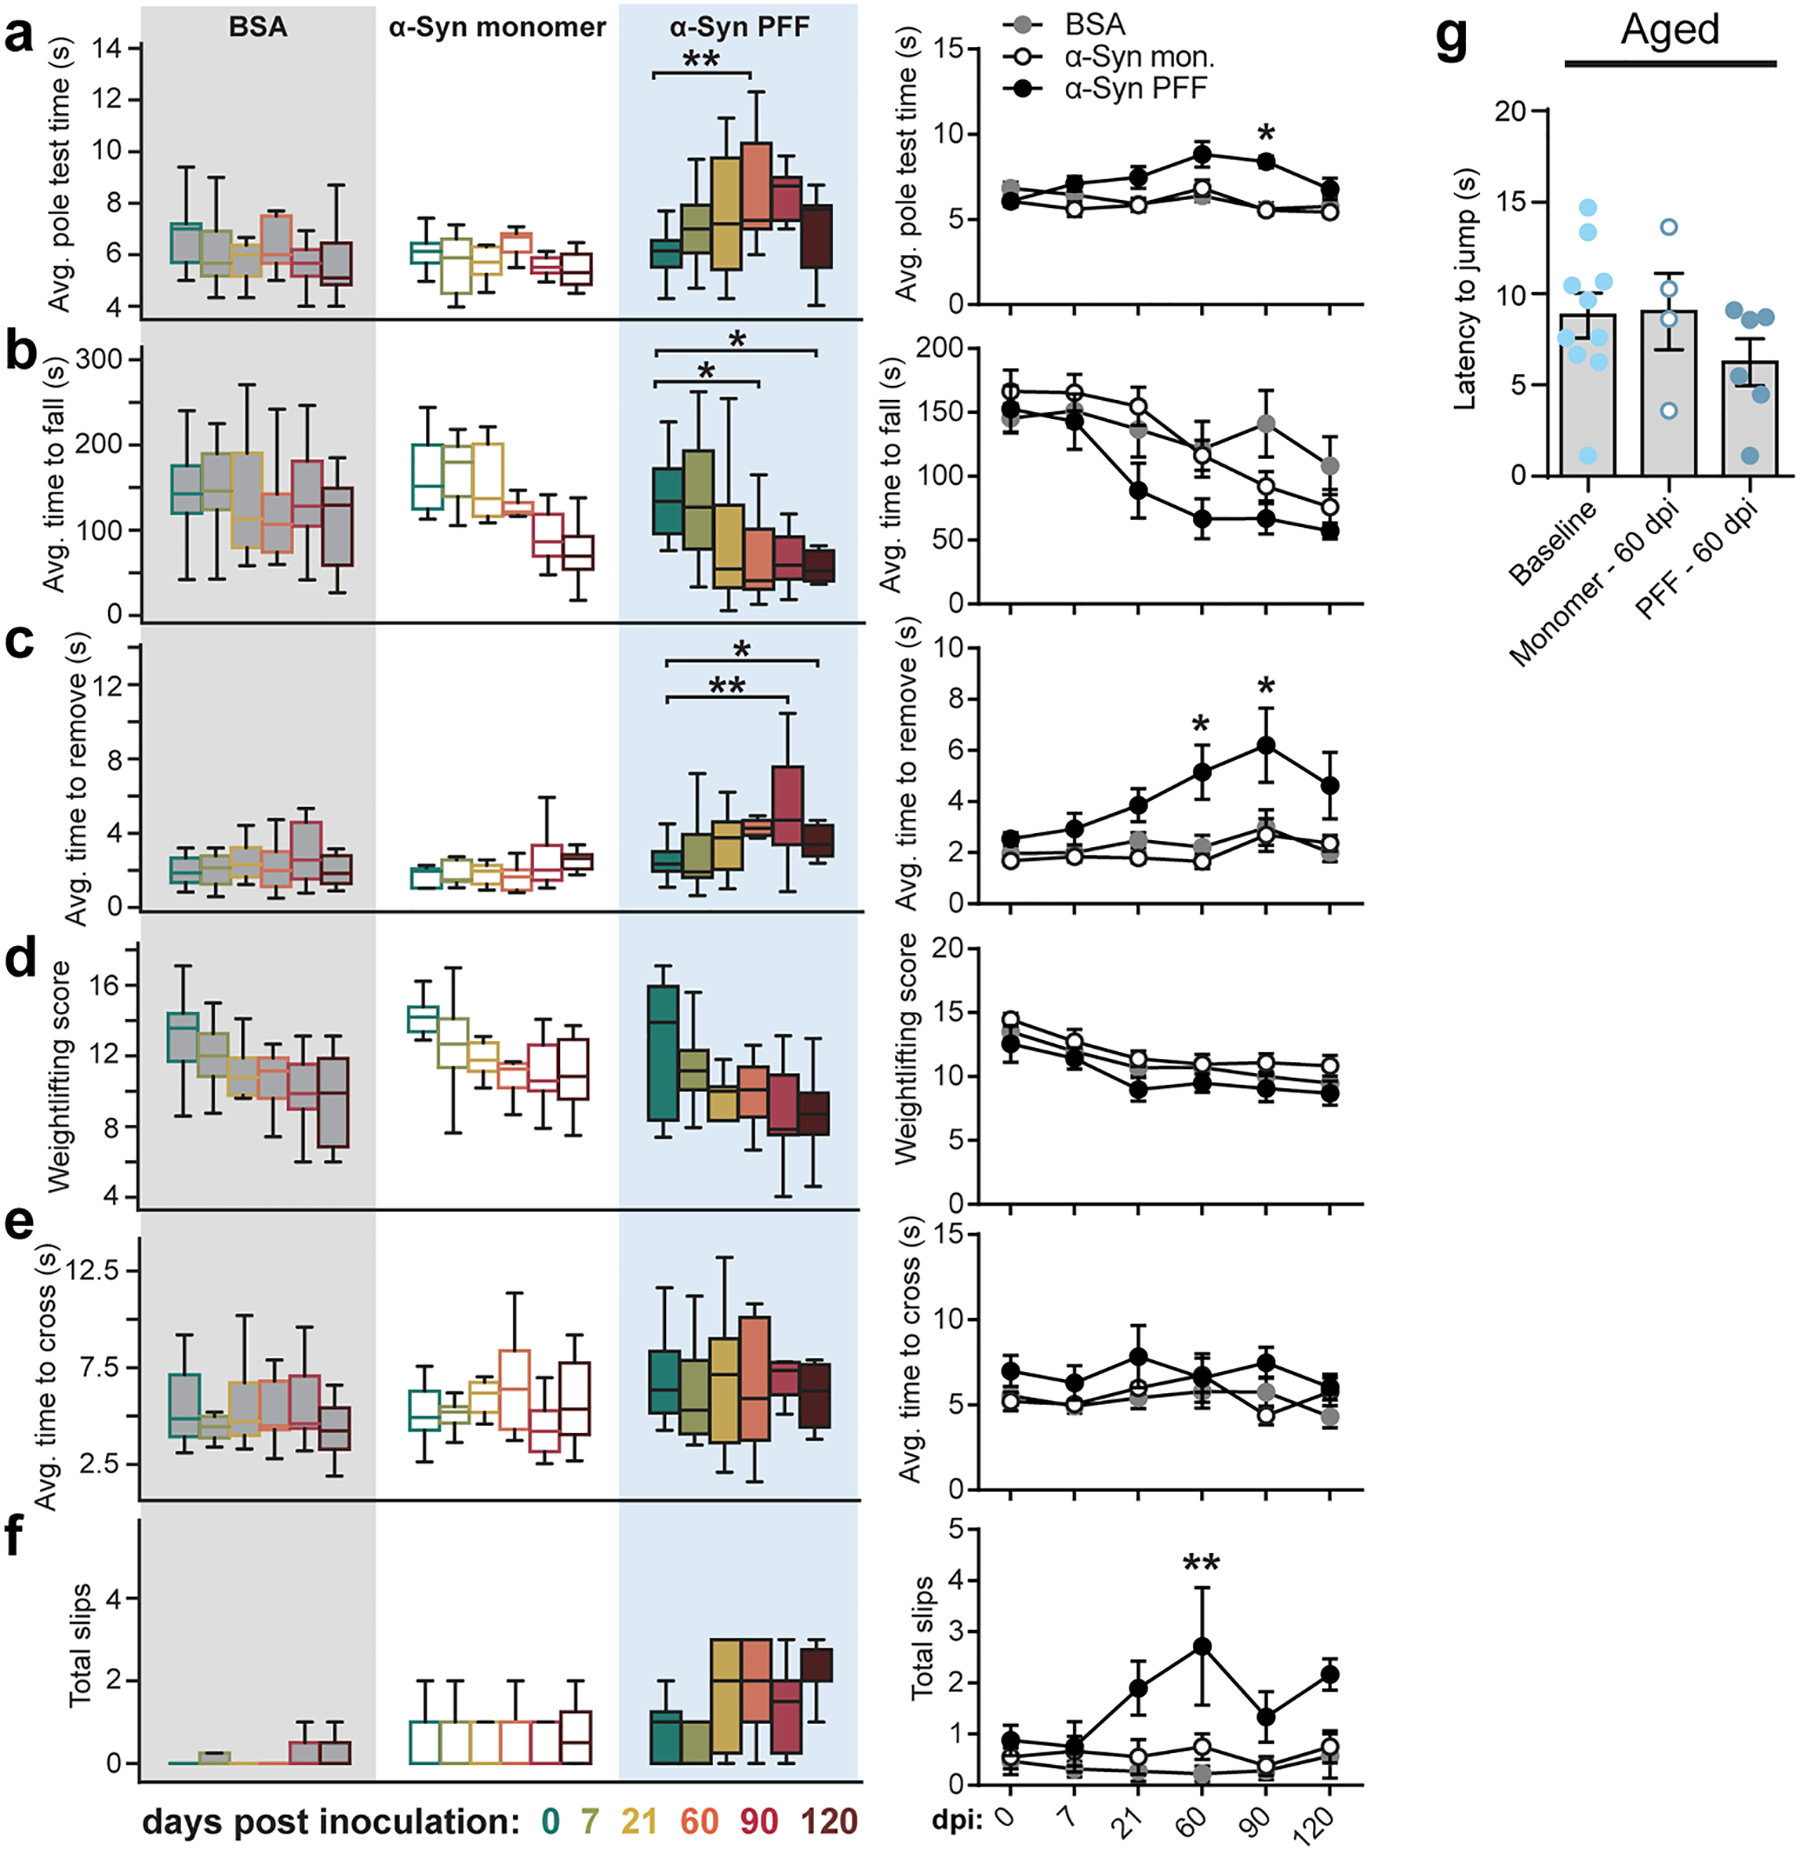
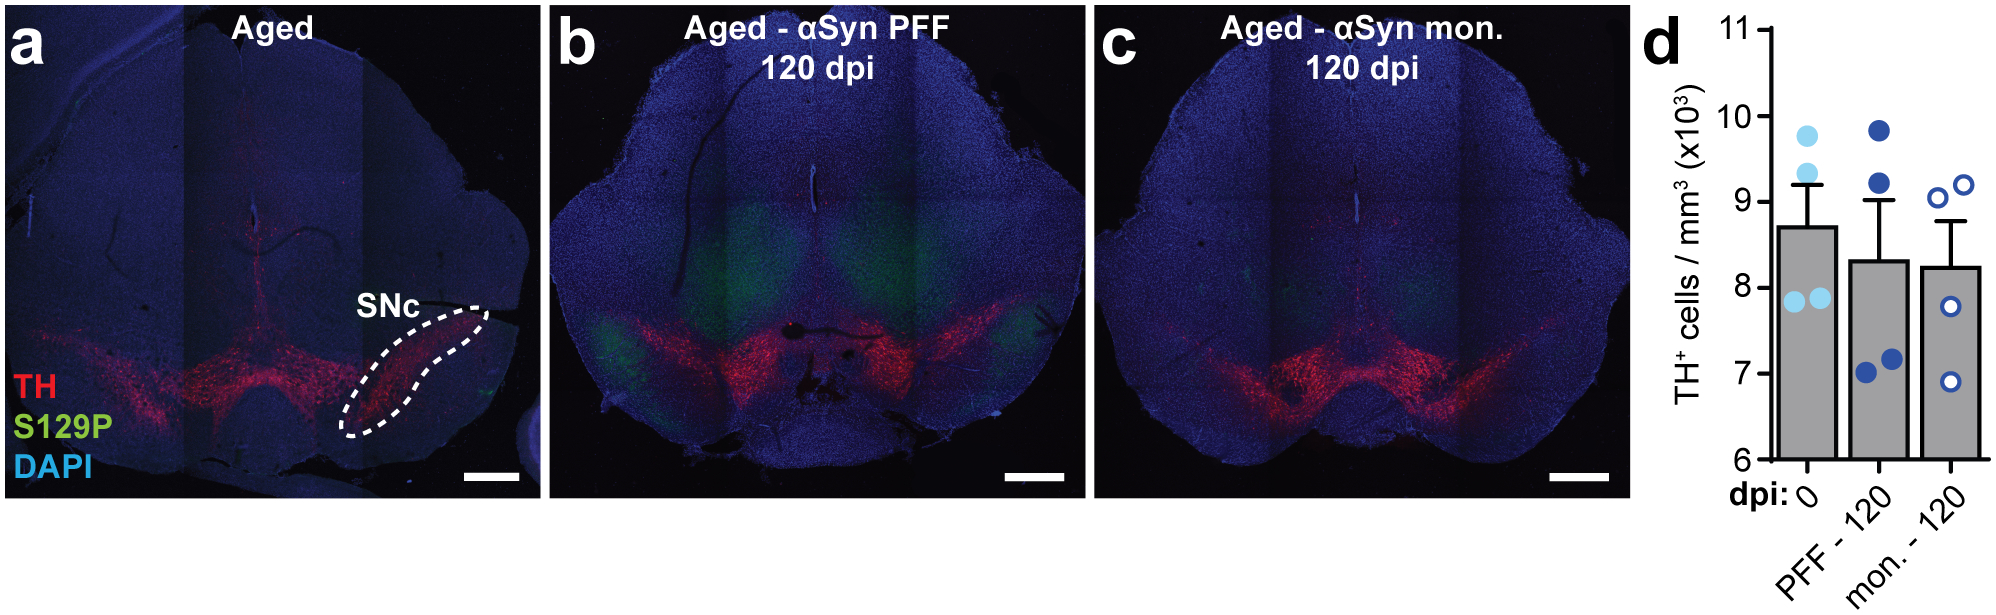
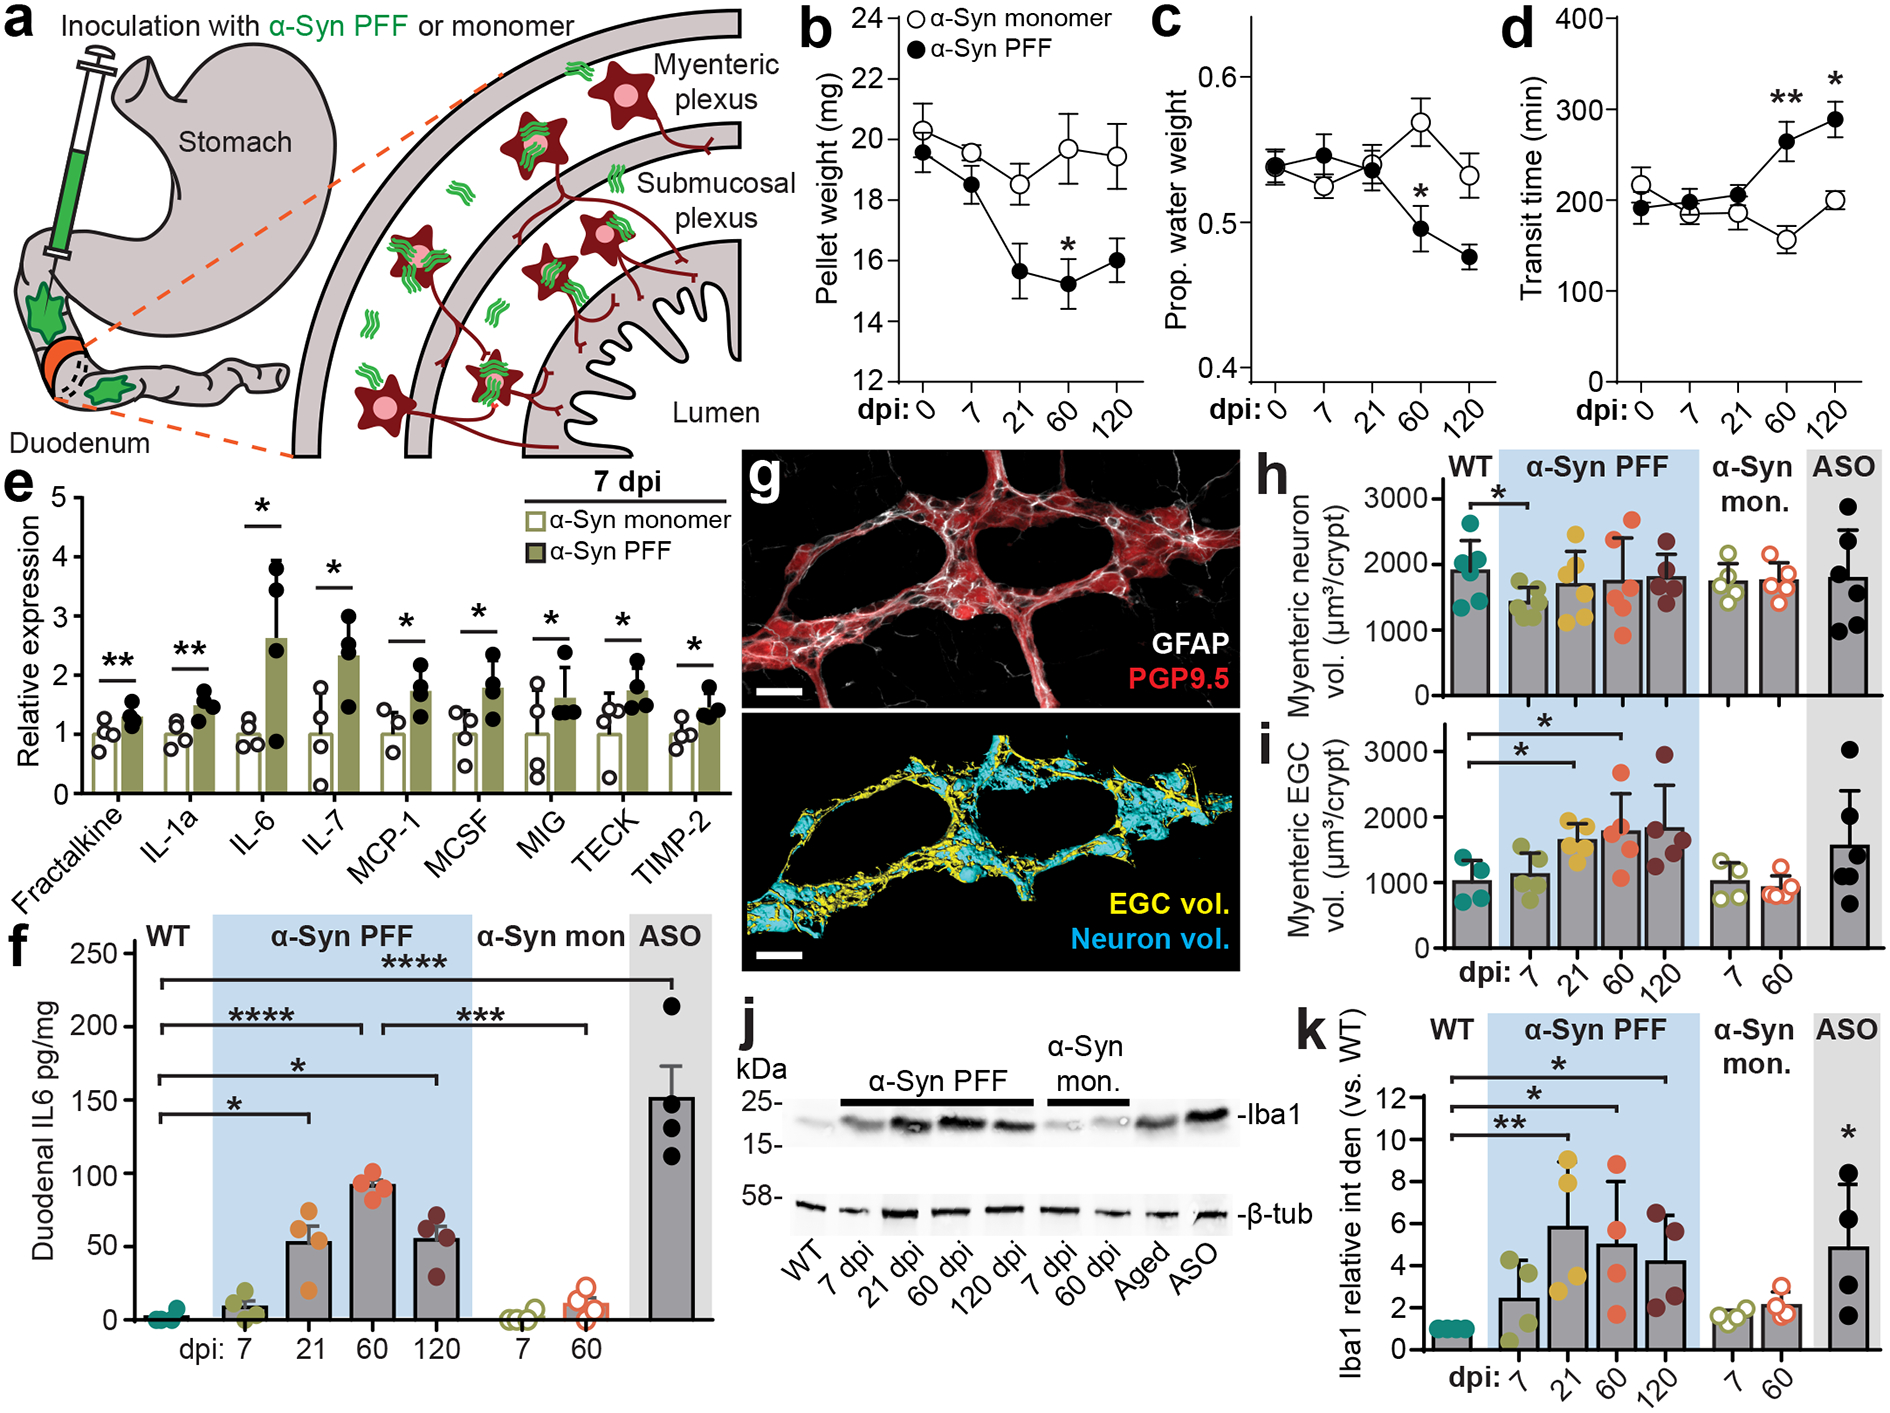
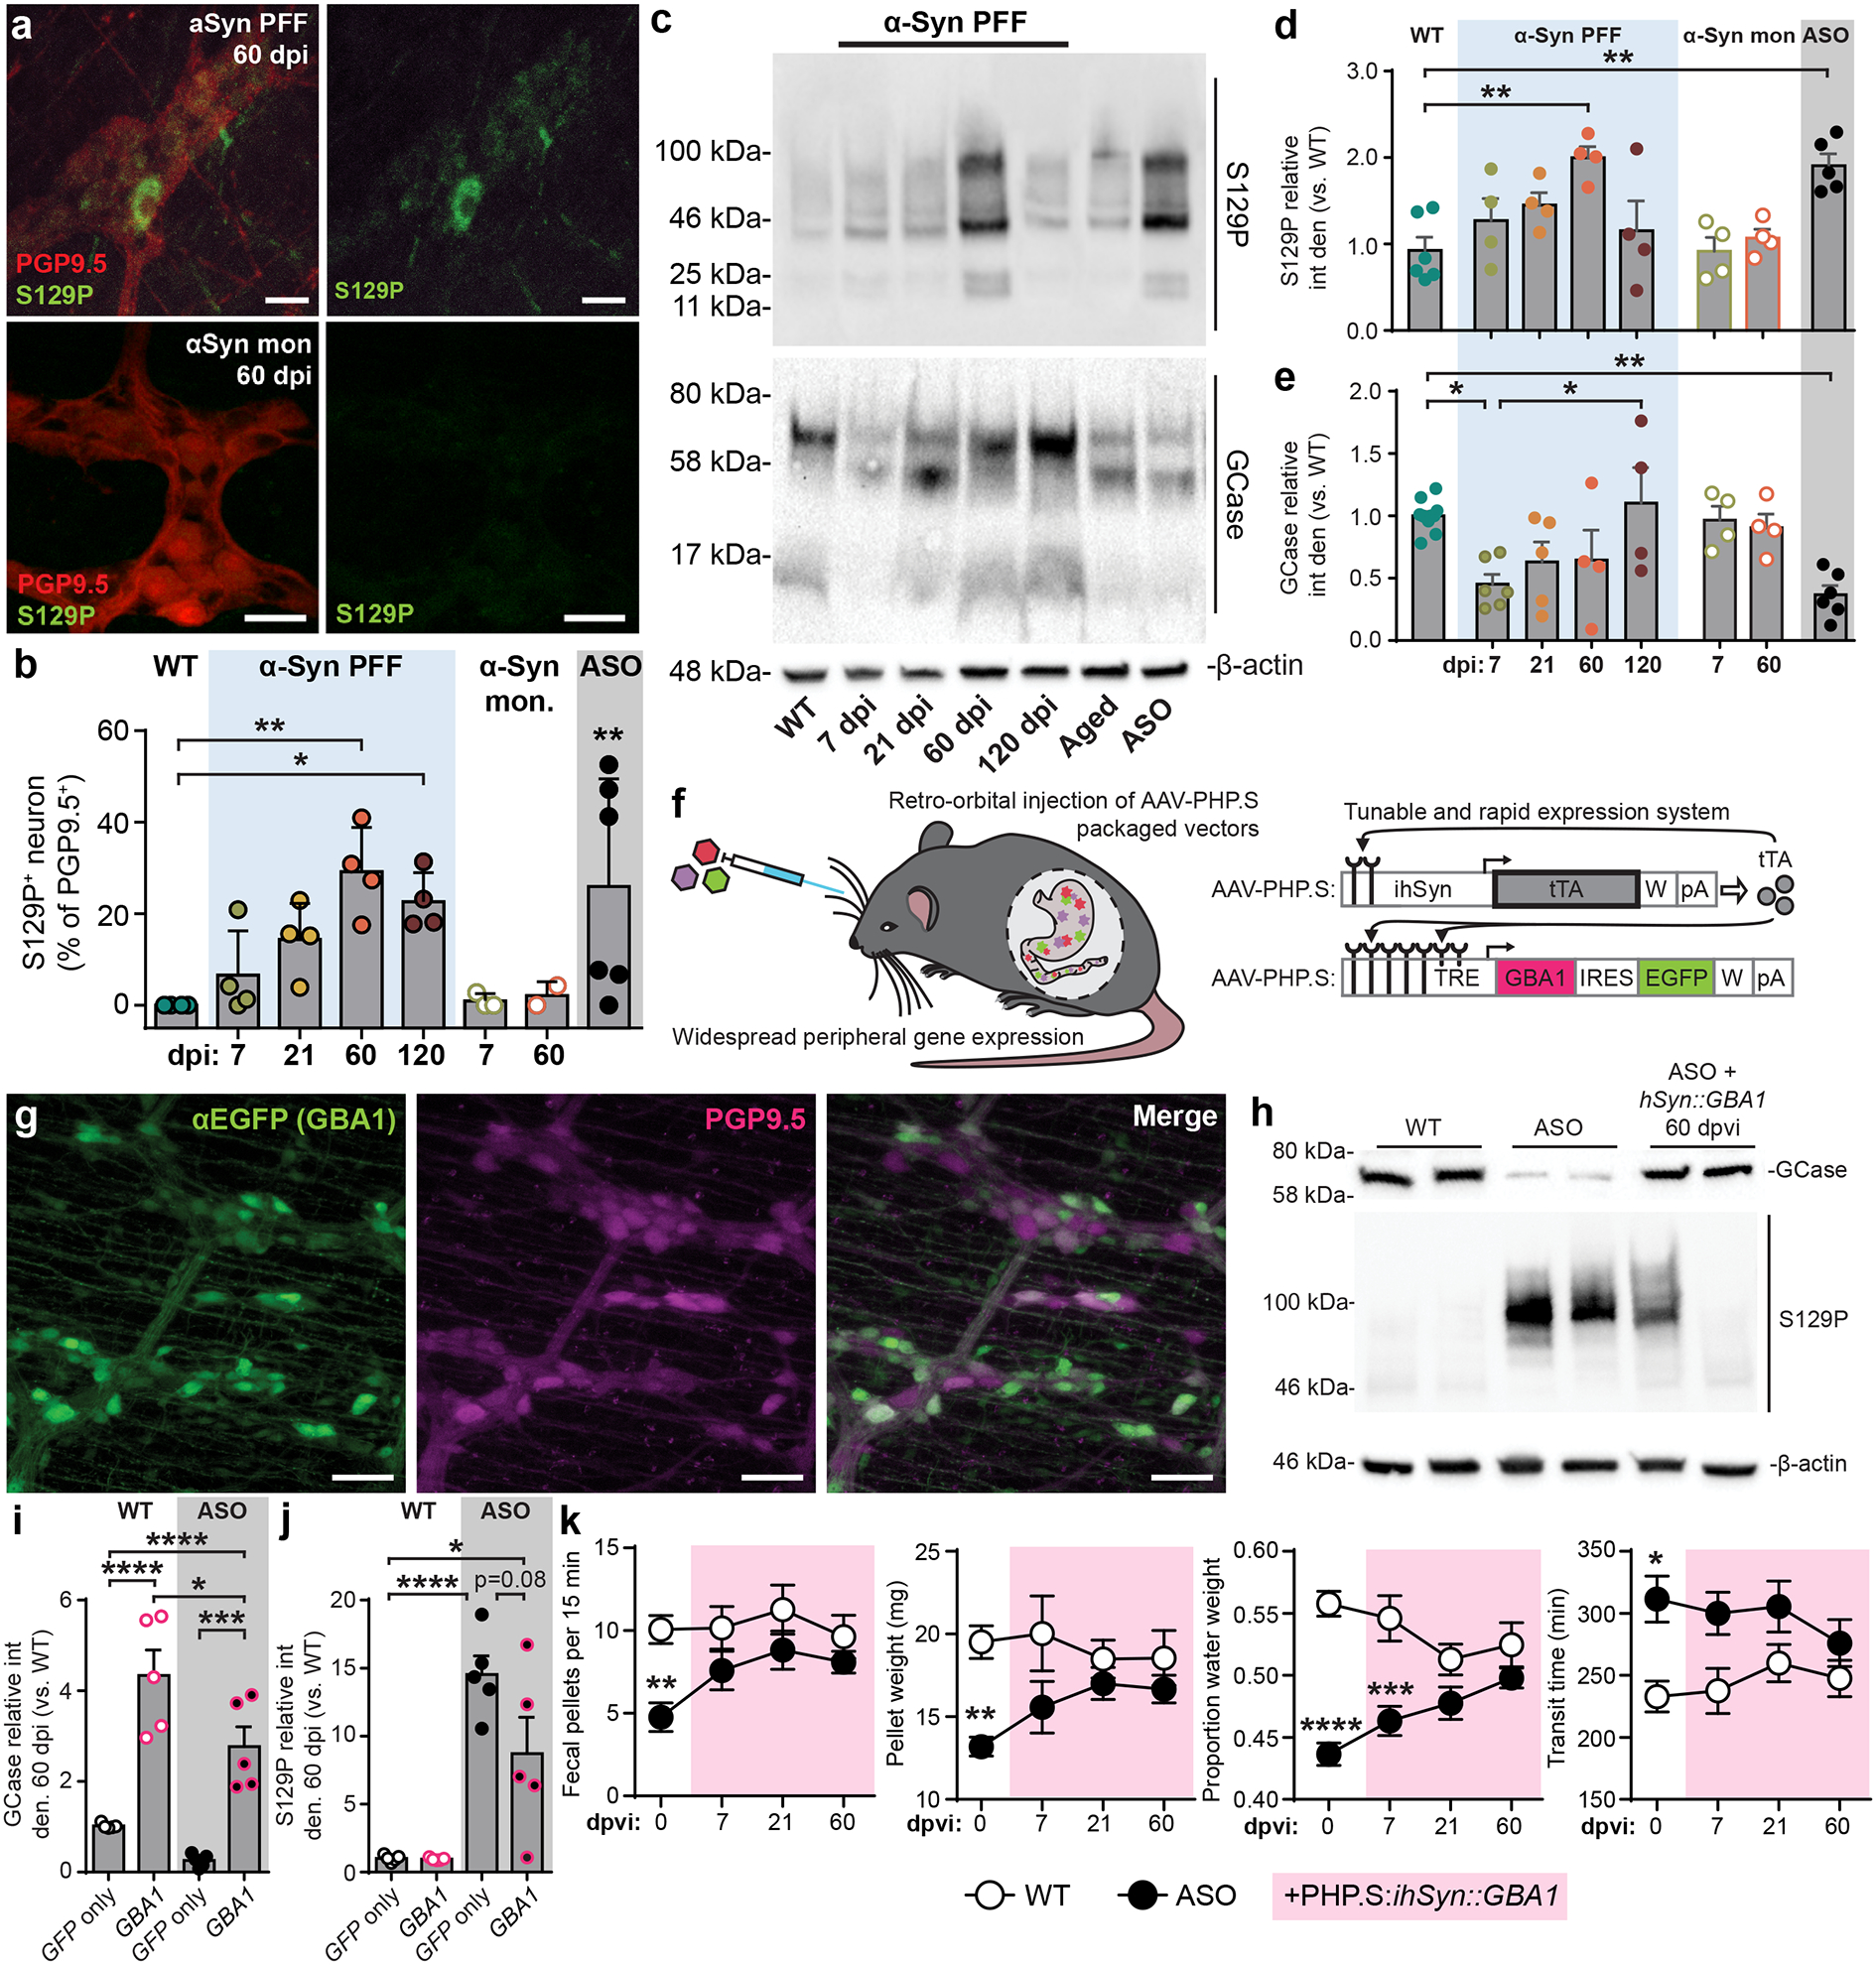
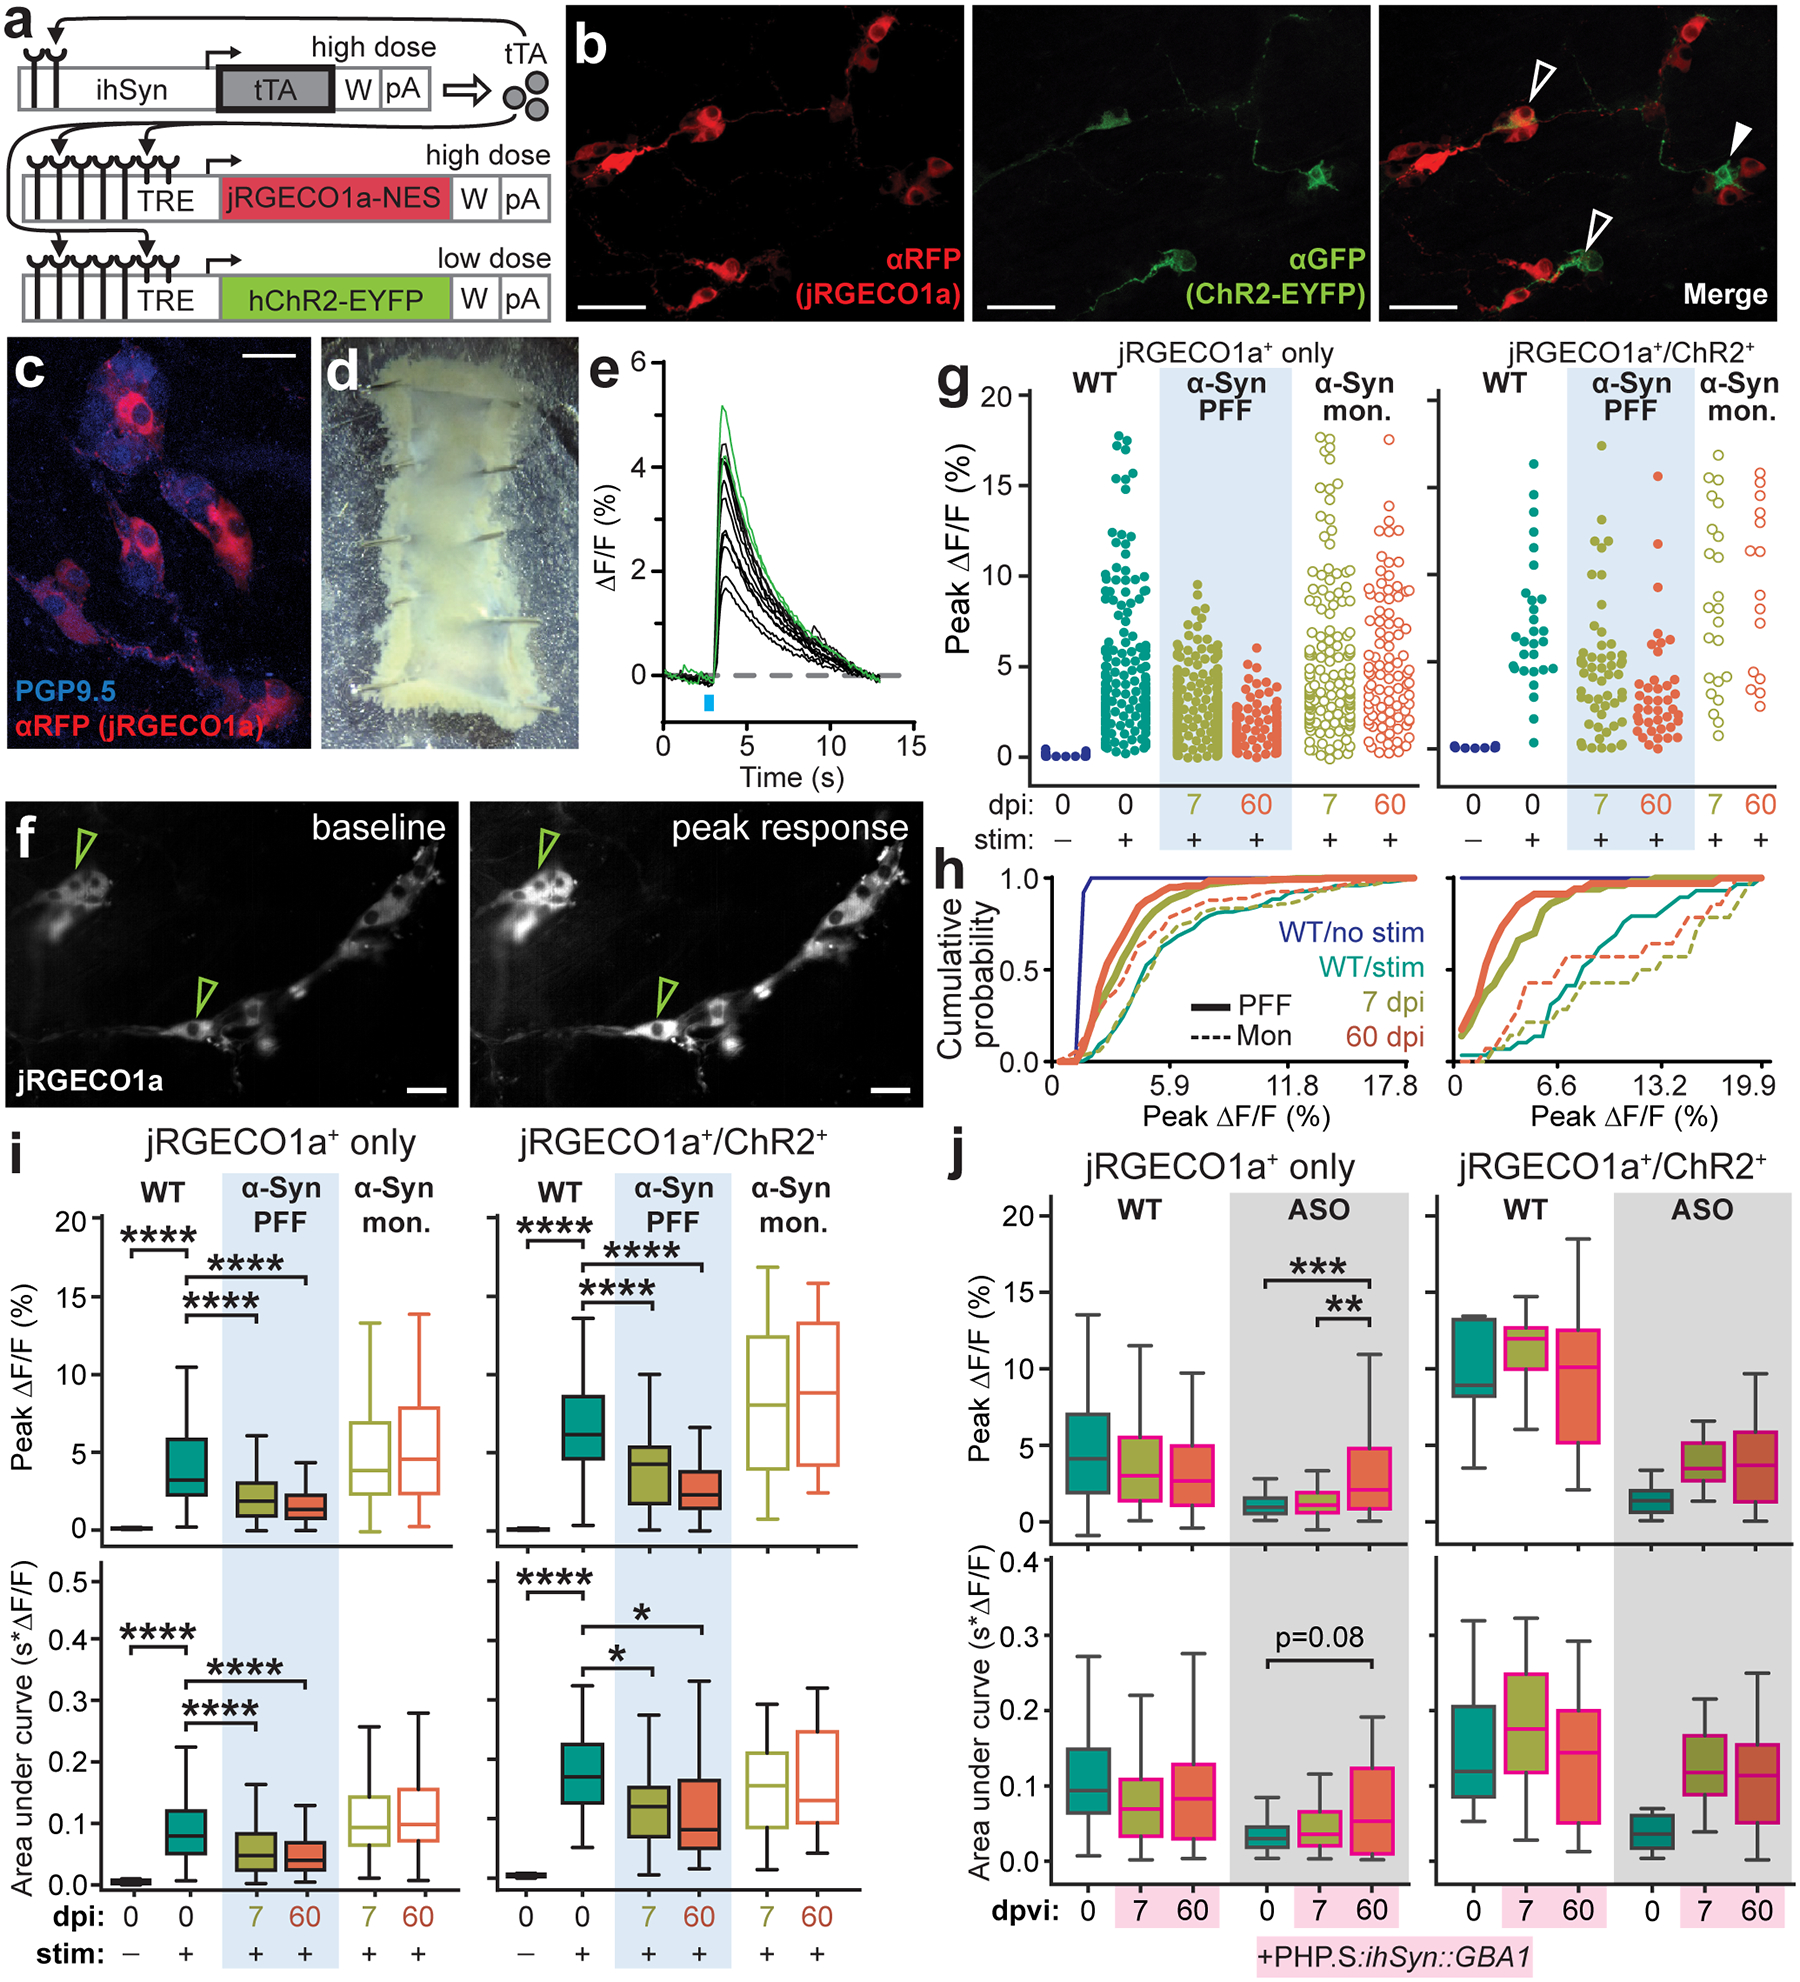
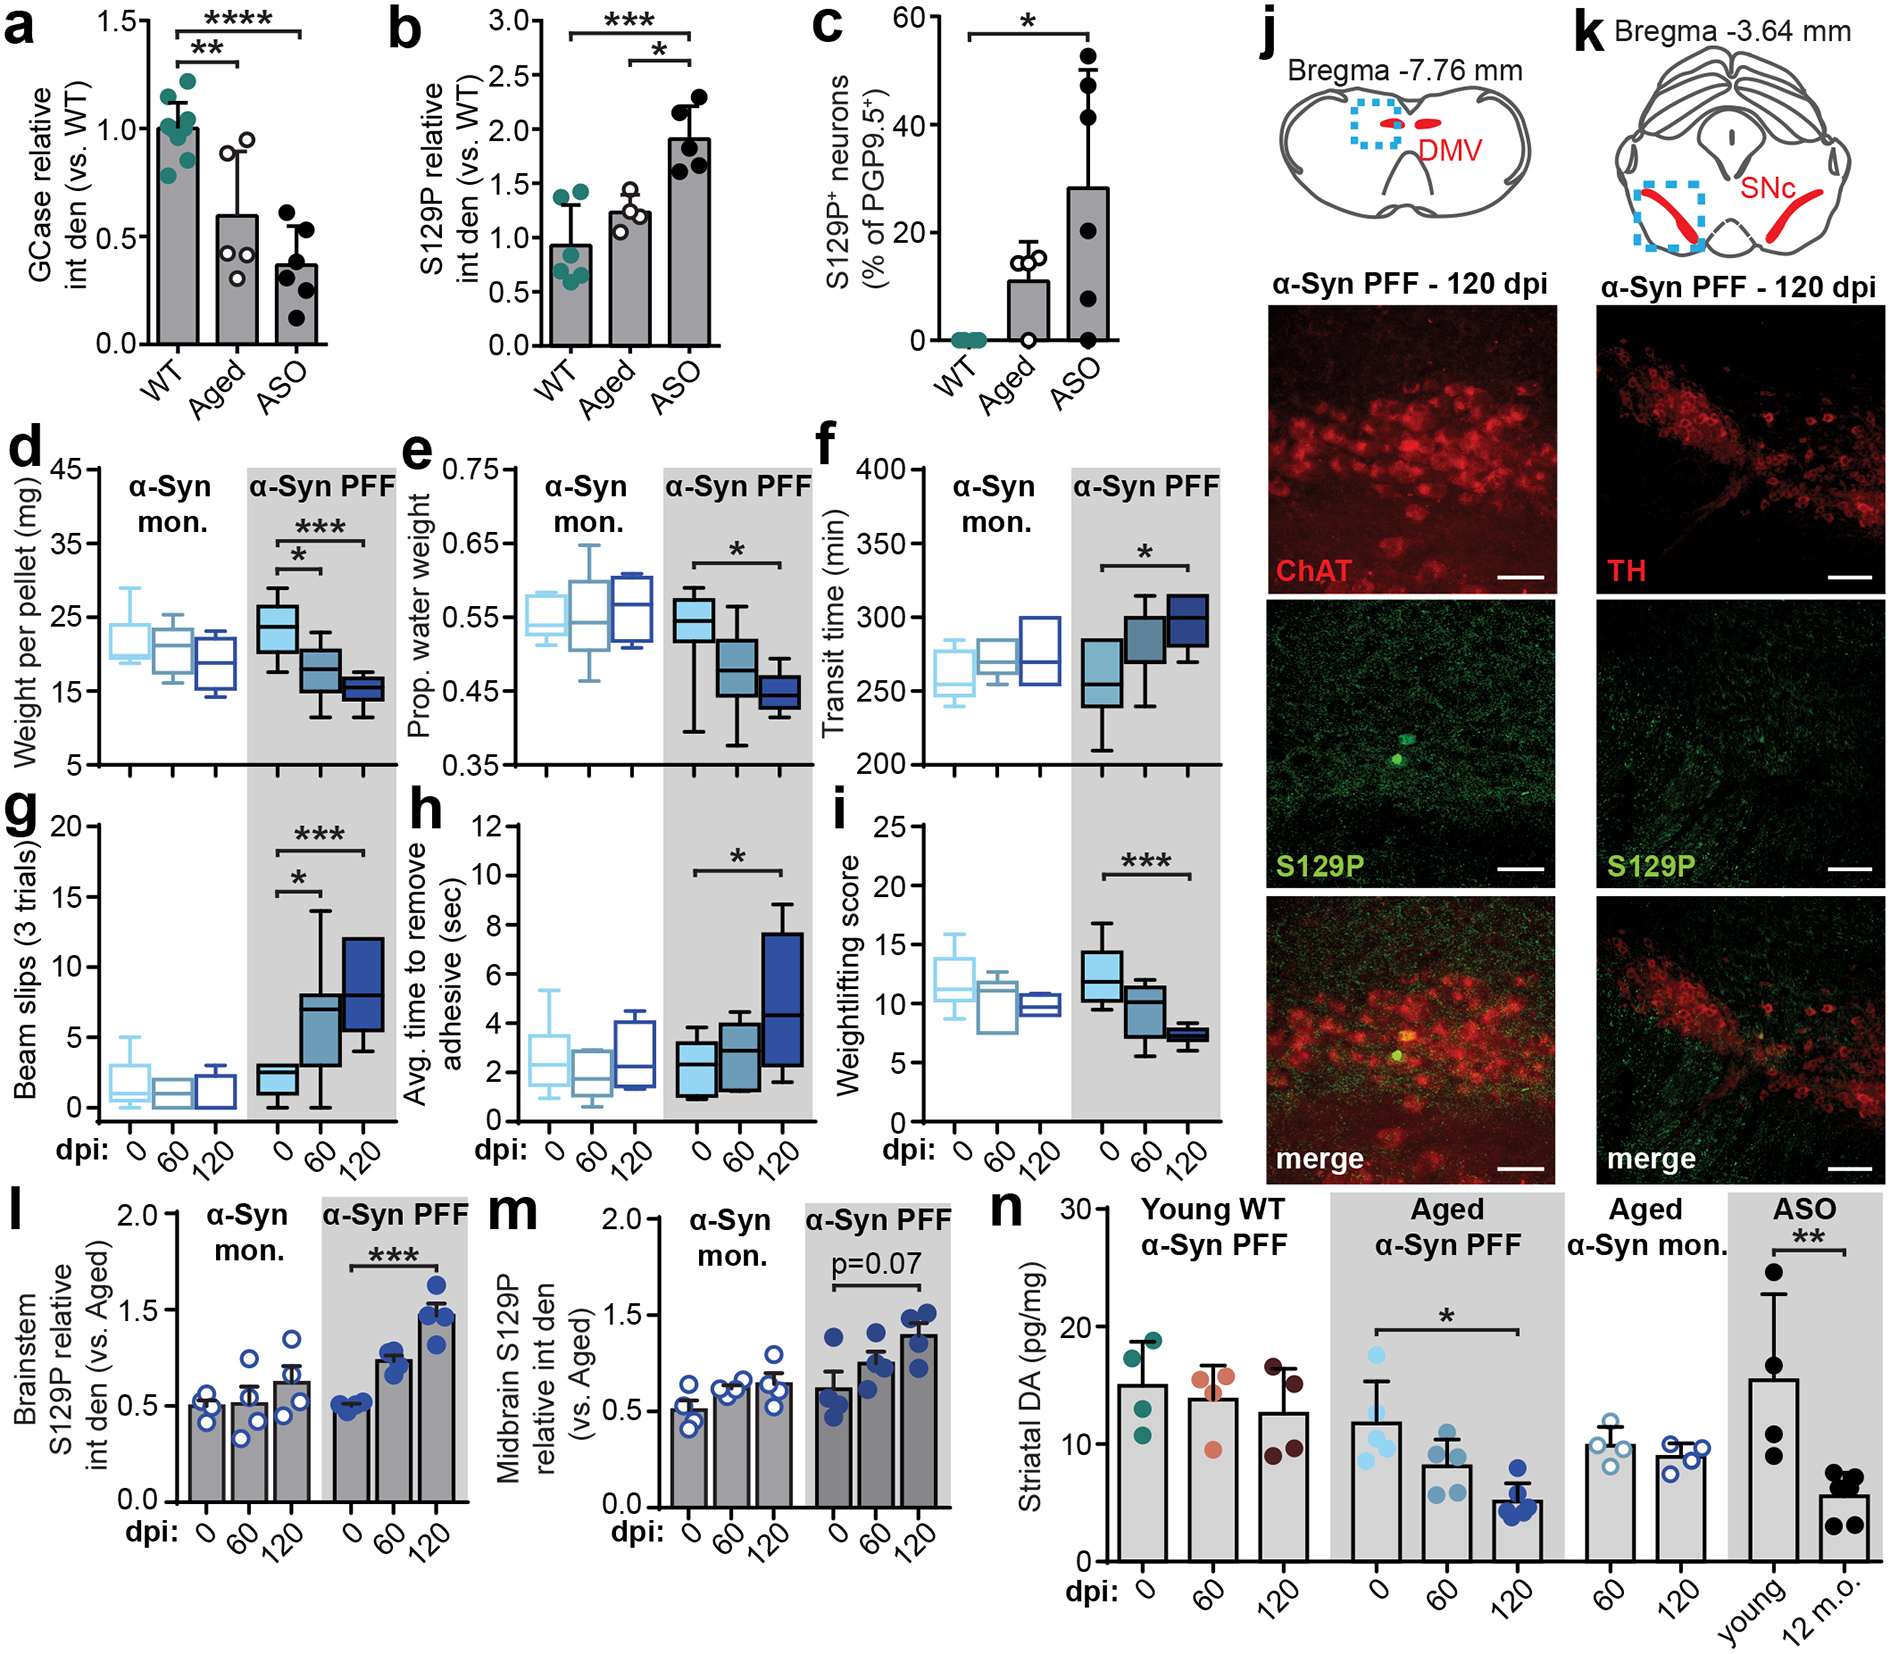
Parkinson's disease is a synucleinopathy that is characterized by motor dysfunction, death of midbrain dopaminergic neurons and accumulation of α-synuclein (α-Syn) aggregates. Evidence suggests that α-Syn aggregation can originate in peripheral tissues and progress to the brain via autonomic fibers. We tested this by inoculating the duodenal wall of mice with α-Syn preformed fibrils. Following inoculation, we observed gastrointestinal deficits and physiological changes to the enteric nervous system. Using the AAV-PHP.S capsid to target the lysosomal enzyme glucocerebrosidase for peripheral gene transfer, we found that α-Syn pathology is reduced due to the increased expression of this protein. Lastly, inoculation of α-Syn fibrils in aged mice, but not younger mice, resulted in progression of α-Syn histopathology to the midbrain and subsequent motor defects. Our results characterize peripheral synucleinopathy in prodromal Parkinson's disease and explore cellular mechanisms for the gut-to-brain progression of α-Syn pathology.


Conflict of interest statement

Declaration of Interests. All authors declare no competing interests.

Figures

Extended Data Fig. 1
Extended Data Fig. 1. Effect of αSyn pathology on GI health and cytokine expression
a-d, GI function in WT, ASO, and aged mice is characterized by fecal pellet production (a; WT vs. ASO **p = 0.022, ASO vs. Aged **p = 0.0075), fecal pellet weight (b; WT vs. ASO ****p < 0.0001, WT vs. Aged ***p = 0.0009, ASO vs. Aged ****p < 0.0001), proportion fecal water weight (c; WT vs. ASO ****p < 0.0001, ASO vs. Aged ****p < 0.0001), and whole gut fecal transit time (d; WT vs. ASO ****p < 0.0001, ASO vs. Aged **p = 0.0038). e, Animal weight (WT vs. Aged ****p < 0.0001, ASO vs. Aged ****p < 0.0001). f, qPCR analysis of GBA1 expression in duodenum. Dots represent average of technical triplicates from a single animal. g, Densitometry analysis of cytokine panel from duodenal lysates after inoculation with α-Syn PFF or α-Syn monomer 7 dpi (Fractalkine **p = 0.0030, IL-1a **p = 0.0070, IL-6 *p = 0.0415, IL-7 * p = 0.0400, MCP-1 *p = 0.0416, MCSF *p = 0.0467, MIG *p = 0.0412, TECK *p = 0.0365, TIMP-2 *p = 0.0400). h, Representative cytokine panels detected by chemiluminescence. i, Representative Western blot immunostained for IL-6 and densitometry analysis normalized to WT (WT vs. PFF 60 dpi *p = 0.0327, 60 dpi PFF vs. monomer *p = 0.0480, WT vs. ASO *p = 0.0304). Data depicted are mean ± s.e.m. P values were determined by one-way ANOVA (a-f,i). The following n values represents number of independent animals used for statistical evaluation: e1a-c, WT = 42, ASO = 20, Aged = 19; e1d, WT = 13, ASO = 9, Aged = 12; e1e, WT = 42, ASO = 20, Aged = 19; e1f, WT = 3, ASO = 4, Aged = 4; e1g, monomer and PFF = 4 each; e1i, all conditions = 4 each.
Extended Data Fig. 2
Extended Data Fig. 2. Visualization of the duodenal ENS and cell proliferation
a, Maximum intensity projection confocal image of duodenum whole-mount stained for PGP9.5 (neurons) and GFAP (EGCs). Higher magnification of dashed box shown in Fig. 1g. Scale bar, 200 μm. b, Virtual cross-section of the duodenal wall after optical clearing distinguishes myenteric and submucosal plexuses. Intestinal crypt layer is marked in blue. Scale bar, 100 μm. c, DAPI nuclear labeling visualizes the intestinal crypt layer used for histological analysis of the ENS (top). High-magnification of dashed box shows individual crypts (bottom). Scale bars, 100 μm. Experimental images for (a-c) were obtained from 8 independent mice, with similar results obtained. d, Quantification of number of myenteric neurons per crypt (top) or myenteric EGCs per crypt (bottom; WT vs. PFF 60 dpi *p = 0.0329, WT vs. PFF 120 dpi *p = 0.0232) e, Immunohistochemical labeling of EdU detects recently proliferated extraganglionic (open arrows) or myenteric ganglion cells (closed arrows). EGCs are co-labeled with GFAP. Scale bar, 20 μm. f, Quantification of total EdU+ cells per crypt (Monomer vs. PFF *p = 0.0071). Data depicted is mean ± s.e.m. P values were determined by One-Way ANOVA (d) or one-tailed Student’s t-test (f). The following n values represents number of independent animals used for statistical evaluation: e2d enteric neurons per crypt, WT = 6, PFF 0 dpi = 6, PFF 7 dpi = 6, PFF 21 dpi = 6, PFF 60 dpi = 6, PFF 120 dpi = 5, monomer conditions = 5 each; e2d EGCs per crypt, WT = 4, all PFF = 5 each, monomer 7 dpi = 4, monomer 60 dpi = 5; e2f, monomer = 4, PFF = 5.
Extended Data Fig. 3
Extended Data Fig. 3. Inoculation of duodenum with αSyn PFF promotes formation of αSyn filaments
a, Representative dot blot images of duodenal homogenates immunostained with an aggregation-specific α-Syn antibody (α-Syn filament) show an increase after α-Syn PFF inoculation and in ASO mice. b, Densitometry analysis of α-Syn filament dot blots of duodenal homogenates normalized to pre-injection WT mice (WT vs. ASO **p = 0.0092). c, Representative dot blot image of controls immunostained with α-Syn filament antibody: 50 ng BSA, 50 ng and 100 ng α-Syn monomer, 50 ng and 100 ng α-Syn PFF. d, Densitometry analysis of control blots normalized to 50 ng BSA (BSA vs. PFF 50ng **p = 0.0080, BSA vs. PFF 100ng ***p = 0.0009, monomer 50ng vs. PFF 50ng *p = 0.0178, monomer 100ng vs. PFF 100ng **p = 0.0078). Data depicted is mean ± s.e.m. P values were determined by one-way ANOVA (a, d). The following n values represents number of independent animals used for statistical evaluation: e3b, WT = 8, all PFF = 5 each, all monomer = 4 each, ASO = 8, Aged = 5; e3d, BSA = 4, all other groups = 3 each.
Extended Data Fig. 4
Extended Data Fig. 4. GBA1 gene transfer increases GCase function and improves GI health
a-d, Characterization of GI function before and after peripheral GBA1 gene transfer by quantifying fecal pellet production (b), fecal pellet weight (c; ASO 0 vs. 60 dpvi *p = 0.0265), proportion fecal water weight (d), and whole gut fecal transit time (e). e-h, Characterization of GI function before and after peripheral EGFP gene transfer by quantifying fecal pellet production (e), fecal pellet weight (f), proportion fecal water weight (g), and whole gut fecal transit time (h; 0 dpi WT vs. ASO **p = 0.0085, 60 dpi WT vs. ASO *p = 0.0293). Data depicted are mean ± s.e.m. P values were determined by two-way ANOVA (a-h). The following n values represents number of independent animals used for statistical evaluation: e4a-d, for 0 / 7 / 21 / 60 dpi: WT = 17 / 12 / 11 / 8, ASO = 13 / 12 / 11 / 10; e4e-h, all conditions = 4 each.
Extended Data Fig. 5
Extended Data Fig. 5. ENS neurotransmission is disrupted by αSyn pathology and restored by GBA1 gene transfer
a, Quantification of average peak percent change in fluorescence and area under the curve after photostimulation pulse for jRGECO1a+-only or jRGECO1a+/ChR2+ duodenal neurons before and after inoculation (all ****p < 0.0001). b, Quantification of average peak percent change in fluorescence and area under the curve after photostimulation pulse for jRGECO1a+-only or jRGECO1a+/ChR2+ duodenal neurons before and after systemic delivery of AAV-PHP.S::ihSyn:GBA1 (Peak ΔF/F jRGECO1a+ 0 dpvi WT vs. ASO ****p < 0.0001, 7 dpvi WT vs. ASO ****p < 0.0001; Peak ΔF/F jRGECO1a+/ChR2+ 0 dpvi WT vs. ASO ****p < 0.0001, 7 dpvi WT vs. ASO ***p = 0.0006; AUC jRGECO1a+ 0 dpvi WT vs. ASO ****p < 0.0001, 7 dpvi WT vs. ASO **p = 0.0031; AUC jRGECO1a+/ChR2+ 0 dpi WT vs. ASO *p = 0.0398). Data depicted are mean ± s.e.m. P values were determined by two-way ANOVA. The following n values represents number of independent animals used for statistical evaluation: e5a, 0 dpi = 3, PFF 7 dpi = 4, PFF 60 dpi = 3, monomer 7 dpi = 3, monomer 60 dpi = 3; e5b, all conditions = 3.
Extended Data Fig. 6
Extended Data Fig. 6. Inoculation of duodenum with αSyn PFF in adult mice does not progress αSyn pathology to the nodose ganglion
a, Maximum intensity 3D projection confocal image of a whole nodose ganglion from an α-Syn PFF inoculated WT mouse 60 dpi. Ganglion was PACT cleared and immunolabeled for PGP9.5 (neurons), S129P, and DAPI (nuclei). Experimental images were obtained from 14 independent mice, with similar results obtained. Scale bars, 100 μm. Z-stack depth, 500 μm. b, Maximum intensity 3D projection confocal image of a nodose ganglion from a WT mouse. Experimental images were obtained from 5 independent mice, with similar results obtained Scale bar, 100 μm. Z-stack depth, 450 μm. c, Quantification of S129P+ nodose ganglion neurons (WT vs. ASO **p = 0.0011, monomer 7 dpi vs. ASO **p = 0.0027, monomer 60 dpi vs. ASO *p = 0.0176, ASO vs. Aged *p = 0.0323). Data depicted is mean ± s.e.m. P values were determined by one-way ANOVA. The following n values represents number of independent animals used for statistical evaluation: e6c, WT = 5, ASO = 5, Aged = 5, for 7 / 60 / 120 dpi, PFF = 5 / 5 / 4, monomer = 4 / 3 / 0.
Extended Data Fig. 7
Extended Data Fig. 7. Inoculation of duodenum with αSyn PFF in adult mice does not progress αSyn pathology to the brain
a-b, Maximum intensity projection confocal images of the brainstem (approximately −7.76 mm from Bregma) from an α-Syn PFF-inoculated 8 week old WT mouse 60 dpi (a) and an ASO mouse (b), immunolabeled for cholinergic neurons (ChAT) and S129P. Scale bars, 500 μm. Experimental images for (a-b) were obtained from 3 independent mice, with similar results obtained. c-d, Maximum intensity projection confocal images of the midbrain (approximately −3.64 mm from Bregma) from an α-Syn PFF-inoculated WT mouse 60 dpi (c) and an ASO mouse (d), immunolabeled for dopaminergic neurons (TH), S129P, and nuclei (DAPI). Scale bars: 500 μm. Experimental images for (c-d) were obtained from 3 independent mice, with similar results obtained. e-f, Densitometry analysis of S129P signal in the DMV (e; WT vs. ASO ***p = 0.0003, PFF 60 dpi vs. ASO ***p = 0.0007) and SNc (f; WT vs. ASO **p = 0.0011, PFF 60 dpi vs. ASO **p = 0.0014) per unit area, normalized to WT. Data depicted is mean ± s.e.m. P values were determined by one-way ANOVA (a, d). The following n values represents number of independent animals used for statistical evaluation: e7e-f, all conditions = 3 each.
Extended Data Fig. 8
Extended Data Fig. 8. Duodenal inoculation with αSyn PFF in adult mice does not produce sensorimotor deficits
a-f, Sensorimotor behaviors after inoculation were quantified using average time to turn and descend a pole (a; PFF 0 vs. 60 dpi **p = 0.0012, 90 dpi PFF vs. monomer *p = 0.0265), average time before falling during the inverted wire-hang paradigm (b; PFF 0 vs. 60 dpi *p = 0.0306, PFF 0 vs. 120 dpi *p = 0.0285), average time to remove adhesive from nasal bridge (c; PFF 0 vs. 90 dpi **p = 0.0014, PFF 0 vs. 120 dpi *p = 0.0285, 60 dpi PFF vs. monomer *p = 0.0193, 90 dpi PFF vs. monomer *p = 0.0342), average weightlifting paradigm score (d), average time to cross a narrowing beam (e), and total number of slips incurred during 3 trials of the narrowing beam paradigm (f; 60 dpi PFF vs. BSA **p = 0.0023). Boxplots represent median, interquartile range, and 1.5× the interquartile range. g, Hot plate test did not reveal any changes in nociception at 60 dpi. Data depicted is mean ± s.e.m. P values were determined by two-way ANOVA (a-f) or one-way ANOVA (g). The following n values represents number of independent animals used for statistical evaluation: e8a-c, for 0 / 7 / 21 / 60 / 90 / 120 dpi, PFF = 16 / 14 / 14 / 11 / 9 / 8, monomer = 9 / 9 / 9 / 8 / 8 / 8, BSA = 17 / 16 / 11 / 9 / 7 / 7; e8d, for 0 / 7 / 21 / 60 / 90 / 120 dpi, PFF = 8 / 8 / 12 / 8 / 8 / 8, monomer = 9 / 9 / 9 / 8 / 8 / 8, BSA = 17 / 16 / 11 / 9 / 7 / 7; e8e-f, for 0 / 7 / 21 / 60 / 90 / 120 dpi, PFF = 8 / 8 / 10 / 7 / 6 / 6, monomer = 9 / 9 / 9 / 8 / 8 / 8, BSA = 17 / 16 / 11 / 9 / 7 / 7; e8g, baseline = 10, monomer = 4, PFF = 6.
Extended Data Fig. 9
Extended Data Fig. 9. Duodenal αSyn PFF inoculation in aged mice does not result in SNc dopaminergic cell loss
a-c, Representative images of the midbrain immunostained for dopaminergic neurons (TH), S129P, and nuclei (DAPI) from aged mice pre-inoculation (a), α-Syn PFF-inoculated aged mice 120 dpi, and α-Syn-monomer inoculated aged mice 120 dpi. Scale bars, 500 μm. Experimental images for (a-c) were obtained from 12 independent mice, with similar results obtained. d, Quantification of dopaminergic cell density within the boundary of the SNc as determined by TH+ signal (example shown in [a]). Data depicted is mean ± s.e.m. P values were determined by one-way ANOVA. The following n values represents number of independent animals used for statistical evaluation: e9d, all conditions = 4.
Fig. 1 |
Fig. 1 |. Inoculation of duodenum with α-Syn PFF impacts the ENS and GI function.
a, Schematic depicting intramuscular injection of the duodenum and interaction of injected material (α-Syn PFF, α-Syn monomer, BSA) with components of the intestinal wall, including the myenteric and submucosal plexus of the ENS, but not lumen. b-d, GI function following inoculation is characterized by determining fecal pellet weight (b; PFF vs. monomer, 60 dpi *p = 0.0187), proportion fecal water weight (c; PFF vs. monomer, 60 dpi *p = 0.0259), and whole gut fecal transit time (d; PFF vs. monomer, 60 dpi **p = 0.0012, 120 dpi *p = 0.0239). e, Densitometry analysis of cytokine expression from duodenal lysates 7 dpi with α-Syn PFF or α-Syn monomer. Values are normalized to the average of the α-Syn monomer group. (Fractalkine, **p = 0.0030; IL-1a, **p = 0.0070; IL-6, *p = 0.0415; IL-7, *p = 0.0400; MCP-1, *p = 0.0416; MCSF, *p = 0.0467; MIG, *p = 0.0412; TECK, *p = 0.0365; TIMP-2, *p = 0.0400). f, ELISA analysis of duodenal IL-6 levels (WT vs PFF: 21 dpi *p = 0.0366, 60 dpi ****p < 0.0001, 120 dpi *p = 0.0245; 60 dpi: PFF vs. monomer ***p = 0.0001; WT vs. ASO ***p < 0.0001). g, Immunohistochemical labeling of PGP9.5 (neurons) and GFAP (EGCs) visualizes myenteric ganglia (top). Three-dimensional renderings are then derived of neuronal and EGC volumes of the myenteric ganglion (bottom). The experiment was repeated in 44 independent mice, with similar results obtained. Scale bars, 30 μm. h-i, Quantification of digitally reconstructed duodenal myenteric neuronal (h; WT vs. PFF, 7 dpi *p = 0.0425) and EGC (i; WT vs. PFF, 120 dpi *p = 0.0232) volumes. j, Representative Western blots immunostained for the Iba1 microglial marker and β-tubulin control from duodenal lysates. k, Densitometry analysis of Iba1 expression from duodenal lysates, normalized to WT. ASO is statistically compared to WT (WT vs PFF, 21 dpi **p = 0.0039, 60 dpi *p = 0.0149, 120 dpi *p = 0.0467; WT vs. ASO *p = 0.0182). Data represented are mean ± s.e.m. P values were determined by two-way analysis of variance (ANOVA) (b-d), one-tailed Student’s t-test (e), or one-way ANOVA (f, h-i, k). The following n values represents number of independent animals for statistical evaluation: 1b and 1c, for 0 / 7 / 21 / 60 / 120 dpi: monomer = 9 / 9 / 9 / 8 / 8, PFF = 16 / 14 / 14 / 11 / 8; 1d, for 0 / 7 / 21 / 60 / 120 dpi: monomer = 6 / 7 / 6 / 6 / 6, PFF = 7 / 8 / 9 / 9 / 8; 1e, monomer and PFF = 4 each; 1f, all conditions = 4 each, except ASO = 5; 1h and 1i, WT = 6, ASO = 6, for 7 / 21 / 60 / 120 dpi: PFF = 6 / 6 / 5 / 5, for 7 / 60 dpi: monomer = 5 / 5; 1k, all conditions = 4 each.
Fig. 2 |
Fig. 2 |. Pathologic α-Syn disrupts GCase and GI function and is ameliorated by GBA1 peripheral gene transfer.
a, Immunohistochemical labeling of S129P detects p-α-Syn inclusions in PGP9.5+ myenteric neurons from α-Syn PFF (top) or α-Syn monomer (bottom) inoculated mice. Experimental images were obtained from 32 independent mice with two images taken per mouse, with similar results obtained. Scale bars, 20 μm. b, Quantification of proportion of S129P+ enteric neurons (myenteric and submucosal). ASO is statistically compared to WT (WT vs. PFF, 60 dpi ** p = 0.0026, 120 dpi *p = 0.0155; WT vs. ASO **p = 0.0032). c, Representative Western blots immunostained for S129P, GCase, and β-actin control from duodenal lysates. d-e, Densitometry analysis of GCase (d; WT vs. PFF, 60 dpi **p = 0.0042; WT vs. ASO **p = 0.0057) and S129P (e; WT vs. PFF, 7 dpi *p = 0.0202; WT vs. ASO **p = 0.0035) production from duodenal lysates. Values are normalized to WT. f, Schematic depicting two-vector scheme (ihSyn-tTA:TRE-GBA1) for rapid expression of GCase. Retro-orbital injection of AAV-PHP.S-packaged vectors that result in non-invasive, widespread delivery to peripheral organs. ihSyn – inducible human synapsin promoter, tTA – tetracycline-off transactivator, TRE – tet-responsive elements, IRES – internal ribosome entry site, W – woodchuck hepatitis virus posttranscriptional regulatory element (WPRE), pA – human growth hormone polyadenylation (hghPA). g, Confocal image depicting efficiency of ihSyn-tTA:TRE-GBA1 vector system to transduce enteric neurons (PGP9.5). Experimental images were obtained from 6 independent mice, with similar results obtained. Scale bars, 50 μm. h, Representative Western blots immunostained for GCase, S129P, and β-actin control from duodenal lysates from virus-treated mice. i-j Densitometry analysis of GCase (i; WT/GFP vs. WT/GBA1 ****p < 0.0001; WT/GFP vs. ASO/GBA1 * p = 0.0192; ASO/GFP vs. ASO/GBA1 ***p = 0.0008; WT/GBA1 vs. ASO/GBA1 *p = 0.0410) and S129P (j; WT/GFP vs. ASO/GFP ****p < 0.0001; WT/GFP vs. ASO/GBA1 *p = 0.0139) expression from duodenal lysates 60 dpvi. Values are normalized to the WT/GFP only condition. k, GI function following peripheral GBA1 gene transfer is characterized by determining number of fecal pellets produced (0 dpi **p = 0.0078), fecal pellet weight (0 dpi **p = 0.0061), proportion fecal water weight (0 dpi ****p < 0.0001, ***p = 0.0003), and whole gut fecal transit time (0 dpi *p = 0.0123). Data depicted are mean ± s.e.m. P values were determined by one-way ANOVA (b,d-e) or two-way ANOVA (i-k). The following n values represents number of independent animals for statistical evaluation: 2b, all conditions = 4 each; 2d, all conditions = 4, except WT = 6, ASO = 5; 2e, WT = 11, ASO = 6, for 7 / 21 / 60 / 120 dpi: PFF = 6 / 5 / 4 / 4, for 7 / 60 dpi: monomer = 4 / 4; 2i, all conditions = 5 each; 2j, all conditions = 5 each; 2k for 0 / 7 / 21 / 60 dpi: WT = 17 / 12 / 11 / 8, ASO = 13 / 12 / 11 / 10.
Fig. 3 |
Fig. 3 |. ENS neurotransmission is disrupted by pathologic α-Syn and restored by GBA1 gene transfer.
a, Triple vector scheme to express jRGECO1a calcium indicator and Channelrhodopsin (ChR2-EYFP) in peripheral neurons via packaging in AAV-PHP.S. b, Immunohistochemical labeling depicts transduction efficiency of vector system to express jRGECO1a (αRFP) and ChR2-EYFP (αGFP). Open arrows mark co-expression and closed arrow marks ChR2-EYFP expression alone. Experimental images were obtained from 6 independent mice, with similar results obtained. Scale bar, 50 μm. c, Immunohistochemical labeling depicts transduction efficiency of jRGECO1a (αRFP) in enteric neurons (PGP9.5). Experimental images were obtained from 6 independent mice, with similar results obtained. Scale bar, 25 μm. d, Representative image of an excised duodenal segment prepared for calcium imaging. e, Representative calcium trace plotted as percent change in fluorescence compared to pre-stimulation baseline fluorescence. Green traces indicate jRGECO1a+/ChR2+ neurons. f, Representative images of jRGECO1a fluorescence in duodenal enteric neurons recorded in (e) depicting baseline (left) and peak (right) calcium activity after the photostimulation pulse. Green arrows indicate jRGECO1a+/ChR2+ neurons. Experimental images were obtained from 6 independent mice, with similar results obtained. Scale bar, 50 μm. g, Peak percent change in fluorescence for individual duodenal jRGECO1a+-only or jRGECO1a+/ChR2+ neurons after photostimulation pulse. h, Cumulative probability plots of peak calcium responses shown in (g). i, Quantification of average peak percent change in fluorescence and area under the curve after photostimulation pulse for jRGECO1a+-only or jRGECO1a+/ChR2+ duodenal neurons before and after inoculation. Boxplots represent median, interquartile range, and 1.5× the interquartile range (AUC jRGECO1a+/ChR2+: WT vs. PFF, 7 dpi *p = 0.0488, 60 dpi *p = 0.0214; all ****p < 0.0001). j, Quantification of average peak percent change in fluorescence and area under the curve after photostimulation pulse for jRGECO1a+-only or jRGECO1a+/ChR2+ duodenal neurons before and after systemic delivery of AAV-PHP.S::ihSyn:GBA1. Boxplots represent median, interquartile range, and 1.5× the interquartile range (Peak ΔF/F jRGECO1a+: ASO, 0 vs. 60 dpvi ***p = 0.0007, 7 vs. 60 dpvi **p = 0.0068). P values were determined by one-way ANOVA (i) or two-way ANOVA (j). The following n values represents number of independent animals used for statistical evaluation: 3i, WT no stim = 2, WT stim = 3, PFF 7 dpi = 4, PFF 60 dpi = 3, monomer 7 dpi = 3, monomer 60 dpi = 3; 3j, all conditions = 3.
Fig. 4 |
Fig. 4 |. Inoculating the duodenum of aged mice with α-Syn PFF promotes progression of p-α-Syn to the brain.
a, Duodenal GCase expression determined by densitometry analysis of Western blots from adult WT, aged, and adult ASO mice (WT vs. Aged **p = 0.0022, WT vs. ASO ****p < 0.0001). b-c, Duodenal α-Syn pathology determined by densitometry analysis of Western blots (b; WT vs. ASO ***p = 0.0006, Aged vs. ASO *p = 0.0202) and histological quantification of proportion of S129P+ neurons (c; WT vs. ASO *p = 0.0468). d-f, GI function in aged mice is characterized by fecal pellet weight (d; PFF 0 vs. 60 dpi *p = 0.0300, 0 vs. 120 dpi ***p = 0.0007), proportion fecal water weight (e; PFF 0 vs. 120 dpi *p = 0.0209), and whole gut fecal transit time (f; PFF 0 vs. 120 dpi *p = 0.0343). Boxplots represent median, interquartile range, and 1.5× the interquartile range. g-i, Sensorimotor performance in aged mice is characterized by weight-independent tasks: total slips during beam cross (g; PFF 0 vs. 60 dpi *p = 0.0110, 0 vs. 120 dpi ***p = 0.0002), average time to remove adhesive from nasal bridge (h; PFF 0 vs. 120 dpi *p = 0.0442), and weightlifting task (I; PFF 0 vs. 120 dpi ***p = 0.0006). Boxplots represent median, interquartile range, and 1.5× the interquartile range. j-k, Immunohistochemical labeling in aged mice of S129P in brainstem cholinergic (ChAT – choline acetyltransferase) neurons of the dorsal motor nucleus of vagus (DMV) (j) or midbrain dopaminergic (TH – tyrosine hydroxylase) neurons of the SNc (k) after α-Syn PFF inoculation 120 dpi. Experimental images were obtained from 8 independent mice, with similar results obtained. Scale bars, 50 μm. l-m, Densitometry analysis of S129P in the brainstem (l; PFF 0 vs. 120 dpi ***p = 0.0005) or midbrain (m). n, ELISA analysis of striatal dopamine levels (Aged PFF 0 vs. 120 dpi *p = 0.0487; ASO young vs. 12 m.o. **p = 0.0017). Data depicted are mean ± s.e.m. P values were determined by one-way ANOVA (a-c,n) or two-way ANOVA (d-i,l-m). The following n values represents number of independent animals used for statistical evaluation: 4d-i, for 0 / 60 / 120 dpi: monomer = 9 / 6 / 4, PFF = 10 / 7 / 6; 4l-m, all conditions = 4 each; 4n, ASO young = 4, ASO 12 m.o. = 6, for 0 / 60 / 120 dpi: WT = 4 / 4 / 4, Aged PFF = 5 / 5 / 6, Aged monomer = 0 / 4 / 4.

Comment in

  • A route for pathology?
    Yates D. Yates D. Nat Rev Neurosci. 2020 Apr;21(4):179. doi: 10.1038/s41583-020-0288-0. Nat Rev Neurosci. 2020. PMID: 32152522 No abstract available.

References

    1. McCann H, Stevens CH, Cartwright H & Halliday GM α-Synucleinopathy phenotypes. Parkinsonism Relat. Disord 20, S62–S67 (2014). - PubMed
    1. Lees AJ, Hardy J & Revesz T Parkinson’s disease. Lancet 373, 2055–66 (2009). - PubMed
    1. Hawkes CH, Del Tredici K & Braak H A timeline for Parkinson’s disease. Parkinsonism Relat. Disord 16, 79–84 (2010). - PubMed
    1. Sánchez-Ferro Á et al. In vivo gastric detection of α-synuclein inclusions in Parkinson’s disease. Mov. Disord. Off. J. Mov. Disord. Soc 30, 517–524 (2015). - PubMed
    1. Shannon KM et al. Alpha-synuclein in colonic submucosa in early untreated Parkinson’s disease. Mov. Disord. Off. J. Mov. Disord. Soc 27, 709–715 (2012). - PubMed

Publication types

Substances