. 2020 Mar;23(3):386-397.
doi: 10.1038/s41593-020-0590-1. Epub 2020 Feb 17.

A native function for RAN translation and CGG repeats in regulating fragile X protein synthesis

Affiliations

A native function for RAN translation and CGG repeats in regulating fragile X protein synthesis

Caitlin M Rodriguez et al. Nat Neurosci. 2020 Mar.

Abstract

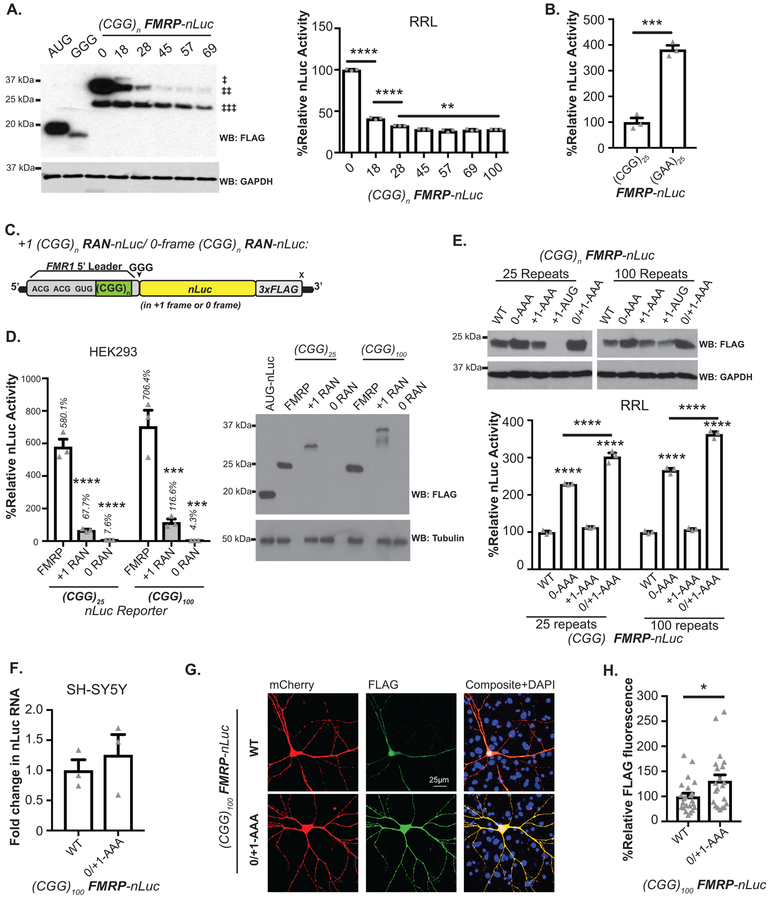
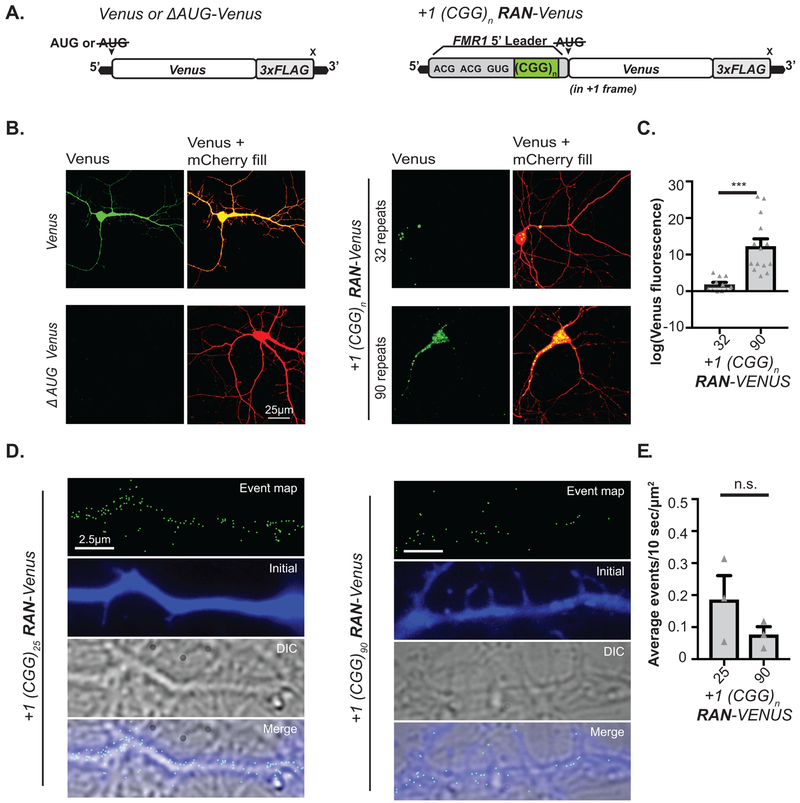
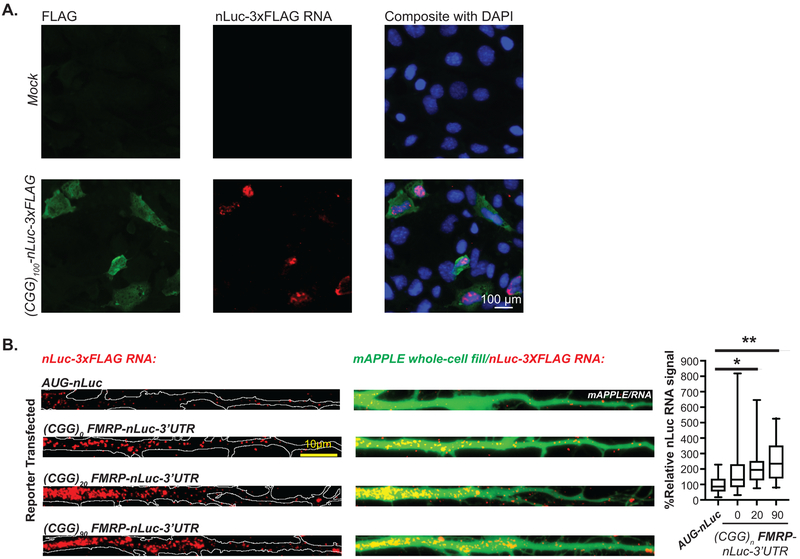
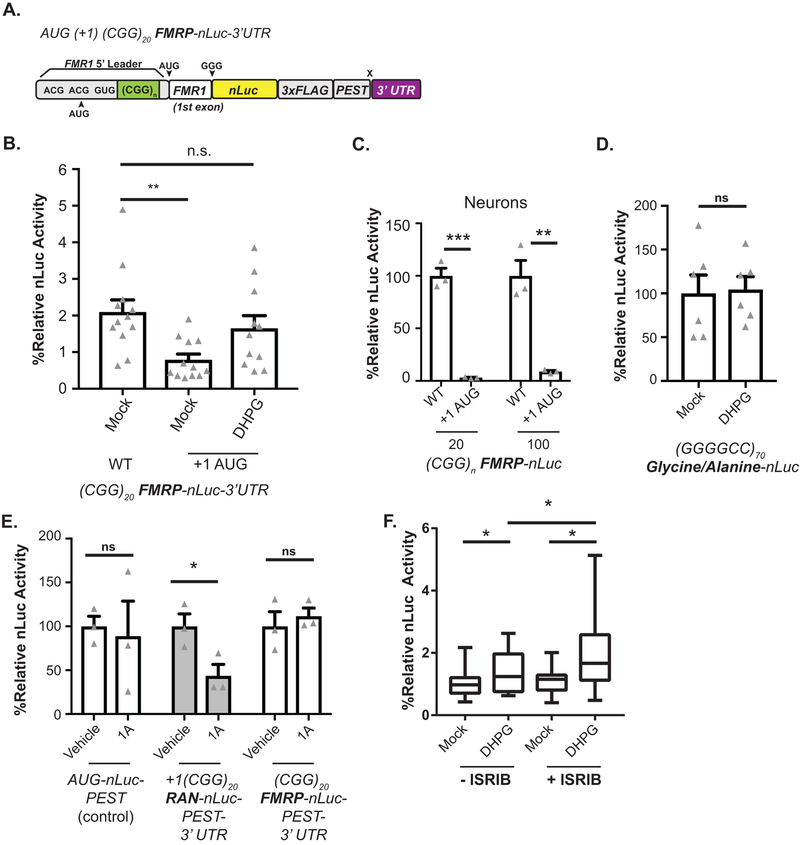
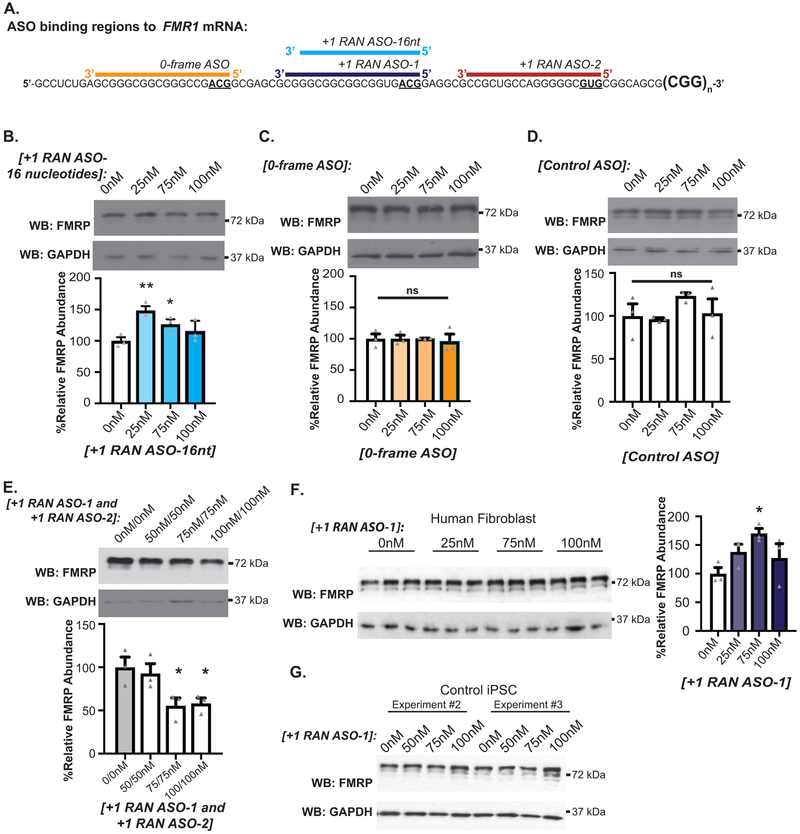
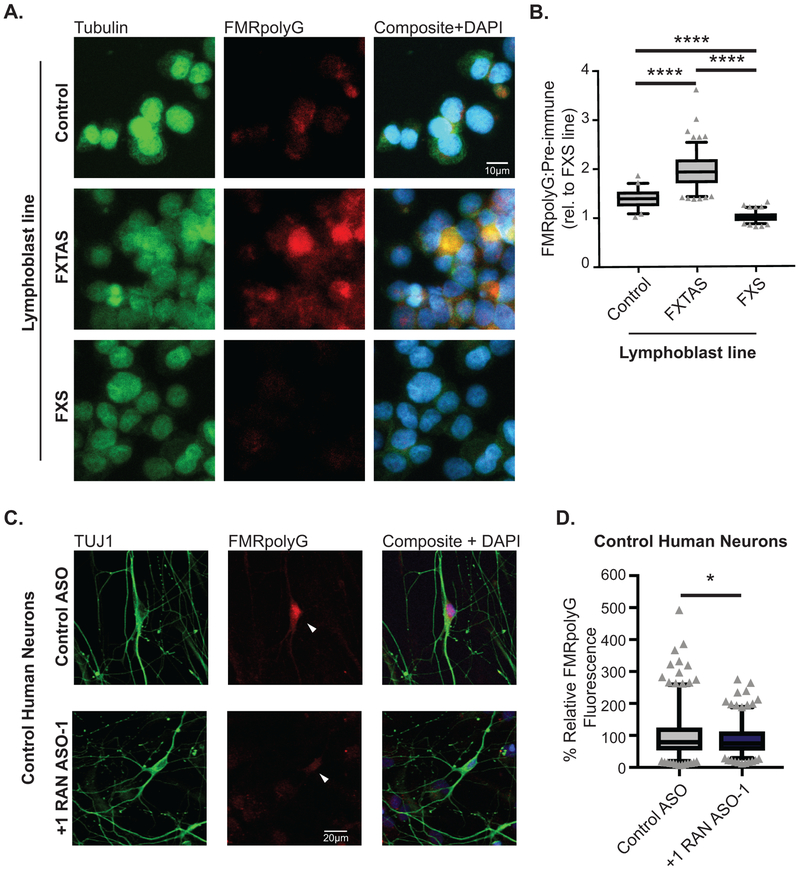
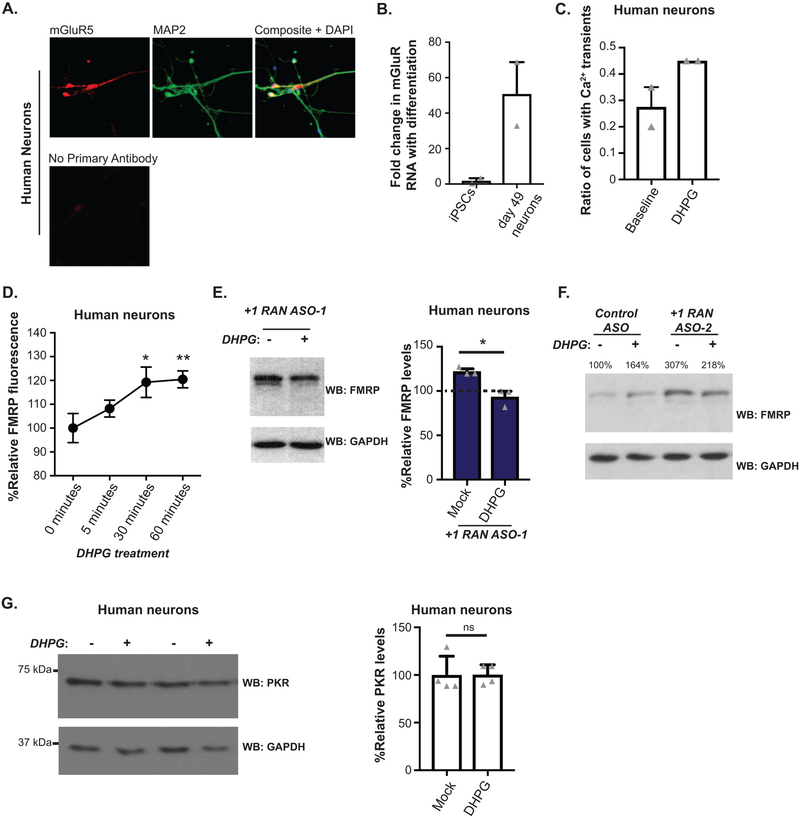
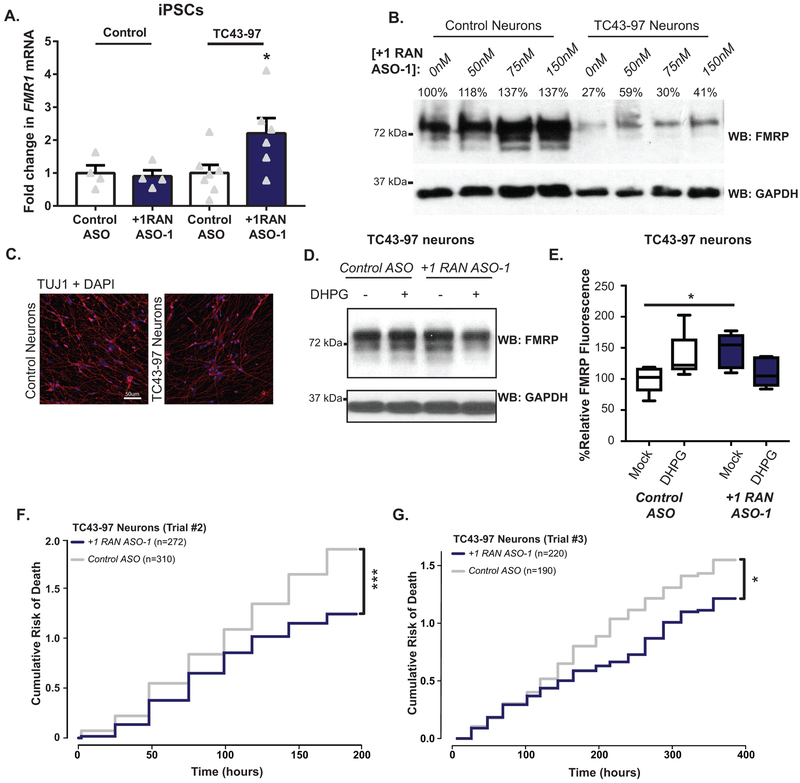
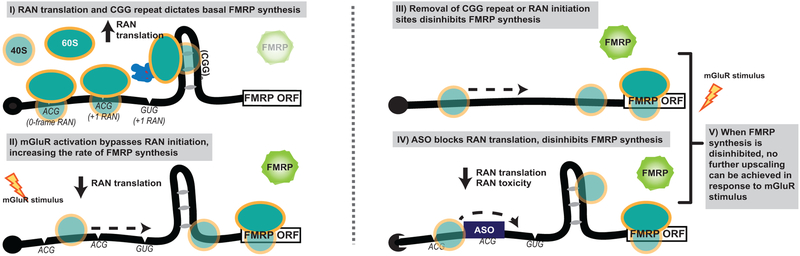
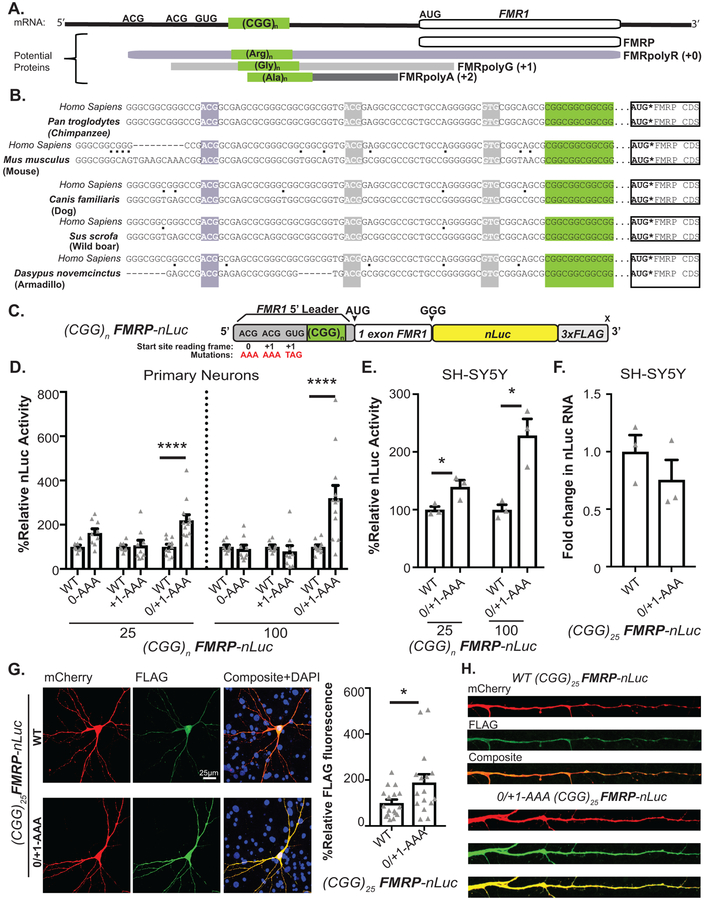
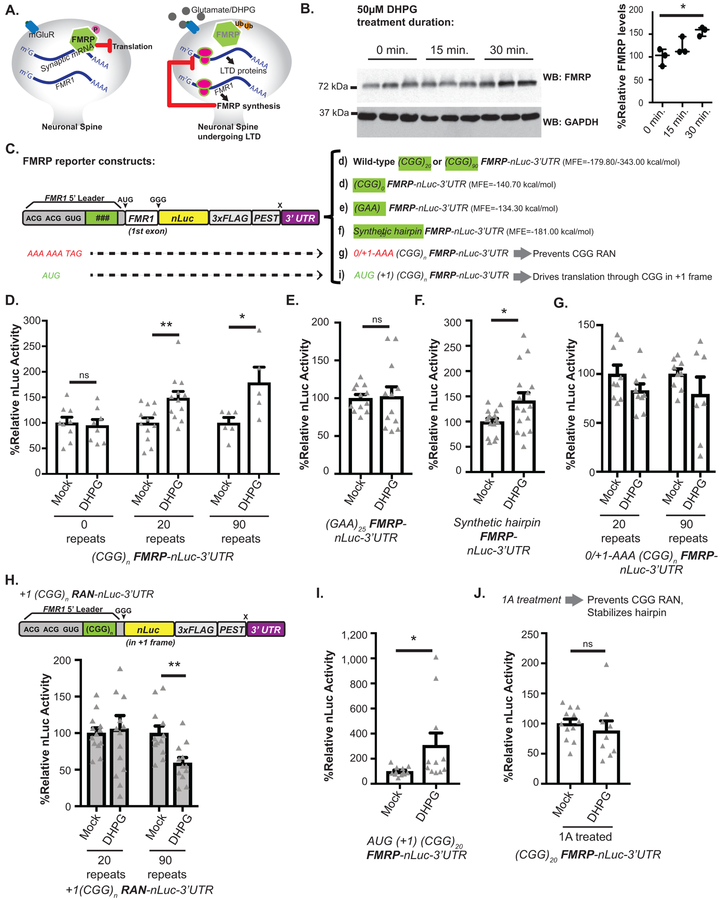
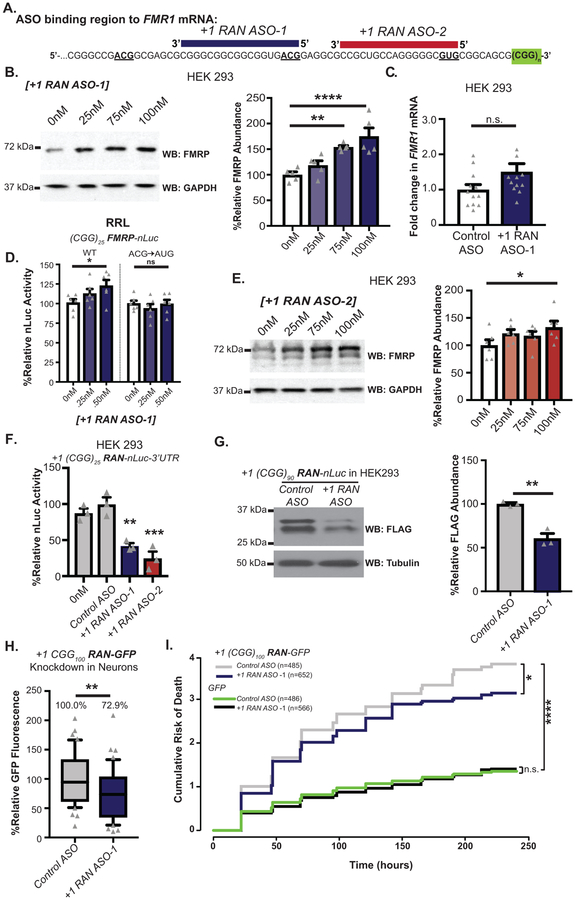
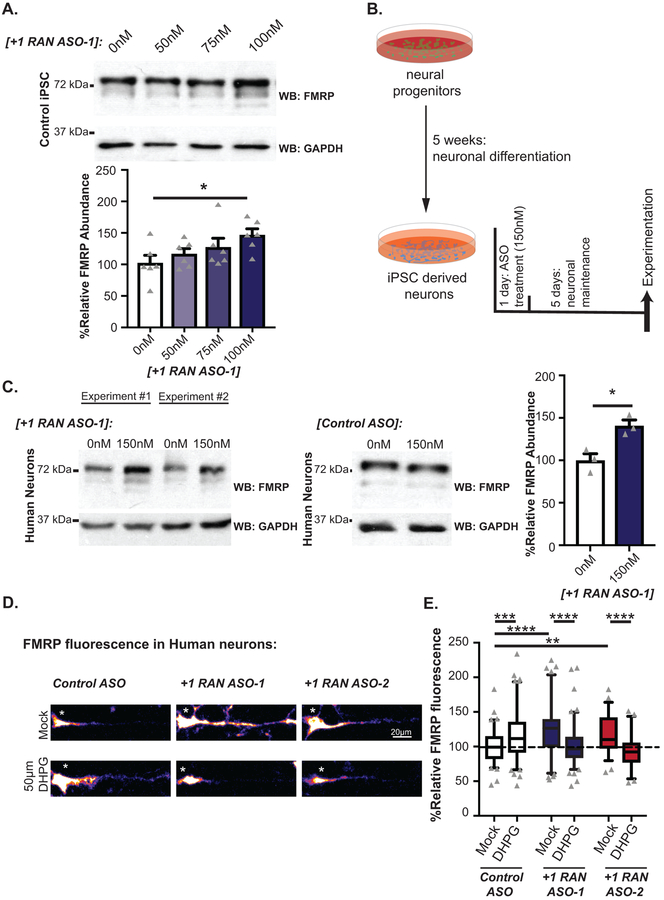
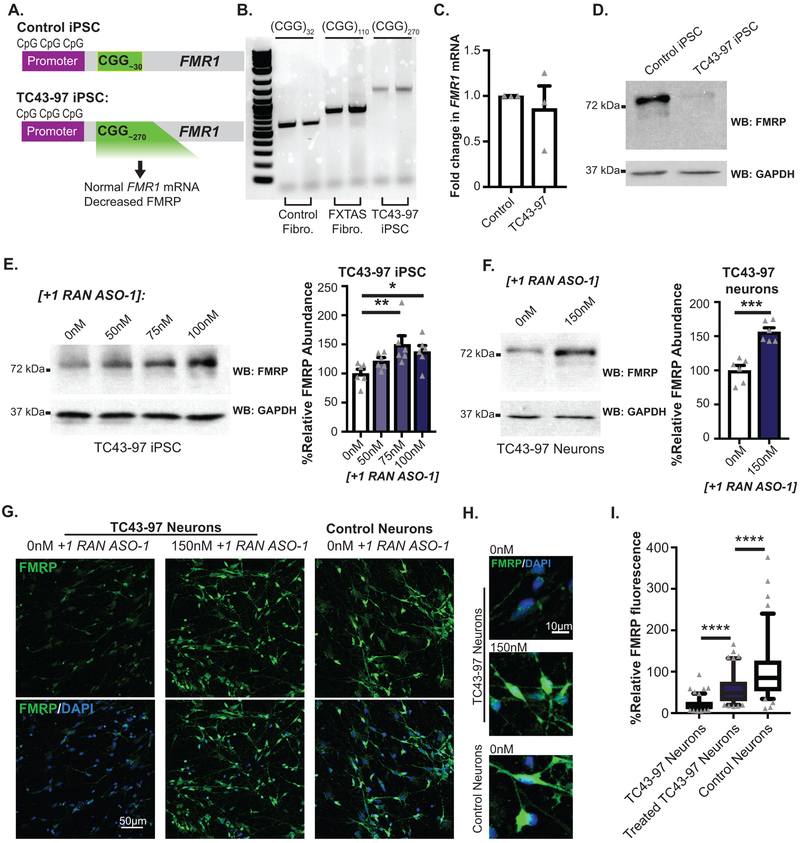
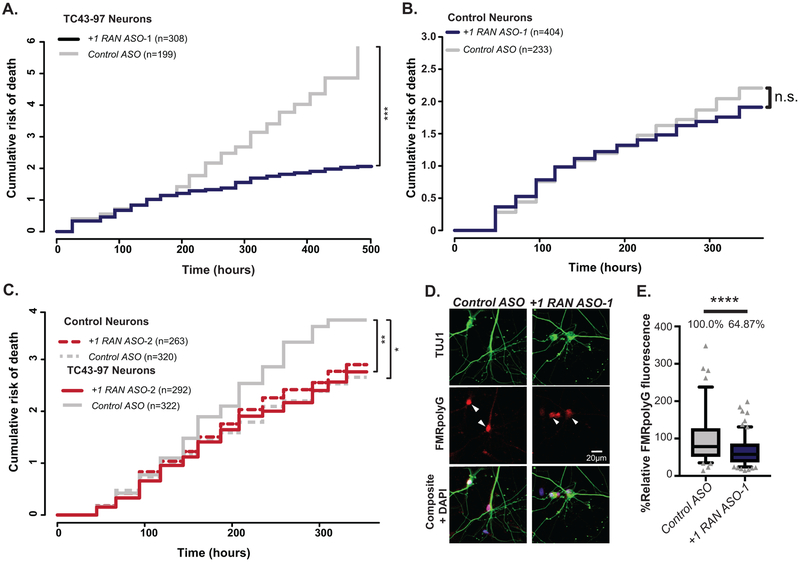
Repeat-associated non-AUG-initiated translation of expanded CGG repeats (CGG RAN) from the FMR1 5'-leader produces toxic proteins that contribute to neurodegeneration in fragile X-associated tremor/ataxia syndrome. Here we describe how unexpanded CGG repeats and their translation play conserved roles in regulating fragile X protein (FMRP) synthesis. In neurons, CGG RAN acts as an inhibitory upstream open reading frame to suppress basal FMRP production. Activation of mGluR5 receptors enhances FMRP synthesis. This enhancement requires both the CGG repeat and CGG RAN initiation sites. Using non-cleaving antisense oligonucleotides (ASOs), we selectively blocked CGG RAN. This ASO blockade enhanced endogenous FMRP expression in human neurons. In human and rodent neurons, CGG RAN-blocking ASOs suppressed repeat toxicity and prolonged survival. These findings delineate a native function for CGG repeats and RAN translation in regulating basal and activity-dependent FMRP synthesis, and they demonstrate the therapeutic potential of modulating CGG RAN translation in fragile X-associated disorders.


Conflict of interest statement

Competing interests

P.K.T. served as a consultant with Denali Therapeutics and has licensed technology through the University of Michigan to Denali. P.K.T., C.M.R, F.R., and P.J. hold a patent on ASOs targeting CGG RAN. F.R. and P.J. are paid employees of Ionis Pharmaceuticals. All other authors declare no competing interests.

Figures

Extended Data Fig. 1
Extended Data Fig. 1. Impact of CGG RAN translation on FMRP reporter synthesis.
A) Left: in vitro translated (CGG)n FMRP-nluc reporter mRNAs harboring different CGG repeat sizes. ‡‡‡: FMRP-nanoluciferase-3X FLAG protein. ‡: N-terminal extension of FMRP from RAN initiation at the ACG codon in the (polyarginine) 0-frame. ‡ is detected at up to 18 repeats, but is attenuated at normal repeat sizes as previously described. ‡‡: N-terminal extension of FMRP from initiation in the 0-frame, downstream of the repeat. The ‡‡ product is only detectable in vitro, and is not detectable in cells. Right: Luciferase activity of in vitro translated FMRP-nLuc reporters (n=3; 0 vs 18: p=0.000000000000033; 18 vs 28: p=000001109; 28 vs 45: p=0.00234; 28 vs 57: p=0.0000518; 28 vs 69: p=0.0004997; 28 vs 100: p=0.001371). B) Luciferase activity from FMRP reporter in vitro after replacement of (CGG)25 repeat with unstructured (GAA)25 repeat (n=3; p=0.4940). C) Schematic of RAN translation reporters. D) Left: luciferase activity showing relative levels of FMRP, +1 RAN, and 0-frame RAN reporters at 25 and 100 repeats in HEK293 cells (n=3; CGG25: FMRP vs +1 RAN p=0.00002612, FMRP vs 0-frame RAN p=0.00001338; CGG100: FMRP vs +1 RAN p=0.0009, FMRP vs 0-frame RAN p=0.0003). E) Top: Immunoblot of (CGG)n FMRP-nLuc reporters in HEK293T cells with indicated mutations. Bottom: luciferase activity from reporters translated in vitro (RRL). +1-AUG represents insertion of AUG in place of +1 ACG RAN initiation codon. RAN initiation sites in the (CGG)n FMRP-nLuc reporters were mutated to preclude initiation in the 0-frame (0-AAA), the +1 reading frame (+1-AAA), or both (0/+1-AAA) (n=3; CGG25: WT vs 0-AAA p=0.0001, WT vs +1-AAA p=0.1977, WT vs 0/1-AAA p=0.0001; CGG100: WT vs 0-AAA p=0.0001, WT vs +1-AAA p=0.4437, WT vs 0/1-AAA p=0.0001). F) RT-qPCR to nLuc mRNA from SH-SY5Y cells expressing the indicated FMRP reporters with 100 repeats (n=3; p=0.4940). G) Flag immunocytochemistry for (CGG)100 FMRP-nLuc reporters in rat neurons co-expressing mCherry (red) to fill the cell. H) Quantification of Flag signal for the WT (CGG)100 reporter (n=23) and for the 0/+1-AAA (CGG)100 reporter (n=21), where “n” is the mean CTCF signal from 5 neurons (p=0.0258). Panel A: One-way ANOVA with multiple comparisons. Panels D, E: One-way ANOVA with multiple comparisons, within repeat groups. Panel B, F, H: two sided Student’s t-test. n.s.=not significant, *p<0.05, **p<0.01, ***p<0.001, ****p<0.0001. Graphs are mean +/− S.E.M.
Extended Data Fig. 2
Extended Data Fig. 2. Live tracking of CGG RAN translation in neuronal dendrites.
A) Left: Venus with and without (ΔAUG) an AUG initiation codon serve as a positive and negative translation control. Right: Venus fluorescent proteins with the AUG deleted were inserted after the 5’ leader of FMR1, in the +1 (FMRpolyG) reading frame to serve as a reporter for +1CGG RAN. B) Live imaging of mature rat hippocampal neurons expressing indicated Venus reporters (green) and mCherry (red). C) Quantification of Venus reporter signals with 32 repeats (n=11) or 90 repeats (n=14) (p=0.0002). D) Single molecule imaging of CGG RAN translation in distal neuronal processes expressing indicated +1CGG RAN-Venus reporters after photo bleaching. Green dots represent individual translation events. E) Quantification of CGG RAN events in processes (n=3; p=0.2355). Panels C, E: Two sided Student’s t-test. n.s.=not significant, ***p<0.001. Graphs are mean +/− S.E.M.
Extended Data Fig. 3
Extended Data Fig. 3. FMR1 reporter mRNA trafficking in neuronal dendrites.
A) Mouse embryonic fibroblasts were transfected with +1 (CGG)100 RAN-nLuc reporters or mock transfected were probed for nLuc RNA by Hybridization Chain Reaction (HCR) and co-stained for FLAG. The specificity of the probes for nLuc is illustrated by the presence of signal (red) in transfected cells only. B) Left: HCR of nLuc mRNA combined with ICC to co-transfected mApple verifies dendritic export of reporter RNAs. Right: Quantification of dendritic nLuc reporter mRNA; AUG-nLuc (n=16), 0 repeat (n=16), 20 repeats (n=18), 90 repeats (n=20) (AUG vs 0: p=0.1447; AUG vs 20: p=0.0373; AUG vs 90: p=0.0044). One-way ANOVA with correction for multiple comparisons. Box extends to 25th/75th percentiles with a line at mean and whiskers indicate 95% CI.
Extended Data Fig. 4
Extended Data Fig. 4. Modifiers of mGluR dependent FMRP reporter synthesis.
A) Schematic of the AUG (+1) CGGn FMRP-nLuc-3’UTR reporter, which drives translation in the +1 RAN reading frame and reports for FMRP. B) relative nLuc values in neurons transfected with CGG25 or CGG100 FMRP-nLuc-3’UTR reporters with or without a +1 AUG mutant 5’ leader region (n=3; CGG20: p=0.0002; CGG100: p=0.0036). C) Relative nLuc values in neurons transfected with CGG25 FMRP-nLuc-3’UTR reporters: WT (n=12), +1 AUG/Mock (n=12), +1 AUG/DHPG (n=11) (WT/Mock vs +1AUG/mock: p=0.005; WT/Mock vs +1AUG/DHPG: p=0.4504). D) Rat hippocampal neurons were transfected with a nLuc construct for the C9Orf72 G4C2 hexanucleotide repeat in the Glycine/Alanine reading frame (n=6; p=0.8642). E) Hippocampal neurons were treated with 1A at 20 hours post-transfection. Quantification of nLuc expression following 3 hours of 1A treatment is represented for each indicated reporter (n=3; AUG/Vehicle vs AUG/1A: p=0.8038; RAN/Vehicle vs RAN/1A: p=0.0437; FMRP/Vehicle vs FMRP/1A: p=0.5728). F) Rat hippocampal neurons were treated with ISRIB 6 hours before treatment with vehicle or DHPG (Mock/Mock: n=18, Mock/DHPG n=18, ISRIB/Mock n=17, ISRIB/DHPG n=18; Mock/Mock vs Mock/DHPG: p=0.0342, Mock/DHPG vs ISRIB/DHPG: p=0.0678, ISRIB/Mock vs ISRIB/DHPG: p=0.0058). Panel B, C, F: One-way ANOVA with multiple comparisons. Panel D, E: Two sided Student’s t-test. n.s.=not significant, *p<0.05, **p<0.01, ***p<0.001. Graph is mean +/− S.E.M.
Extended Data Fig. 5
Extended Data Fig. 5. CGG RAN ASOs in human cell lines.
A) Schematic of other tested non-cleaving RAN blocking ASOs. Colored bars overlap the corresponding FMR1 5’ leader sequence and start sites; 0 frame ACG (orange), +1 frame ACG (+1RAN ASO-1, purple(18nt) or blue(16nt)) and +1 frame GUG (+1RAN ASO-2, maroon). B) Effect of +1RAN ASO-16 nucleotide on endogenous FMRP expression (0nM vs 25nM: p=0.0021; 0nM vs 75nM: p=0.0404; 0nM vs 100nM: p=0.2021). C) Effect of +0 RAN ASO (18nt) on endogenous FMRP expression (0nM vs 25nM: p=0.9999; 0nM vs 75nM: p=0.9997; 0nM vs 100nM: p=0.9580). D) Effect of Control ASO on endogenous FMRP expression (0nM vs 25nM: p=0.8183; 0nM vs 75nM: p=0.1780; 0nM vs 100nM: p=0.8486). E) Effect of combinatorial treatment with (+1RAN ASO-1 and +1RAN ASO-2 on endogenous FMRP expression at indicated doses (0nM vs 50nM: p=0.6231; 0nM vs 75nM: p=0.0127; 0nM vs 100nM: p=0.0171). F) Impact of +1RAN ASO-1 transfection into patient derived fibroblasts (0nM vs 50nM: p=0.2795; 0nM vs 75nM: p=0.0336; 0nM vs 100nM: p=0.5035). G) Representative immunoblot of FMRP expression after treatment with +1RAN ASO-1 (technical replicates of main figure 4a) in transfected control iPSCs. For all experiments, n=3, replicated in 3 independent experiments. For all graphs: One-way ANOVA with a Fisher’s LSD test for dose dependency. n.s.=not significant, *p<0.05, **p<0.01. Graphs are mean +/− S.E.M.
Extended Data Fig. 6
Extended Data Fig. 6. FMRpolyG expression in human cells and control human neurons.
A) Immunocytochemistry against FMRpolyG on Control ((CGG)23), FXTAS ((CGG)100–117), and FXS ((CGG)931–940, fully methylated) patient derived lymphoblasts. B) Rater-blinded quantification of FMRpolyG staining expressed as a ratio to pre-immune serum at the same concentration (μg/mL) on the same cells. Values are expressed relative to the FXS line, which does not express the FMR1 transcript (Control n=50, FXTAS n=133, FXS n=102; p=0.0000000000005). C) Immunocytochemistry to FMRpolyG (red) in mature control human neurons (TUJ1-positive (green)) treated with +1RAN ASO-1 or Control ASO treatment. D) Quantification of FMRpolyG signal with +1RAN ASO-1 (n=90) or Control ASO (n=69) treatment, where “n” is the mean CTCF signal from 5 neurons (p=0.0485). Panel B: Kruskal Wallis test with post-hoc two sided Mann Whitney U tests. Panel D: Two sided unpaired Student t-test. *p<0.05, ****p<0.0001. Box extends to 25th/75th percentiles with a line at mean and whiskers indicate 95% CI. Marked dots are only shown for values outside the 95% CI.
Extended Data Fig. 7
Extended Data Fig. 7. RAN ASOs block mGluR-dependent FMRP translation in human neurons.
A) Immunocytochemistry for mGluR5 in control human iPSC-derived neurons. B) mGluR mRNA expression as quantified by RT-PCR in Control iPSCs vs. neurons at day 49 of differentiation (n=2). C) Impact of 5 minutes of 50μM DHPG on calcium transients in human iPSC derived neurons. Graph represents number of neurons with active calcium transients compared to total number of neurons tracked over two independent neuronal cultures (n=2). D) Time course of DHPG effect on FMRP levels in human neurons (0 min: n=20, 5 min: n=35, 30 min: n=34, 60 min: n=46; 0 vs 5 min: p=0.2972, 0 vs 30 min: p=0.0158, 0 vs 60 min: p=0.0072). E) Left: Immunoblot from Control human neurons treated with +1RAN ASO-1 with or without DHPG treatment. Right: Quantification of FMRP expression in human neurons treated with DHPG after pretreatment with +1RAN ASO-1 relative to Control ASO treated neurons (n=3; p=0.0110). F) Representative western of FMRP expression after DHPG in control human neurons pretreated with the indicated ASOs and then treated with vehicle or DHPG. G) PKR has a 30-nucleotide CGG repeat in its 5’ leader. Endogenous expression of PKR was assessed after vehicle or DHPG treatment in iPSC-derived control human neurons. Left: representative immunoblot to PKR after indicated treatments. Right: Quantification of PKR expression by immunoblot in response to DHPG treatment (n=4; p=0.9696). Panel B, C, E, G: Two sided unpaired student t-test. Panel D: One-way ANOVA with multiple comparisons and post-hoc LSD. *p<0.05, **p<0.01. Graphs are mean +/− S.E.M (+/− SD for B and C).
Extended Data Fig. 8
Extended Data Fig. 8. Characterization of unmethylated Fragile X full mutation iPSC line TC43–97.
A) Detection of three pluripotency markers—OCT-3/4, Nanog, and SSEA4—in the TC43–97 iPSCs confirms successful reprogramming of the fibroblast line. B) Cytogenetic analysis of cells in metaphase revealed an apparently normal male karyotype of TC43–97 iPSCs. C) Methylation sensitive qPCR of FMR1 promoter demonstrates lack of DNA methylation in TC43–97 iPSCs. Methylation levels were calculated relative to the FX hESC condition (n=3). D) Quantification of immunoblots to FMRP in the TC43–97 iPSCs relative to Control (n=3; p=0.0088). Panel D: Two sided Student’s t-test, **p<0.01. Graphs are mean +/− S.E.M.
Extended Data Fig. 9
Extended Data Fig. 9. +1RAN ASO effects in TC43–97 neurons.
A) RT-PCR from indicated iPSC lines 24 hours after transfection with indicated ASOs: Control/Control ASO (n=4), Control/+1RAN ASO-1 (n=4), TC43–97/Control ASO (n=7), TC43–97/+1RAN ASO-1 (n=6, p=0.0522). B) Representative western blot showing relative FMRP expression in both Control and TC43–97 neurons treated with increasing doses of +1RAN ASO-1. Each lane is quantified relative to GAPDH and as a percent of the untreated control neurons. C) Soma (DAPI, blue) and processes (Tuj1, red) of differentiated neurons are TUJ1 positive in both control and TC43–97 neurons. D) Representative FMRP immunoblot from TC43–97 neurons treated with DHPG and indicated ASOs. E) Quantification of FMRP fluorescence by immunocytochemistry in human neurons treated as indicated, normalized to untreated Control ASO neurons quantified in parallel. Average fluorescence was binned for every 5 neurons consecutively analyzed to represent an individual data point. (Control ASO/Mock: n=7, Control ASO/DHPG: n=5, +1RAN ASO-1/Mock: n=6, +1RAN ASO-1/DHPG: n=5; Control ASO/Mock vs +1RAN ASO-1/Mock: p=0.0163). F) Survival analysis of TC43–97 iPSC derived neurons treated with 150nM +1RAN ASO-1 (n=272) or Control ASO (n=310), independent experiment and neuronal derivation #2 (p=0.000148). G) Survival analysis of TC43–97 iPSC derived neurons treated with 150nM +1RAN ASO-1 (n=220) or Control ASO (n=190), independent experiment and neuronal derivation #3 (p=0.027). Survival is plotted as cumulative risk of death. Panel C: Two sided Student T-test. Panel E: Two-way ANOVA with post-hoc correction for multiple comparisons. Panels F, G: Cox proportional hazard analysis. n.s.= not significant. * p<0.05. ***p<0.001. Graph is mean +/− S.E.M. Box extends to 25th/75th percentiles with a line at mean and whiskers indicate 95% CI.
Extended Data Fig. 10
Extended Data Fig. 10. Proposed Model for how RAN translation regulates FMRP synthesis.
CGG RAN regulates FMRP synthesis by limiting access of initiation complexes to the AUG initiation codon of FMRP in a repeat-dependent manner. II: mGluR activation bypasses CGG RAN, which allows for enhanced synthesis of FMRP. III: In the absence of CGG RAN or CGG repeat, steady-state FMRP synthesis increases but is decoupled from mGluR activation. IV: Non-cleaving RAN ASOs prevent CGG RAN initiation. This increases steady-state FMRP production, decreases FMRpolyG production and enhances neuronal survival.
Figure 1:
Figure 1:. CGG RAN translation impedes FMRP translation in neurons.
A) FMR1 mRNA support synthesis of 4 different proteins: Initiation at the AUG codon below the 5’ leader is used to produce FMRP (white). RAN translation initiates at three near-AUG codons in the 5’ leader generate FMRpolyR (+0, creating an N-terminal extension on FMRP (slate), and FMRpolyG (+1, creating an overlapping uORF(grey). Initiation within the repeat itself generates FMRpolyA (+2, creating a uORF that terminates prior to AUG of FMRP, charcoal). B) Interspecies conservation of start sites for +0CGG RAN (slate) and +1CGG RAN (grey) and their reading frames relative to CGG repeat (green) and FMRP ORF(white). C) FMRP reporter schematic: Nanoluciferase (nLuc, yellow) start codon is mutated to GGG and fused in-frame with the first coding exon of FMR1 (white). Mutation of one (0-AAA or +1-AAA) or all (0/+1-AAA) initiation codons in the 5’ leader (gray) indicated. D) (CGG)n FMRP-nLuc activity with or without mutated CGG RAN initiation sites in rat hippocampal neurons (CGG25: WT n=8, +0-AAA n=9, WT n=8, +1-AAA n=9, WT n=11, +0/+1-AAA n=12, p=0.001; CGG100: WT n=8, +0-AAA n=9, WT n=8, +1-AAA n=9, WT n=11, +0/+1-AAA n=12, p<0.001). E) FMRP-nLuc reporters in SH-SY5Y cells (n=3/group; CGG25: p=0.04, CGG100: p=0.01). F) FMRP reporter mRNA in SH-SY5Y cells by RT-qPCR (n=3; p=0.15). G) Representative ICC images from 3 independent experiments for (CGG)25 FMRP-nLuc-Flag (green) in neurons co-expressing mCherry (red). Right: Signal from indicated (CGG)25 reporters, normalized to mCherry (WT: n=17, 0/+1AAA: n=16, where “n” is the mean CTCF signal from 5 neurons; p=0.02). H) Representative straightened dendrites expressing indicated reporters from three independent experiments. Panel D: Two-way ANOVA with multiple comparisons within repeat groups. Panels E, F: Two sided unpaired Student’s t-test. Panel H: Two sided Mann Whitney U test. *p<0.05, ****p<0.001. Graphs are mean +/− S.E.M.
Figure 2:
Figure 2:. mGluR dependent FMRP synthesis requires RAN translation and CGG repeat.
A) FMRP inhibits translation. Upon mGluR-stimulation, FMRP is ubiquitinated and degraded, which enhances translation of bound transcripts. mGluR activation also increases FMR1 mRNA translation. This new FMRP turns off local translation to temporally constrain mGluR effects. B) Left: Endogenous FMRP in rat hippocampal neurons treated with DHPG for indicated times. Right: Quantification of FMRP, normalized to GAPDH (n=3, p=0.016). C) FMRP reporters with indicated mutations to repeat (green) or RAN initiation sites. The minimum free energy (MFE) of each 5’ leader is noted. D) DHPG effect on FMRP reporters with different CGG repeats in rat hippocampal neurons (CGG0: mock n=12, DHPG n=11, p=0.34; CGG25: mock n=12, DHPG n=12, p=0.007; CGG100: mock n=5, DHPG n=6, p=0.027). E) DHPG effect on (GAA)25 FMRP-nLuc reporter expression (n=12, p=0.86). F) DHPG effect on synthetic hairpin-FMRP-nLuc reporter expression (n=16, p=0.021). G) DHPG effect on FMRP-nLuc reporters with mutated CGG RAN initiation codons (0/+1-AAA) (n=9; CGG20: p=0.16, CGG90: p=0.2). H) DHPG effect on +1 CGG RAN reporters (CGG20: mock n=13, DHPG n=14, p=0.16; CGG90: mock n=12, DHPG n=12, p=0.20). I) DHPG effect on FMRP-nLuc reporter with AUG initiation codon in place of ACG +1CGG RAN initiation codon (mock n=12, DHPG n=11, p=0.039). J) Effect of 1A pretreatment on (CGG)20 FMRP-nLuc reporter expression in neurons treated with vehicle (n=12) or DHPG (n=9, p=0.48). For all, white bars: FMRP reporter; grey bars: RAN reporter. Panel B: One-way ANOVA with correction for multiple comparisons. Panels D, E, F, G, I, J: Two sided Student t-test. Panel H: Two sided Mann Whitney U test. *p<0.05, **p<0.01. Graphs are mean +/− S.E.M.
Figure 3:
Figure 3:. RAN targeting ASOs increase FMRP and suppress CGG repeat toxicity.
A) Non-cleaving, +1CGG RAN blocking antisense oligonucleotides (+1RAN ASO-1, purple and +1RAN ASO-2, maroon) overlap the FMR1 5’ leader and ACG start site or GUG start site, respectively. B) Left: Endogenous FMRP expression in HEK293 cells transfected with +1RAN ASO-1. Right: Quantification of 5 independent experiments, normalized to GAPDH and expressed as % of mean 0nM control (n=5; 0nM vs 25nM: p=0.2056; 0nM vs 75nM: p=0.0013; 0nM vs 100nM: p<0.001). C) RT-qPCR on endogenous FMR1 mRNA with or without +1RAN ASO-1(100nM) (n=12, p=0.015). D) In vitro (RRL) nLuc assay with WT or mutant (CGG)25 FMRP-nLuc reporter mRNAs in the presence of increasing +1RAN ASO-1. Mutant reporter has AUG in place of ACG initiation codon (n=6; WT 0nM vs 0.25nM: p=0.2092; WT 0nM vs 0.50nM: p=0.0255). E) Endogenous FMRP expression in HEK293 cells transfected with +1RAN ASO-2 (n=6; 0nM vs 25nM: p=0.1236; 0nM vs 75nM: p=0.2090; 0nM vs 100nM: p=0.0224). F) +1CGG25 RAN-nLuc signal in HEK293 cells transfected with control ASO, +1 RAN ASO-1 (100nM), or +1 RAN ASO-2 (100nM) (n=3; Control vs 0nM: p=0.5452; Control vs +1RAN ASO-1: p=0.0016; Control vs +1RAN ASO-2: p<0.001). G) Immunoblot and bar graph of +1CGG25 RAN-nLuc-Flag in HEK293 cells transfected with control ASO or +1RAN ASO-1 (100nM) (n=3; p=0.0028). H) Quantification of +1CGG RAN reporter product (+1(CGG)90 RAN-Venus) in neurons treated with +1RAN ASO-1 (n=42) or Control ASO (n=41) for 5 days (p=0.0075). I) Survival analysis by longitudinal fluorescence microscopy on rat cortical neurons transfected with +1 (CGG)100 RAN-GFP treated with 1μM +1RAN ASO-1 or Control ASO (n=485, n=552, respectively) or GFP treated with 1μM +1RAN ASO-1 or Control ASO (n=486, n=566, respectively). Panels B-H: Two sided Student’s t-test with correction for multiple comparisons. Panel I: Cox proportional hazard analysis. n.s.=not significant, *p<0.05, **p<0.01, ****p<0.001. Panel B-G: Graphs are mean +/− S.E.M. Panel H: box extends to 25th/75th percentiles with a line at mean and whiskers indicate 95% CI.
Figure 4:
Figure 4:. CGG RAN ASOs alter FMRP translation dynamics in human neurons.
A) FMRP in control iPSCs transfected with the indicated doses of +1RAN ASO-1 (n=6; 0nM vs 50nM: p=0.3857; 0nM vs 75nM: p=0.1370; 0nM vs 100nM: p=0.0126). B) Schematic of neuronal ASO treatment protocol. C)FMRP in neurons from untreated, +1RAN ASO-1 treated iPSC neurons or Control ASO treated neurons (n=3; p=0.0167). D) Representative images of control neurons treated with indicated ASOs +/− DHPG. E) Quantification of FMRP fluorescence in human neurons treated with indicated ASO (150nM), normalized to untreated control ASO performed in parallel (Control ASO/Mock n=88, Control ASO/DHPG n=101, +1RAN ASO-1/Mock n=97, +1RAN ASO-1/DHPG n=102, +1RAN ASO-2/Mock n=56, +1RAN ASO-2/DHPG n=55, where “n” is the mean CTCF signal from 5 neurons. Control ASO/Mock vs Control ASO/DHPG: p<0.001; Control ASO/Mock vs +1RAN ASO-1/Mock: p<0.001; Control ASO/Mock vs +1RAN ASO-2/Mock: p=0012; +1RAN ASO-1/Mock vs +1RAN ASO-1/DHPG: p<0.001; +1RAN ASO-2/Mock vs +1RAN ASO-2/DHPG: p<0.001). Panel A: One-way ANOVA with multiple comparisons. Panel C, E: Two sided Student’s t-tests with Bonferroni correction. *p<0.05, **p<0.01, ****p<0.0001. Panel A, C: Graphs are mean +/− S.E.M. Panel E: box extends to 25th/75th percentiles with a line at mean and whiskers indicate 95% CI.
Figure 5:
Figure 5:. RAN ASO increases FMRP in unmethylated full mutation (UFM) neurons.
A) Schematic of TC43-clone 97 (TC43–97) UFM male iPSC clones. Control iPSCs harbor 30 CGG repeats and unmethylated promoter. B) PCR amplification of 5’ leader region of FMR1 demonstrates repeat size in control fibroblasts, FXTAS fibroblasts, and TC43–97 iPSCs. C) FMR1 mRNA expression in TC43–97 and Control iPSCs (n=3; p=0.6058). D) Cropped immunoblot of FMRP expression in TC43–97 and Control iPSCs (representative of 3 independent experiments). E) FMRP expression in TC43–97 iPSCs transfected with +1RAN ASO-1, quantified on right (n=6; 0nM vs 50nM: p=0.1468; 0nM vs 75nM: p=0.0025; 0nM vs 100nM: p=0.0167). F) FMRP immunoblot in untreated and +1RAN ASO-1 treated neurons, quantified at right (n=6; p<0.001). G) FMRP (green) in TUJ1-positive TC43–97 neurons treated with +1RAN ASO-1. Blue: DAPI. 40X image. Scale bar: 50μm. H) 60x images of FMRP signal in TC43–97 or control neuronal soma and processes after indicated treatments. I) Quantification of FMRP expression in untreated TC43–97 neurons (n=120), treated TC43–97 neurons (n=100), and control neurons (n=95), where “n” is the mean CTCF signal from 5 neurons (Control vs untreated TC43–97: p<0.001; Control vs treated TC43–97: p<0.001; untreated vs treated TC43–97: p<0.001). Panel C and F: Two sided Student t-test. Panel E: One-way ANOVA with a Fisher’s LSD test. Panel I: Kruskal Wallis Test with correction for multiple comparisons. *p<0.05, **p<0.01, ***p<0.001, ****p<0.0001. Panel C, E, F: Graphs are mean +/− S.E.M. Panel I: box extends to 25th/75th percentiles with a line at mean and whiskers indicate 95% CI.
Figure 6:
Figure 6:. CGG RAN ASO enhances survival in expanded repeat human neurons.
A) Survival analysis in TC43–97 human neurons treated with 150nM +1RAN ASO-1 (n=308) or Control ASO (n=199) (p<0.001). B) Survival analysis in control human neurons treated with 150nM +1RAN ASO-1 (n=404) or Control ASO (n=233) (p=0.709). C) Survival analysis in TC43–97 (n=292, 322) and control (n=263, 320) human neurons treated with 150nM +1RAN ASO-2 or Control ASO, respectively (Control/Control ASO vs TC43–97/Control ASO: p=0.0105, TC43–97/Control ASO vs TC43=97/+1RAN ASO-2: p=0.0015). D) Immunocytochemistry to FMRpolyG (red) in mature TC43–97 neurons (TUJ1-positive (green)) treated with +1RAN ASO-1 or Control ASO treatment. E) Quantification of FMRpolyG signal (corrected total cellular fluorescence) in TC43–97 neurons treated with +1RAN ASO-1 (n=194) or Control ASO (n=93), where “n” is the mean CTCF signal from 5 neurons (p<0.001). Panel A, B, C: Cox proportional hazard analysis. Survival is plotted as cumulative risk of death. Panel E: Two sided Mann Whitney U test. Box in graph extends to the 25th and 75th percentiles of data points with a line at the mean, and whiskers indicate 95% confidence interval. n.s.=not significant, *p<0.05, **p<0.01, ***p<0.001, ****p<0.0001.

References

    1. Paulson H in Handbook of clinical neurology Vol. 147 (eds Geschwind Daniel H., Paulson Henry L., & Klein Christine) 105–123 (Elsevier, 2018). - PubMed
    1. Hannan AJ Tandem repeats mediating genetic plasticity in health and disease. Nat Rev Genet 19, 286–298, doi:10.1038/nrg.2017.115 (2018). - DOI - PubMed
    1. Todd PK et al. CGG repeat-associated translation mediates neurodegeneration in fragile X tremor ataxia syndrome. Neuron 78, 440–455, doi:10.1016/j.neuron.2013.03.026 (2013). - DOI - PMC - PubMed
    1. Zu T et al. Non-ATG-initiated translation directed by microsatellite expansions. Proc Natl Acad Sci U S A 108, 260–265, doi:10.1073/pnas.1013343108 (2011). - DOI - PMC - PubMed
    1. Verkerk AJ et al. Identification of a gene (FMR-1) containing a CGG repeat coincident with a breakpoint cluster region exhibiting length variation in fragile X syndrome. Cell 65, 905–914 (1991). - PubMed

Publication types

MeSH terms

Substances