. 2020 Jan;2(1):97-109.
doi: 10.1038/s42255-019-0152-6. Epub 2019 Dec 23.

Single-cell analysis of human adipose tissue identifies depot and disease specific cell types

Affiliations

Single-cell analysis of human adipose tissue identifies depot and disease specific cell types

Jinchu Vijay et al. Nat Metab. 2020 Jan.

Abstract

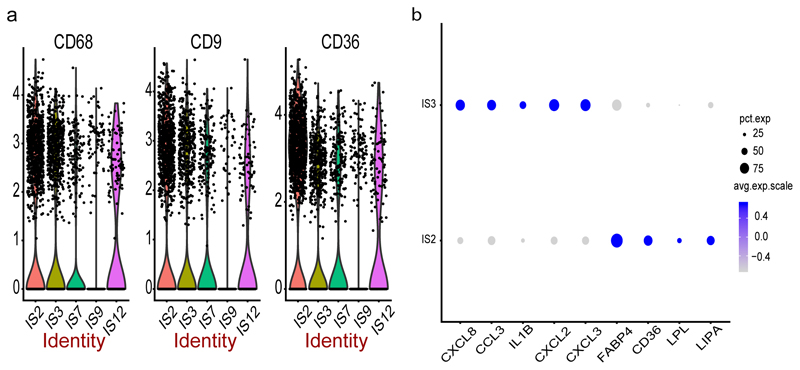
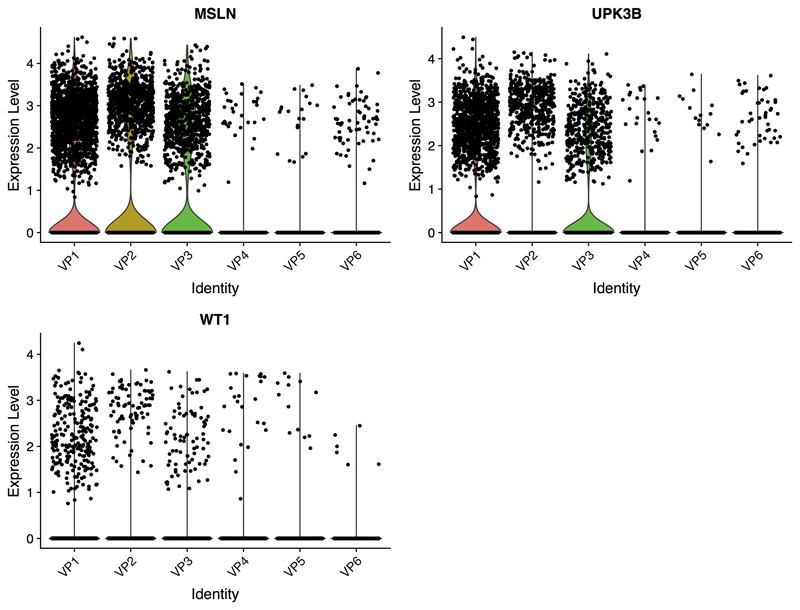
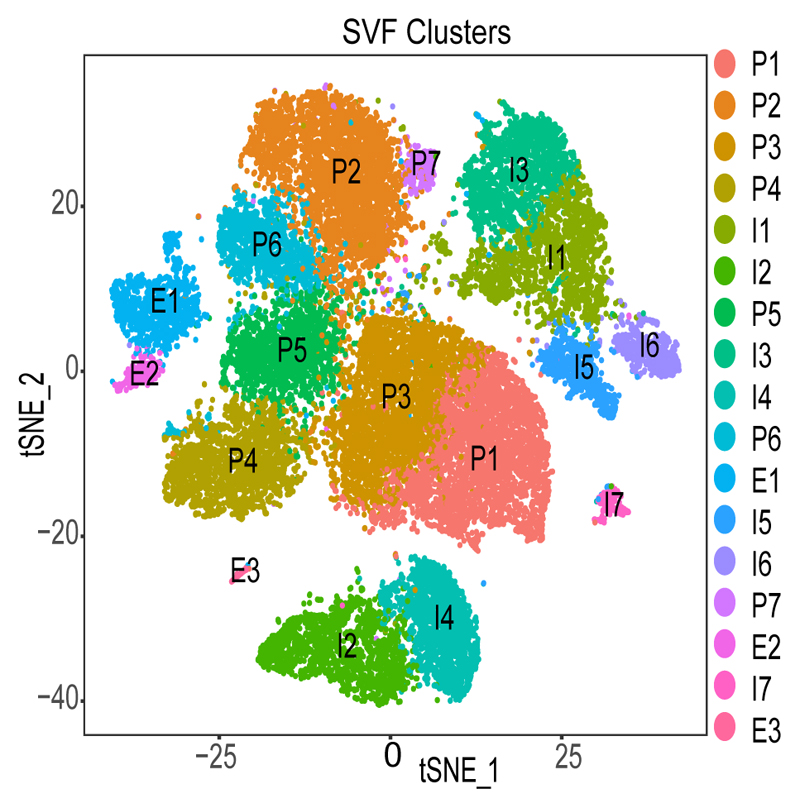
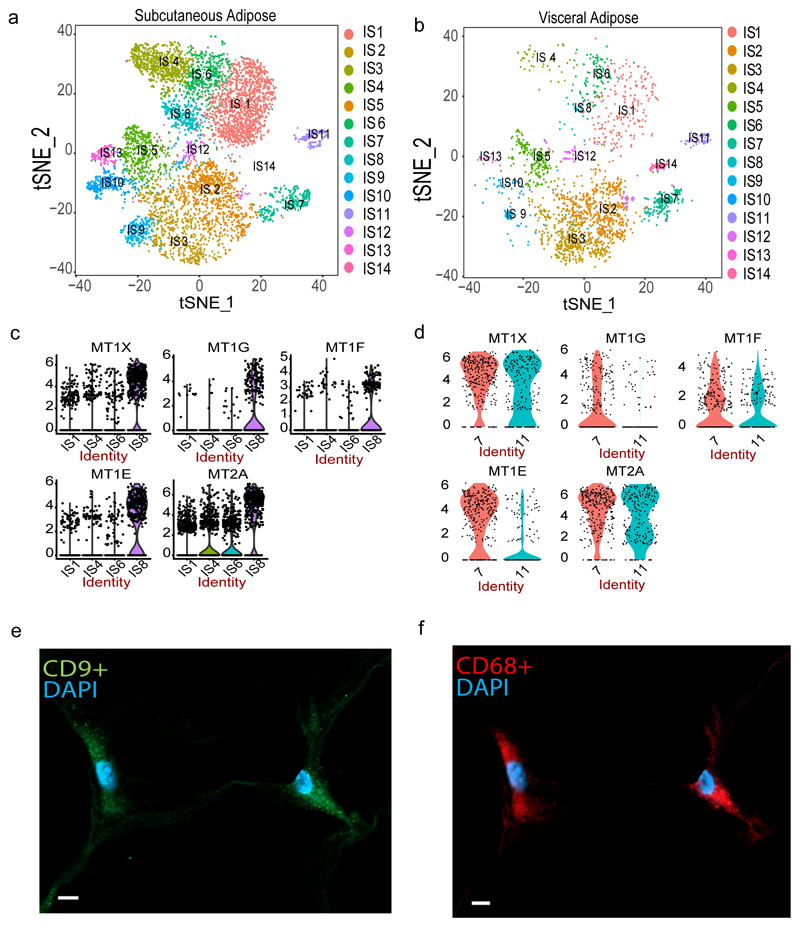
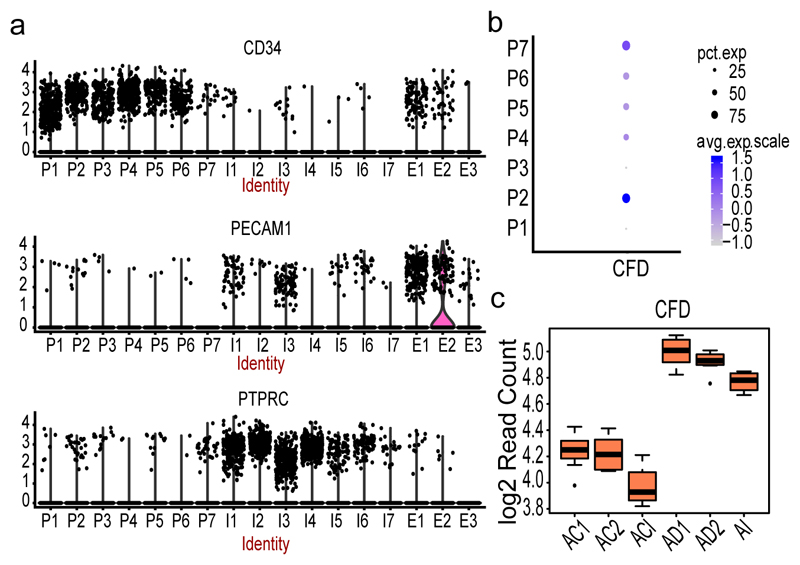
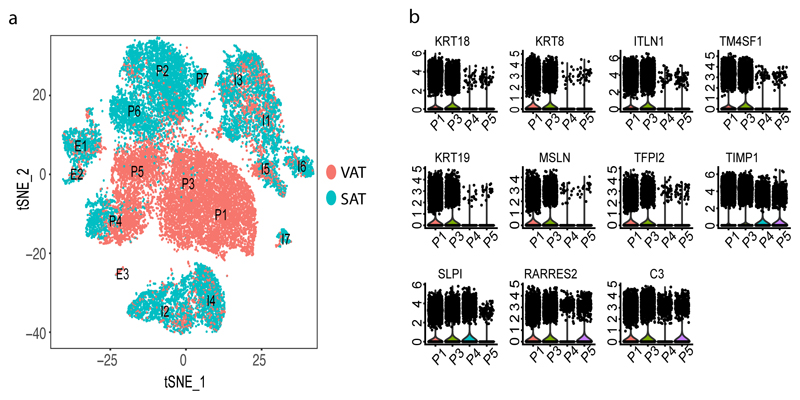
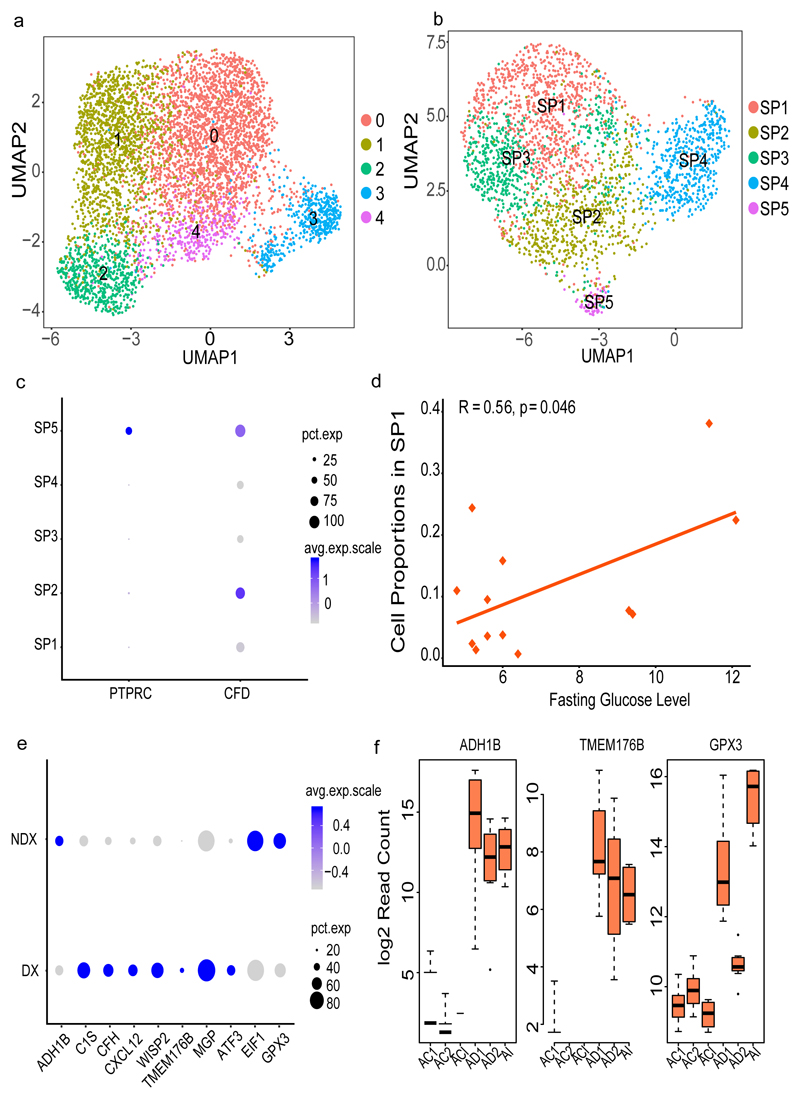
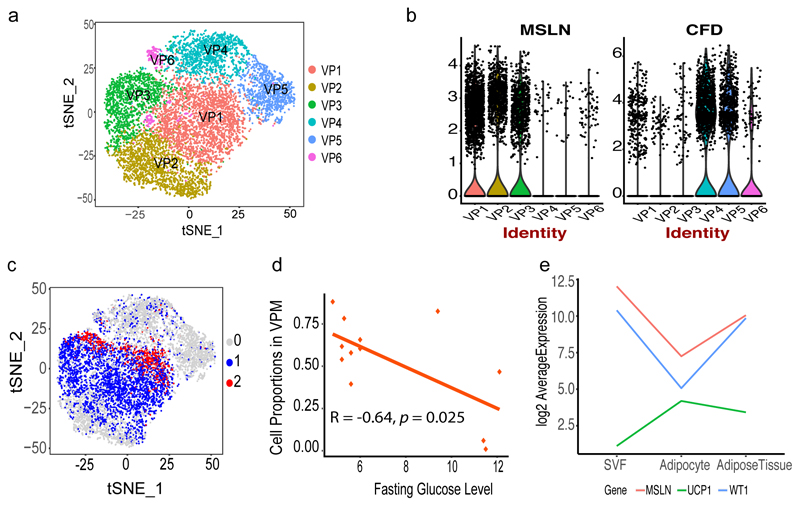
The complex relationship between metabolic disease risk and body fat distribution in humans involves cellular characteristics which are specific to body fat compartments. Here we show depot-specific differences in the stromal vascual fraction of visceral and subcutaneous adipose tissue by performing single-cell RNA sequencing of tissue specimen from obese individuals. We characterize multiple immune cells, endothelial cells, fibroblasts, adipose and hematopoietic stem cell progenitors. Subpopulations of adipose-resident immune cells are metabolically active and associated with metabolic disease status and those include a population of potential dysfunctional CD8+ T cells expressing metallothioneins. We identify multiple types of adipocyte progenitors that are common across depots, including a subtype enriched in individuals with type 2 diabetes. Depot-specific analysis reveals a class of adipocyte progenitors unique to visceral adipose tissue, which shares common features with beige preadipocytes. Our human single-cell transcriptome atlas across fat depots provides a resource to dissect functional genomics of metabolic disease.


Conflict of interest statement

Declaration of Interests A.T. receives funding from Johnson & Johnson Medical Companies and Medtronic for research unrelated to the present manuscript.

Figures

Extended Data 1
Extended Data 1
Multiple macrophage clusters were identified in SVF from both SAT and VAT depots (a) 4 distinct macrophage clusters showing varying expression of CD68 (19 - 52% of cells), CD9 (10 – 51% of cells) and CD36 (25 – 72% of cells). The y axis of the violin plot indicate log transformed expression values and the width indicate number of cells expressing the particular gene. (b)Genes involves in lipid metabolism is found expressed in macrophage cluster – IS2, whereas IS3 is rich in inflammatory markers.
Extended Data 2
Extended Data 2
Gene expression of marker genes in 6 visceral specific progenitor clusters. The y axis of the violin plot indicate log transformed expression values and the width indicate number of cells expressing the particular gene.
Figure 1
Figure 1. Identified cell populations in the non-adipocyte fraction of adipose tissue.
Clustering results of 26,350 cells from the stromal vascular fraction (SVF) derived from 25 adipose samples that underwent single-cell RNA sequencing identifying 17 clusters. Cell populations were classified as Progenitors (P), Immune cells (I) and Endothelial cells (E) and labelled accordingly.
Figure 2
Figure 2. SVF-derived immune cells.
Re-clustering of 9,025 CD34- cells representing immune cells in the stromal vascular fraction (SVF) of adipose tissue identified 14 cell types including T/NK cells (IS1, IS4, IS6, IS8), macrophages (IS2, IS3, IS7, IS9, IS12), dendritic cells (IS5, IS13), monocyte (IS10) and B-cells (IS11) in SAT (a) and VAT (b). Violin plots of expression density of Metallothionein genes across T / NK cell clusters in discovery (c) and CD34- validation samples (d) comprising 25 and 3 samples respectively. The y axis indicate log transformed expression values and the width indicate number of cells expressing the particular gene. Immunohistochemistry in subcutaneous adipose derived from a 60 year-old woman with a BMI of 52.2 kg/m2 showing co-expression of CD9 (e) and CD68 (f) cells. The scale bar indicates 5 μm. The staining was done on 4 independent individuals to confirm.
Figure 3
Figure 3. SVF-derived progenitor clusters.
(a) Violin plots of log transformed expression density of CD34 (upper panel), CD31/PECAM1 (middle panel) and CD45/PTPRC (bottom panel) across all SVF clusters from 25 samples. The width of the violin plot indicate number of cells expressing the particular gene. (b) Dot plot of the expression of CFD across progenitor (P) clusters. The size of the dot corresponds to the percentage of cells expressing CFD in each cluster and the color represents the average CFD expression level (c) Box plot of CFD expression at 4 different time points of adipocyte differentiation from mesenchymal stem cells (MSCs, n= 8 individuals). AI corresponds to the first time point three days after culturing MSCs in the induction media. AD1 and AD2 are 1 and 2 weeks of differentiation in adipogenic media after the AI time point. ACI, AC1 and AC2 are corresponding control sets for AI, AD1 and AD2 without any adipocyte differentiation treatments. Each time point with corresponding control includes three independent MSC cultures and shown by average log 2 read count. The black line inside the boxplot represent and median value and the size of the box is determined by the 25th and 75th percentile of the data. The wiskers of box plot represents the maximum and minimum values of the data shown.
Figure 4
Figure 4. Main cell clusters in SVF based on depot.
(a) Clustering results of all SVF samples that underwent single-cell RNA sequencing which identified 17 clusters from 26,350 cells. Clusters were classified as Progenitors (P), Immune cells (I) and Endothelial cells (E) and labelled accordingly. Cells are labelled as VAT (red)- or SAT (blue)-derived, respectively. (b)Violin plots of expression density of 11 genes that are specific to VAT progenitor clusters. The y axis indicate log transformed expression values and the width indicate number of cells expressing the particular gene.
Figure 5
Figure 5. Progenitor clusters specific to SAT.
(a) Re-clustering of SAT-specific progenitors from the complete sample set of 26,350 cells (b) Re-clustering of SAT-specific progenitors (2,705 cells) by subsampling the high coverage library to 1500 cells (c) Dot plot of the expression of PTPRC (CD45) and CFD across SAT progenitors (SP1-SP5). (d) Pearson correlation of fasting glucose levels (mmol/L) and SP1 proportion across all samples obtained from 13 individuals (e) Dot plot of differentially expressed SP1 genes in cells derived from T2D (DX) versus non-T2D (NDX) samples previously validated in the MuTHER study (f) Box plot of T2D-associated SP1 gene expression at different time points of adipocyte differentiation from mesenchymal stem cells (MSCs, n= 8 individuals). AI corresponds to the first time point three days after culturing MSCs in the induction media. AD1 and AD2 are 1 and 2 weeks of differentiation in adipogenic media after the AI timepoint. ACI, AC1 and AC2 are corresponding control sets for AI, AD1 and AD2 without any adipocyte differentiation treatments. Each timepoint with corresponding control includes three independent MSC cultures and shown by average log 2 read count and error bars corresponding to standard deviation. The black line inside the boxplot represent and median value and the size of the box is determined by the 25th and 75th percentile of the data. The wiskers of box plot represents the maximum and minimum values of the data shown. The size of the dot in (c) and (e) corresponds to the percentage of cells expressing the genes in each cluster and the color represents the average expression level.
Figure 6
Figure 6. Progenitor clusters specific to VAT derived from individuals with obesity.
(a) Re-clustering of VAT-specific progenitors (9,847 cells) from the complete sample set (b) Violin plots showing expression density of MSLN and CFD in 6 VP clusters. The y axis indicate log transformed expression values and the width indicate number of cells expressing the particular gene (c) VAT progenitor cells labelled based on mitochondrial gene distribution: group 0 (grey, 5,018 cells) shows cells with mitochondrial gene expression <=5%, group 1 (blue, 4,100 cells) represents 6% to 14% and group 2 (red, 729 cells) represents 15% to 24% expression. See also supplementary figure 5 (d) Pearson correlation of fasting glucose levels (mmol/L) and VPM cell proportion across all samples from 12 individuals (e) Expression pattern of UCP1, MSLN wnd WT1 using bulk RNASeq showing change in expression in mature adipocytes.
Figure 7
Figure 7. Progenitor clusters specific to VAT derived from a healthy individual.
(a) Re-clustering of progenitors identified 6 clusters comprising 1,781 cells(b) Umap highlighting expression of MSLN in all progenitor clusters(c) UCP1 expression was detected in cluster 0 which had high mitochondrial gene expression (d)

References

    1. Tchernof A, Despres JP. Pathophysiology of human visceral obesity: an update. Physiol Rev. 2013;93:359–404. doi: 10.1152/physrev.00033.2011. - DOI - PubMed
    1. Porter SA, et al. Abdominal subcutaneous adipose tissue: a protective fat depot? Diabetes Care. 2009;32:1068–1075. doi: 10.2337/dc08-2280. - DOI - PMC - PubMed
    1. Laforest S, Labrecque J, Michaud A, Cianflone K, Tchernof A. Adipocyte size as a determinant of metabolic disease and adipose tissue dysfunction. Crit Rev Clin Lab Sci. 2015;52:301–313. doi: 10.3109/10408363.2015.1041582. - DOI - PubMed
    1. Denis GV, Obin MS. 'Metabolically healthy obesity': origins and implications. Mol Aspects Med. 2013;34:59–70. doi: 10.1016/j.mam.2012.10.004. - DOI - PMC - PubMed
    1. Michaud A, et al. Relevance of omental pericellular adipose tissue collagen in the pathophysiology of human abdominal obesity and related cardiometabolic risk. Int J Obes (Lond) 2016;40:1823–1831. doi: 10.1038/ijo.2016.173. - DOI - PubMed

Publication types